
Research article · 2024 · Full text
International Journal of Agriculture Extension and Social DevelopmentDeveloping a knowledge assessment test (KAT) for buffalo farmers in Tamil Nadu
Volume 7(6) · Pages 171–177 · DOI: 10.33545/26180723.2024.v7.i6c.687 ↗
Research areasLivestock Management and Performance ImprovementAgricultural Economics and PracticesAgricultural Systems and Practices
Abstract
Author-writtenLivestock plays a pivotal role in the economic development of farmers, yet many buffalo farmers often lack awareness and knowledge regarding scientific management practices. Enhancing the cognitive standard of buffalo farmers necessitates an evaluation of their current level of knowledge on modern and scientific buffalo farming techniques in order to make them to adopt modern scientific methods and technologies in buffalo farming. With this goal, the present study aimed at the construction of a standardized knowledge test to assess the knowledge level of buffalo farmers regarding scientific buffalo farming practices. The current study endeavored to create a knowledge test aimed at assessing the knowledge level of buffalo farmers regarding various facets of buffalo farming in Tamil Nadu. Two blocks namely, Karamadai and Anamalai from Coimbatore district were purposively selected for the present study. The steps involved in development of knowledge test are selection of knowledge items thereby formation of universe of items, relevancy rating, item analysis to find out the item difficulty and discrimination indexes, running point bi-serial correlation, final selection of items and establishment of reliability and validity were followed to develop and standardize the test. A total of 75 items or questions were framed on Breeds and selection of animals, Breeding management, Feeding management, Health care management and General management. The knowledge items with a difficulty index between 0.30 and 0.70, a discrimination index above 0.30, and a point-bi serial correlation significant at the 5% level were selected for the final knowledge test. As a result, a total of 40 items out of the initial 75 were retained for the final knowledge test. The reliability coefficient value of 0.84 indicated that the test was highly significant. The study would be useful for researchers, academicians and policy makers to measure knowledge level of buffalo farmers before configuring capacity development programs or constructing development plans for buffalo farmers so as to make them a need based one.
Summary
Source-checkedPlain-language reading of the full paper, prepared with AI and checked against the text. Each point links to the authors' own words.
Why it matters
- Despite the importance of livestock, many buffalo farmers lack the necessary knowledge of modern, scientific management practices. View evidence ↗
- The successful adoption of recommended farming technologies depends on the farmers' comprehensive understanding of those practices. View evidence ↗
The question
- The study aimed to create and standardize a knowledge assessment test (KAT) to evaluate how much buffalo farmers in Tamil Nadu know about scientific farming practices. View evidence ↗
What they did
- The research was conducted in the Karamadai and Anamalai blocks of the purposively selected Coimbatore district in Tamil Nadu. View evidence ↗
- The study sample consisted of 96 buffalo farmers, with 12 individuals randomly selected from each of eight villages. View evidence ↗
- An initial universe of 75 test items was developed covering five areas: breeds/selection, breeding, feeding, health care, and general management. View evidence ↗
- Items were selected for the final test based on a difficulty index of 0.30–0.70, a discrimination index > 0.30, and a point-biserial correlation significant at the 5% level. View evidence ↗
What they found
- Out of the original 75 items, 40 were retained for the final standardized knowledge test after meeting the statistical criteria. View evidence ↗
- The test demonstrated high reliability with a split-half correlation coefficient of 0.84, significant at the 1% level. View evidence ↗
- The items were found to be valid indicators of buffalo farming knowledge, as shown by highly significant bi-serial correlation coefficients at the 0.05 probability level. View evidence ↗
What it means
- The authors conclude that the developed knowledge test is a stable, reliable, and validated tool for measuring the knowledge levels of buffalo farmers. View evidence ↗
- The authors recommend that policymakers use the test to identify knowledge gaps to improve the productivity and profitability of buffalo farming. View evidence ↗
Figures & tables
From the original paper Table 1
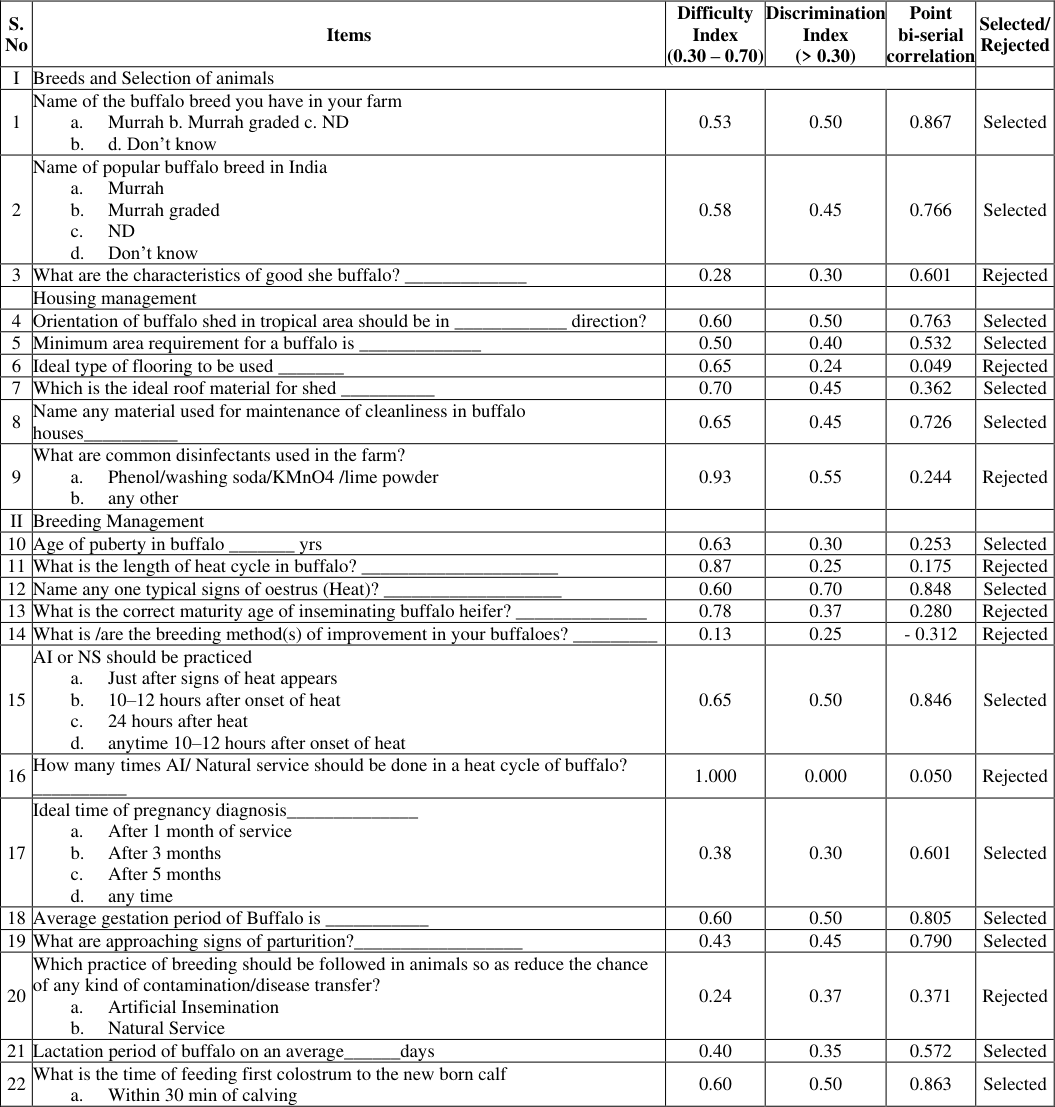 Table 2
Introduction
Agriculture plays an important role in the Indian economy where over 75 percent of the rural population relying on this enterprise and its related sectors as their primary source of income. Within the agriculture domain, livestock sector plays a multi-factorial role in the socio-economic development of rural farmers, contributing approximately 5.21 percent to the GDP and 28.36 percent to the agricultural GDP. Moreover, it offers employment opportunities for eight percent of the labor force (BAHS, 2020). India leads globally in cattle and buffalo population and stands as the largest milk producer in the world, accounting for 23 percent of the world's annual milk production (Anonymous, 2024) [2] . According to the 20 th livestock census, the country's total livestock population is 535.78 million, indicating a 4.6 percent increase since the 2012 census. The buffalo population stands at 109.85 million, reflecting a 1.0 percent increase from the previous census. India is also recognized as the home of some of worlds finest milch buffalo breeds (Anonymous, 2019) [1] . Buffaloes are highly valued not only for their superior butter and ghee production but also for their notable traits such as high disease resistance, higher fat content in milk, capability to efficiently utilize low-quality agricultural byproducts, and their ability to produce one kilogram of milk with fewer kilo calories. In Tamil Nadu, the buffalo population stood at 0.52 million in 2019, resulting in a milk yield of 0.251 million tonnes in the 2020-21 period. However, the average daily milk yield per buffalo in the state decreased from 4.08 kg to 3.54 kg during the same period (Vignesh et al., 2023) [11] . Livestock plays a pivotal role in the economic sustenance of farmers, yet many buffalo farmers often lack awareness and knowledge regarding latest and scientifically sound management practices. Enhancing the cognitive proficiency of buffalo caretakers necessitates an evaluation of their current comprehension of modern and efficient buffalo farming techniques. The effective implementation of recommended methodologies relies heavily on adopters possessing a comprehensive understanding of these practices and technologies. According to Vyas and Maheshwari (2009) [12] , the success or failure of any program or practice predominantly revolves around the awareness and knowledge of farmers toward innovations. Therefore, it is imperative to quantitatively assess the knowledge levels of stakeholders before get on any developmental initiatives. According to the modern definition provided by the Oxford Dictionary, knowledge encompasses familiarity, awareness, www.extensionjournal.com or understanding of someone or something, including facts, information, descriptions, or skills acquired through experience or education via perception, discovery, or learning. In the current context, "knowledge" refers to the comprehended information about recommended buffalo production practices possessed by buffalo keepers. Kerlinger (1964) [10] defines a test as a systematic procedure in which the individual being tested is presented with a set of constructed stimuli to which they respond, allowing the tester to make inferences about the intended trait. Bloom et al., (1995) [4] define a knowledge test as a test emphasizing recall of ideas, materials, or phenomena, thereby focusing on remembering behaviors and situations. Consequently, a knowledge test can be understood as a measurement instrument for assessing the current proficiency, mastery, and understanding of both general and specific areas of knowledge. Considering these aspects, the present study aims to develop a knowledge test to evaluate the knowledge of buffalo farmers in Tamil Nadu.
Materials and Methods
Materials and Methods
Locale of research and selection of respondents
The current study made an effort to design a knowledge test aimed at assessing the knowledge level of buffalo farmers regarding various features of buffalo farming in Tamil Nadu. The selection criteria for districts, blocks, and villages were determined based on the buffalo population in the state as recorded in the 20 th livestock census.
Selection of the district
The study aimed to investigate the knowledge level of buffalo farmers in Tamil Nadu. Therefore, it was decided to select a district that not only has a substantial buffalo population but is also familiar to the researcher for conducting direct investigations. Consequently, Coimbatore district was purposively chosen for the study.
Selection of block
Coimbatore district spans from north to south and comprises thirteen blocks, namely Karamadai, Annur, Periya Naicken Palayam, S.S. Kulam, Sulur, Thondamuthur, Madukarai, Sultanpet, Kinathukadavu, Pollachi North, Pollachi South, Anamalai, and Valparai. Among these, Karamadai block in the northern part of Coimbatore and Anamalai block in the southern part are enriched by the Bhavani and Aliyar rivers, respectively. In comparison to other blocks in this district, a significant number of farmers residing along the banks of these two blocks are engaged in buffalo farming alongside agriculture. Therefore, these two blocks, namely, Karamadai and Anamalai, were purposively selected for the present study.
Selection of villages
From the chosen blocks, four villages, namely Periya Thottipalayam, China Thottipalayam, Therampalayam, and Bellathi villages from Karamadai block, and Somandurai Chitoor, Thensangam Palayam, Anamalai, and Kottur villages from Anamalai block were randomly selected for the study, resulting in a total of eight villages.
Selection of respondents
The study's objective was to create a knowledge test to assess the knowledge level of buffalo farmers concerning various facets of buffalo farming. Farmers who rear buffaloes either as their primary livestock or alongside white cattle were categorized as buffalo farmers and are included as respondents. Thus, a total of 96 buffalo farmers were selected for the study, with 12 farmers randomly chosen from each of the eight selected villages.
Development of Knowledge Test
In the present study, the knowledge test on Buffalo farming was developed according to the methodology given by Edwards (1957) [5] and as adopted by Jha and Singh (1970) [9] was with necessary modifications.
Universe of items
According to Garret (1966), "any test contains problems or tasks graded in difficulty from very easy to very hard by known steps or intervals." These problems or tasks are referred to as test items. The content of the knowledge test comprises questions known as items. An exhaustive list of statements, problems, or tasks related to the knowledge domain of buffalo farming was compiled through various processes, including consulting relevant literature, discussions with subject matter specialists, and drawing from the personal experiences of the researchers in this field, thus, in total, 75 items were included, covering all aspects of buffalo production knowledge. Care was taken during item generation to ensure they were based essentially on farmer's knowledge. Additionally, efforts were made to ensure that the sentences were simple, easily comprehensible, and focused on a single idea per item. The items were meticulously edited to eliminate ambiguity, and followed a logical sequence. The knowledge test encompassed multiple-choice type questions (MCQs), Yes/No type questions, and direct questions. It was tailored to assess the knowledge of buffalo farmers in specific subareas viz., breeds and selection, housing management, breeding management, feeding management, health care management, and general management. Each area comprised of at least five to eight questions, resulting in a total of 75 items covering all aspects of the buffalo farming operations.
Relevancy analysis
Seventy-five items were chosen for the development of the knowledge test and structured into objective type questions. In this format, answers were constrained to options such as Yes or No, selecting from multiple choices, and fill in the blanks, ensuring an objective and impersonal evaluation process. Subsequently, these items were distributed to 30 subject matter experts / juries for a thorough examination of relevancy. The experts were tasked with carefully reviewing each item to determine whether it effectively measured the respondents' knowledge of buffalo production. They were given the liberty to suggest additions, deletions, or modifications to any of the items. Relevancy scores were assigned on a three-point scale, with items considered as "most relevant" receiving a rating of 3 and those considered "irrelevant" rated 1. Following the experts' input, all 75 items were finalized for the construction of the knowledge test.
Item analysis
Guilford suggested two types of information obtained from item analysis: item difficulty and item discrimination. However, Jha and Singh (1970) [9] introduced a technique that yielded three types of information: index of item difficulty, index of item discrimination, and index of item validity. This technique, encompassing all three aspects, was employed in the present study.
Difficulty Index (P) or (Pi)
The difficulty of an item can vary among individuals. If a respondent answers an item correctly, it suggests that the question was relatively less difficult for him. The underlying assumption regarding item difficulty index is that difficulty is linearly associated with the respondents' level of knowledge about buffalo management practices. The index of item difficulty indicates how challenging an item is to comprehend. Therefore, the difficulty index of an item is defined as the proportion of buffalo farmers who provide correct answers to that specific item. This is calculated using the following formula: Difficulty Index = (Number of respondents who answered the item correctly) / (Total number of respondents) × 100 Where Pi = Difficulty index in the percentage of i th item.
= Number of buffalo farmers giving the correct answer to the i th item. Ni = Total number of buffalo farmers to whom the i th item was administered.
Discrimination index
The discrimination index of an item is defined as the degree of differentiation between well-informed and poorly informed respondents. This index is indicated by the E values of the item. If an item is answered correctly by some respondents but not by others, it possesses greater discriminatory power to distinguish between more knowledgeable and less knowledgeable individuals compared to another statement that is either answered correctly by everyone or by no one in the sample. Essentially, items with higher discrimination power imply moderate difficulty and are the ones that effectively differentiate between those who answer correctly and those who do not. To determine the discrimination power of all 75 raw items, the E method was employed to calculate the item discrimination, as outlined below. To calculate the discrimination index, the 75 items were administered to 96 randomly selected respondents. Each statement warrant a response. A correct answer was scored as '1', while a wrong answer received '0' points. Thus, the total score obtained by an individual respondent on all 75 items represented his / her knowledge score. These scores were then arranged in descending order based on their magnitude, and the respondents were divided into six groups, each containing 12 respondents. The groups were labeled as G1, G2, G3, G4, G5, and G6. The middle two groups (G3 and G4) were eliminated, leaving only the four extreme groups: those with the highest and higher scores (G1 & G2) and those with the lower and lowest scores (G5 & G6). The discrimination index, which ranges from 0 to 1, was then calculated based on the responses of these four groups. The method suggested by Garrett (1969) [7] was adopted for the present study and the formula by which the item discrimination index was calculated is given below:
Where, N = Total number of respondents S1 and S2 = frequencies of correct answers of highest and higher groups, respectively S5 and S6 = frequencies of correct answers of lower and lowest groups, respectively.
Index of item validity
In this study, point-biserial correlation was employed to test item validation. The primary aim of calculating pointbiserial correlation was to assess the internal consistency of items, specifically the relationship between the total score and a dichotomized answer to each item. The criterion for validity is considered as the internal consistency of the test, which reflects the relationship between the total score and a correct/incorrect response to each item. Essentially, the validity power of an item was computed by correlating the individual item with the entire test. The point-biserial correlation for each item to the preliminary knowledge test was calculated using the formula provided by Garrett and Woodworth (1969) [6] and tested at N-2 degrees of freedom.
Where, r p bis = Point bi-serial correlation Mp = Mean of total scores of respondents (answered item correctly) Mq = Mean of total scores of respondents (answered item incorrectly) sd = Standard deviation of entire sample p = Proportion of respondents answering correctly q = Proportion of respondents answering incorrectly
Results and Discussions
Data collection involved administering the knowledge tool to 96 farmers from Karamadai and Anamalai blocks of Coimbatore district. Each of the 96 respondents was presented with all 75 items. Responses were collected and quantified by assigning a score of 1 for a correct answer and 0 for an incorrect answer. A respondent's total score was determined by summing the scores for all questions. Once the scores obtained by the 96 respondents were calculated, they were arranged in descending order from highest to lowest according to magnitude. Subsequently, the respondents were divided into six equal groups, each containing sixteen members. These groups were labeled as G1, G2, G3, G4, G5, and G6. www.extensionjournal.com For item analysis, the middle two groups (G3 and G4) were removed, leaving only the four extreme groups (G1, G2, G5, G6) with high and low scores. Subsequently, the difficulty index and discrimination index of each item were analyzed using the formulas mentioned earlier. The difficulty index indicated how difficult an item was, while the discrimination index indicated the extent to which an item distinguished well-informed individuals from poorly informed ones. Following the analysis of responses, items with a difficulty index between 0.30 and 0.70, a discrimination index above 0.30, and a point-biserial correlation significant at the 5% level were selected for the final knowledge test. This ensured that the items were neither too difficult nor too easy to answer and could effectively discriminate between well-informed and lessinformed individuals. As a result, a total of 40 items out of the initial 75 were retained for the final knowledge test. These items were considered optimal as they met the criteria of being appropriately challenging and discriminatory, thus effectively assessing respondents' knowledge levels.
Method of scoring knowledge
The final knowledge test comprises 40 items related to practices in buffalo farming. Respondents are asked to provide responses to each question, either with a yes or no, or with a specific answer to some direct questions. Accordingly, they are awarded one mark for each correct answer and zero marks for each incorrect or "don't know" response. The total knowledge score of each respondent on all items of the test is then calculated by summing up the scores of correct answers. The range of scores obtained by respondents can vary from 0 to 40. Based on their knowledge scores, farmers can be categorized as low, medium, or high knowledge respondents using the mean and standard deviation of their obtained scores. This categorization provides insight into the distribution of knowledge levels among the respondents.
Conclusion
The application of this knowledge test to assess the knowledge level of farmers in buffalo farming provides valuable insights into their existing knowledge levels. Researchers, institutes, and organizations can utilize this test to gauge the knowledge of respondents under study. By identifying the knowledge gaps, policymakers can make informed decisions to enhance productivity and profitability in buffalo farming. Furthermore, this test can be instrumental in evaluating the effectiveness of knowledge enhancement interventions. The simplicity and comprehensibility of the test items make it user-friendly and accessible for farmers and extension functionaries alike. Extension functionaries can leverage this test to organize various activities, including training programs, to address knowledge gaps effectively. In conclusion, this knowledge test is highly stable, reliable, and construct validated for measuring the level of knowledge of buffalo farmers in buffalo farming. Its widespread application has the potential to contribute significantly to the improvement of buffalo farming practices and outcomes.
Figures and tables from the paper
| Group no. | G1 | G2 | G3 | G4 | G5 | G6 |
|---|---|---|---|---|---|---|
| Range of scores obtained | 68-62 | 61-53 | 52-45 | 44-36 | 35-28 | 27-20 |
| No. of respondents | 16 | 16 | 16 | 16 | 16 | 16 |
Table text extracted from the original PDF; superscript letters are shown inline. The original table image is below.
View original table image
References
5 in the original paper- Anonymous. Accessed through; c2024. https://dahd.nic.in/invest-india on 24.04.2024.
- Basic Animal Husbandry Statistics (BAHS), 2020. Ministry of Fisheries, Animal Husbandry and Dairying, Government of India, Department of Animal Husbandry, Dairying and Fisheries, Krishi Bhawan, New Delhi; c2020.
- Jha PN, Singh KN. A test to measure farmers' knowledge about High-Yielding Varieties Programme. Interdiscipline. 1970;7(1):65-67.
- Vignesh S, Devendran P, Sivakumar T, Senthilkumar G. Patio-Temporal Analysis of Buffalo Population and Milk Production in Tamil Nadu. Indian Journal of Veterinary and Animal Sciences Research. 2023 MarApr;52(2):29-46.
- Vyas L, Maheshwari S. Knowledge of the tribal women of Udaipur district regarding vermiculture technology. Tribe. 2009;39:68-91.