
Research article · 2024 · Full text
International Journal of Agriculture Extension and Social DevelopmentMarketing behaviour of coconut growers in the Tumkur district of Karnataka
Volume 7(6) · Pages 205–209 · DOI: 10.33545/26180723.2024.v7.i6c.691 ↗
Research areasAgricultural Economics and Practices
Abstract
Author-writtenThe present study on marketing behaviour of randomly selected 120 coconut growers from Tiptur, Turuvekere, Chikkanayakanahalli and Sira taluks of Tumkur district was conducted during the year 2022-23. The research objective was to study the marketing behaviour of coconut growers. The findings revealed that half of the coconut growers (50.00%) in Tiptur taluk fell under the high level of marketing behaviour. Whereas significant number of coconut growers (73.33%) in Turuvekere taluk fell under the medium level of marketing behaviour. Two-fifth (40.00%) of coconut growers of Chikkanayakanahalli and more than two third (70.00%) of coconut growers of Sira taluk fell under the low level of marketing behaviour. Thus, among the overall coconut growers more than two-fifth of coconut growers (40.83%) fell under medium level of marketing behaviour followed by low level of marketing behaviour (30.83%) and then followed by high level of marketing behaviour (28.34%). The Kruskal-wallis one-way ANOVA applied to know the significant difference in the marketing behaviour of coconut growers among the taluks, showed that there is a significant difference in the marketing behaviour among coconut growers of selected taluks significant at one per cent level with H-value of 31.46.
Summary
Source-checkedPlain-language reading of the full paper, prepared with AI and checked against the text. Each point links to the authors' own words.
Why it matters
- Coconut is a vital plantation crop in India that supports socio-economic development by providing employment and contributing to foreign exchange earnings. View evidence ↗
- Tumkur district is a primary hub for coconut production in Karnataka, accounting for approximately 29% of the state's cultivation area and nearly 30% of its production. View evidence ↗
- The coconut sector faces challenges such as market volatility and changing consumer preferences, which affect the livelihoods of farmers. View evidence ↗
The question
- The study aimed to understand the marketing behavior of coconut growers within the Tumkur district of Karnataka. View evidence ↗
What they did
- The researchers used an ex-post-facto research design for the study conducted during 2022-23 in the Tumkur district. View evidence ↗
- Marketing behavior was measured based on several factors, including the timing and location of sales, reasons for these choices, the buyers, information sources, transport methods, and the form of the produce sold. View evidence ↗
What they found
- A vast majority of the growers (90.83%) prefer selling their produce in markets located in nearby towns or cities. View evidence ↗
- 60.00% of the coconut growers preferred using regulated markets or APMCs for their sales. View evidence ↗
- The primary sources of market information for growers were mobile phone calls (95.83%) and contact with other farmers (94.17%). View evidence ↗
- Tractors were the preferred transport method for 67.50% of growers, and 75.00% of growers sold their produce as copra. View evidence ↗
- Overall, the largest group of growers exhibited a medium level of marketing behavior (40.83%), followed by low (30.83%) and high (28.34%) levels. View evidence ↗
- Tiptur taluk showed the highest marketing behavior (mean rank 82.35), while Sira taluk showed the lowest (mean rank 34.25). View evidence ↗
What it means
- The authors conclude that because many growers have only medium marketing behavior, targeted interventions are needed to improve their marketing knowledge and practices. View evidence ↗
- The authors note that while mobile phones and fellow farmers are common information sources, there is a lack of information gathering through social media and institutional sources. View evidence ↗
Visual summary
2 visualsIllustrations explain the paper; charts are replotted from the paper's own table values.
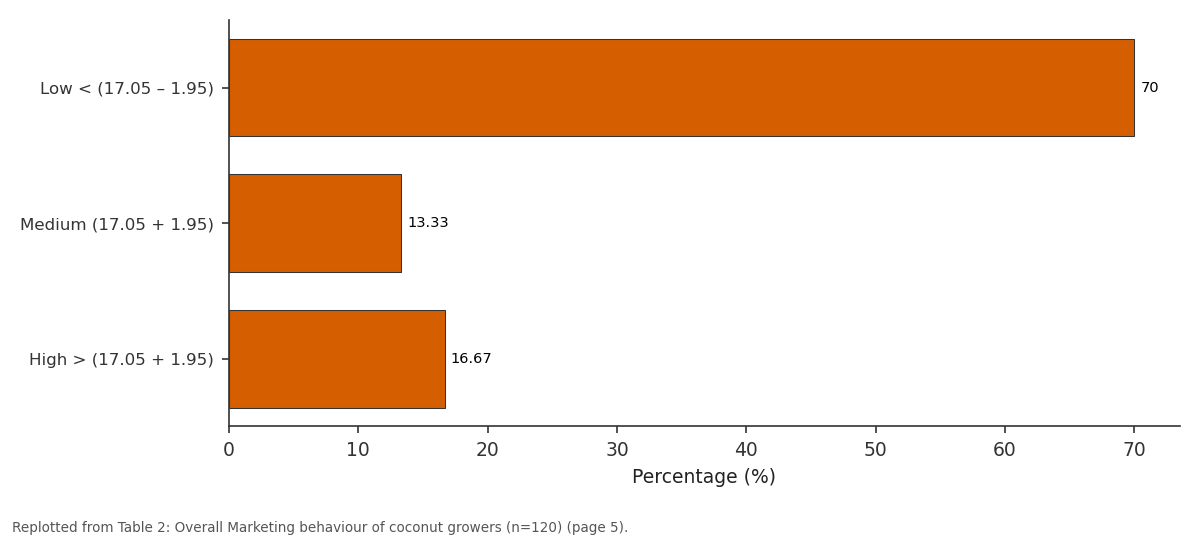
%: Low < (17.05 – 1.95) vs Medium (17.05 + 1.95) vs High > (17.05 + 1.95)
Replotted from Table 2 (page 5) of the original paper. Every bar is the paper's own table value.
View source evidence ↗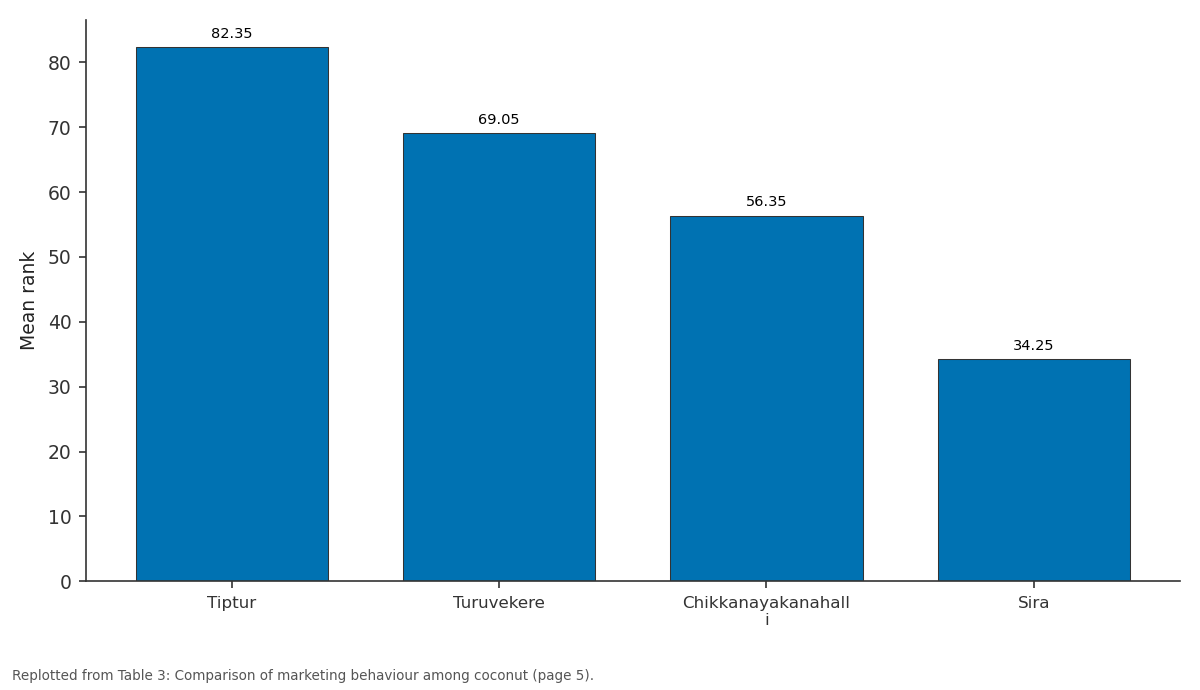
Mean rank: Tiptur vs Turuvekere vs Chikkanayakanahalli vs Sira
Replotted from Table 3 (page 5) of the original paper. Every bar is the paper's own table value.
View source evidence ↗Figures & tables
From the original paper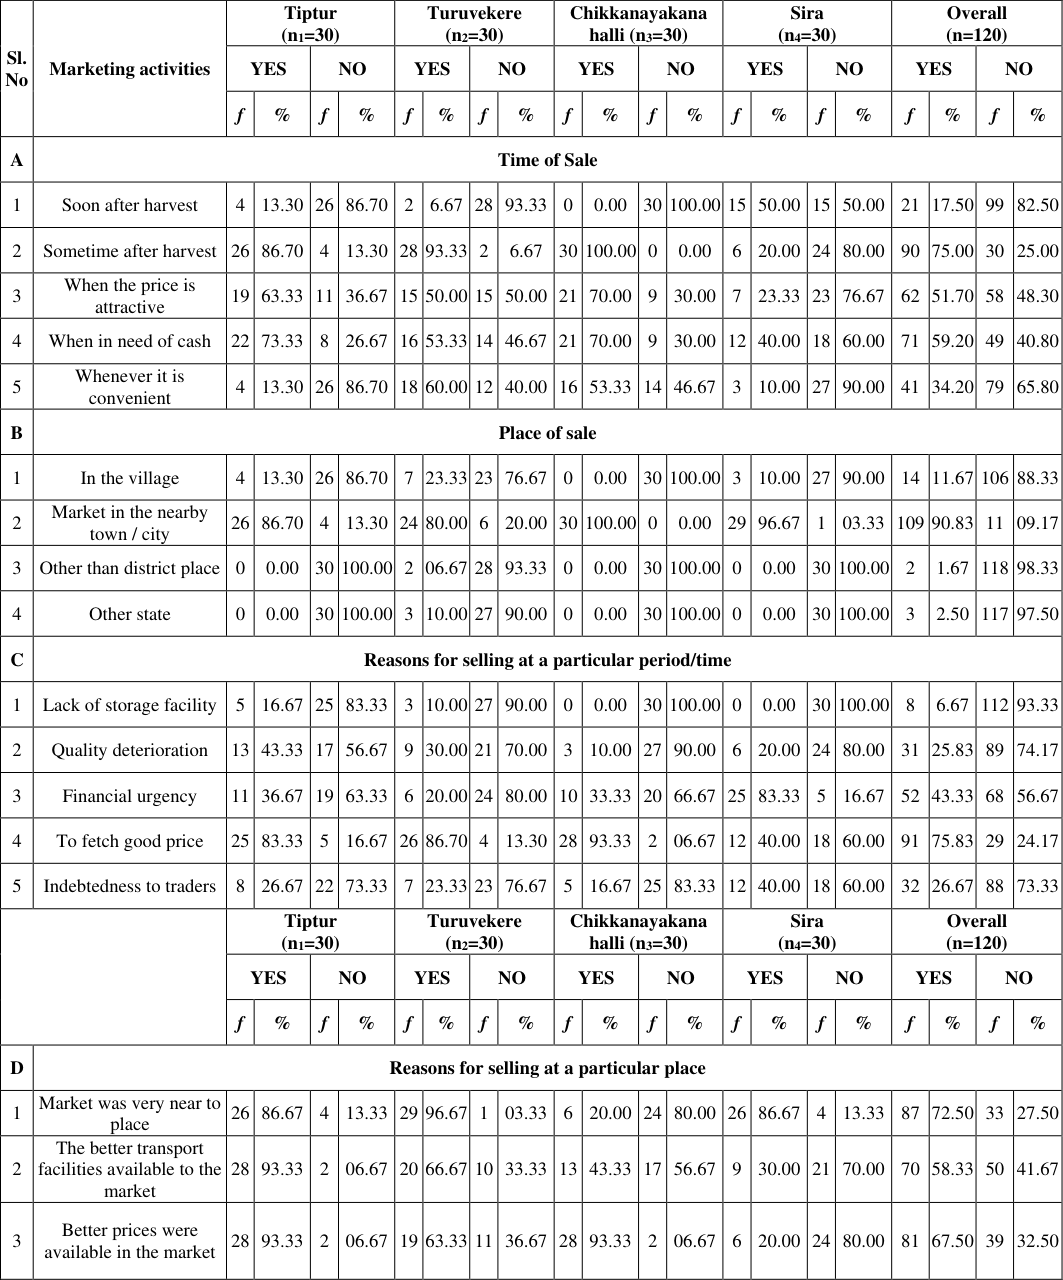 Table 1
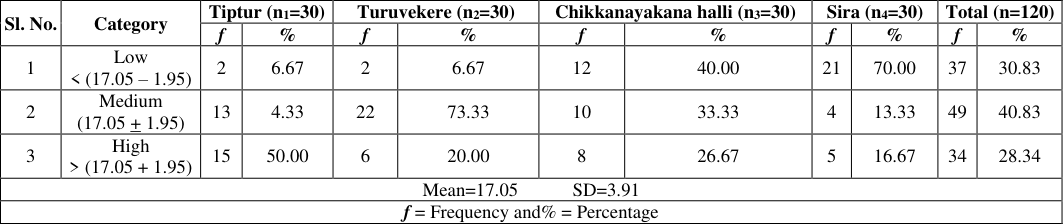 Table 2
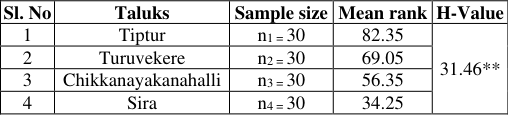 Table 3
Introduction
Plantation crops constitute a vital segment of India's agricultural economy, significantly driving growth and development across various states. Among these crops, coconut holds particular importance, contributing substantially to foreign exchange earnings and providing extensive direct and indirect employment opportunities, thus playing a pivotal role in socio-economic development. The coconut palm, scientifically known as Cocos nucifera, stands as the sole living species within the Cocos genus, its fruit categorized as a drupe rather than a true nut. India, boasting nearly 31% share of global coconut production (Coconut Development Board 2021) [1] , stands as the world's largest producer, with the coconut palm supporting millions of farmers and providing sustenance for a significant portion of the population. Moreover, it fuels a robust coir and coconut-based industry, offering employment to hundreds of thousands. In Karnataka, coconut cultivation thrives, with the state emerging as one of the leading producers, notably driven by Tumkur district, often referred to as 'Kalpatharu Nadu' or the 'Land of Coconuts'. This district alone contributes around 29% of the total coconut cultivation area and nearly 30% of production in the state (Coconut Development Board 2021-22) [2] . Despite its significance, the sector faces challenges, including shifts in consumer preferences and market volatility, impacting the livelihoods of coconut farmers.
In this context, agricultural extension services play a crucial role in supporting coconut farming communities by disseminating knowledge, providing technical assistance, and advocating for best practices. However, despite these efforts, there remains a need to understand and address the evolving marketing behavior of coconut growers in Tumkur district. The dynamics of market preferences and volatility necessitate a deeper exploration to develop tailored extension strategies that can enhance marketing efficiency and ensure better returns for growers, ultimately contributing to their socio-economic well-being. This study aims to delve into the marketing behaviour of coconut growers in Tumkur district, Karnataka, with a focus on understanding the marketing behaviour of coconut growers of Tumkur district. By gaining insights into the marketing practices and challenges faced by growers, this study endeavors to guide the development institutes in formulation of targeted interventions that can optimize market participation, improve value realization, and foster sustainable socio-economic development within the coconut farming community. With this backdrop the present study has been conducted with the following specific objective to study the marketing behaviour of coconut growers.
Materials and Methods
Ex-post-facto research design was used in the present investigation. The study was conducted in the year 2022-23 in Tumkur district of Karnataka. Tumkur district was www.extensionjournal.com selected purposively, because it is one of the leading coconut growing districts in Karnataka state and also coconut cultivation is being taken up in most of the taluks of the district. Tumkur district has ten taluks, out of which Tiptur, Turuvekere, Chikkanayakanahalli and Sira taluks were selected purposively considering the highest and lowest productivity. Thus, from each selected taluk, thirty coconut growers were selected by using simple random sampling. The total sample constituted from four taluks was 120 coconut growers. Marketing behaviour refers to the behaviour of the coconut growers with respect to marketing aspects including time/period of selling coconut produce, place of sale, reasons for selling at a particular period/time, reasons for selling at a particular place, whom do they sell produce, source of acquiring market information, mode of transporting the coconut produce and selling pattern of farm produce. To know the marketing behaviour of coconut growers, the respondents were asked to indicate their responses personally by the researchers with regard to time/period of selling coconut produce, place of sale, reasons for selling at a particular period/time, reasons for selling at a particular place, whom do they sell produce, source of acquiring market information, mode of transporting the coconut produce and selling pattern of farm produce. In the present investigation procedure followed by Gulshan Ekram (2022) [3] with suitable modifications was used for the study and the coconut growers were grouped into following categories by utilizing mean and standard deviation as indicators.
Marketing behaviour category Criteria Low
Less than (Mean -1/2 SD) Medium Between (Mean ± 1/2 SD) High More than (Mean + 1/2 SD)
Results and Discussion Distribution of respondents with regard to Marketing behaviour
From Table 1 showing Distribution of respondents with regard to Marketing behaviour it was found that significant number of coconut growers viz. in Tiptur taluk (86.70%), Turuvekere taluk (93.33%) and Chikkanayakanahalli taluk (100.00%) preferred to sell their coconut produce some time after the harvest whereas half of the Sira taluk coconut growers (50.00%) preferred to sell coconut produce soon after the harvest. This might be because only Sira taluk coconut growers were preferring to sell produce in the coconut nut form whereas rest of other taluk's coconut growers were preferring to sell their produce in copra form which takes time due to drying requirement. It was also found that coconut growers of chosen four taluks viz., from Tiptur taluk (86.70%), Turuvekere taluk (80.00%), Chikkanayakanahalli taluk (100.00%) and Sira taluk (96.67%) preferred to sell their produce in the nearby city due proximity of market to their place. Significant number of coconut growers from three taluks viz., Tiptur taluk (83.33%), Turuvekere taluk (86.70%) and Chikkanayakanahalli taluk (93.33%) chose 'to fetch good price' as the main reason and significant number of coconut growers from Sira taluk (83.33%) chose 'financial urgency' as the main reason to sell their produce at a particular period/time. Significantly equal number of coconut growers from Tiptur taluk (93.33%) chose both 'market was very nearby to place' and 'better prices were available in the market' as the main reason. Whereas significant number of coconut growers of Turuvekere taluk (96.67%) and Sira taluk (86.67%) chose 'market was very nearby to place' as the main reason. While significant number of coconut growers of Chikkanayakanahalli taluk (93.33%) chose 'better prices were available in the market' as the main reason for selling their produce at a particular place. Significant number of coconut growers viz., from Tiptur taluk (70.00%), Turuvekere taluk (66.67%), Chikkanayakanahalli taluk (53.33%) preferred to sell their produce to the regulated markets whereas significant number of coconut growers of Sira taluk (53.33%) preferred to sell to the local traders. In case of market information source gathering, significant number of coconut growers viz., from Tiptur taluk (100.00%) gathered from the realtives and friends, while in Turuvekere taluk (96.67%) gathered from Television source, while in Chikkanayakanahalli taluk (100.00%) of them gathered information from other fellow farmers and Sira taluk (100.00%) gathered from both other fellow farmers as well as mobile phone call. In case of mode of transporting their coconut farm produce to market, significant number of coconut growers viz., from Tiptur taluk (86.67%), from Turuvekere taluk (56.66%) and from Chikkanayakanahalli taluk (93.33%) used tractor as the means of transport whereas from Sira taluk (80.00%) used auto as the means of transport. In case of selling pattern of coconut produce, significant number of coconut growers viz., from Tiptur taluk (86.67%), from Turuvekere taluk (93.33%) and from Chikkanayakanahalli taluk (100.00%) sold coconut in the form of copra while from Sira taluk (83.33%) sold produce in the form of coconuts. Thus, among the overall coconut growers, significant number of coconut growers (75.00%) prefer to sell their produce sometime after the harvest. Significantly high number (90.83%) of coconut growers prefer to sell their produce to the market in the nearby town/city. Significant number of coconut growers (75.83%) responded that the reason for selling at that particular period/time was to fetch good price for their produce. Nearly two-third of the coconut growers (72.50%) responded that the reason for selling at a particular place was because the market was nearby to them. Significant number of coconut growers (60.00%) preferred to sell their produce to the regulated market/APMC. Significant number of coconut growers gathered market information from the mobile phone call (95.83%) as well by contacting other fellow farmers (94.17%). Significant number of coconut growers (67.50%) preferred to use tractor as a mode for carrying their produce to the market and nearly three-fourth of coconut growers (75.00%) involved in selling coconut in the form of copra. The reasons might be the lack of marketing information which indicates many coconut growers might lack proper understanding of marketing strategies and techniques so they are not focusing on going to diverse farm produce selling pattern. They may be more focused on the production aspect of coconut cultivation rather than the www.extensionjournal.com business and marketing dimension which makes them to settle for near and easily reachable markets without exploring new markets like other states and other new markets. Even price fluctuations in the coconut prices can be highly volatile due to factors like weather conditions, disease outbreaks, and global market trends. This uncertainty can discourage growers from investing in marketing efforts to explore more marketing option.
| Sl. No | Marketing activities | Tiptur (n1=30) | — | — | — | Turuvekere (n2=30) | — | — | — | Chikkanayakana halli (n3=30) | — | — | — | Sira (n4=30) | — | — | — | Overall (n=120) | — | — | — |
|---|---|---|---|---|---|---|---|---|---|---|---|---|---|---|---|---|---|---|---|---|---|
| YES | NO | YES | NO | YES | NO | YES | NO | YES | NO | ||||||||||||
| f | % | f | % | f | % | f | % | f | % | f | % | f | % | f | % | f | % | f | % | ||
| A | Time of Sale | ||||||||||||||||||||
| 1 | Soon after harvest | 4 | 13.30 | 26 | 86.70 | 2 | 6.67 | 28 | 93.33 | 0 | 0.00 | 30 | 100.00 | 15 | 50.00 | 15 | 50.00 | 21 | 17.50 | 99 | 82.50 |
| 2 | Sometime after harvest | 26 | 86.70 | 4 | 13.30 | 28 | 93.33 | 2 | 6.67 | 30 | 100.00 | 0 | 0.00 | 6 | 20.00 | 24 | 80.00 | 90 | 75.00 | 30 | 25.00 |
| 3 | When the price is attractive | 19 | 63.33 | 11 | 36.67 | 15 | 50.00 | 15 | 50.00 | 21 | 70.00 | 9 | 30.00 | 7 | 23.33 | 23 | 76.67 | 62 | 51.70 | 58 | 48.30 |
| 4 | When in need of cash | 22 | 73.33 | 8 | 26.67 | 16 | 53.33 | 14 | 46.67 | 21 | 70.00 | 9 | 30.00 | 12 | 40.00 | 18 | 60.00 | 71 | 59.20 | 49 | 40.80 |
| 5 | Whenever it is convenient | 4 | 13.30 | 26 | 86.70 | 18 | 60.00 | 12 | 40.00 | 16 | 53.33 | 14 | 46.67 | 3 | 10.00 | 27 | 90.00 | 41 | 34.20 | 79 | 65.80 |
| B | Place of sale | ||||||||||||||||||||
| 1 | In the village | 4 | 13.30 | 26 | 86.70 | 7 | 23.33 | 23 | 76.67 | 0 | 0.00 | 30 | 100.00 | 3 | 10.00 | 27 | 90.00 | 14 | 11.67 | 106 | 88.33 |
| 2 | Market in the nearby town / city | 26 | 86.70 | 4 | 13.30 | 24 | 80.00 | 6 | 20.00 | 30 | 100.00 | 0 | 0.00 | 29 | 96.67 | 1 | 03.33 | 109 | 90.83 | 11 | 09.17 |
| 3 | Other than district place | 0 | 0.00 | 30 | 100.00 | 2 | 06.67 | 28 | 93.33 | 0 | 0.00 | 30 | 100.00 | 0 | 0.00 | 30 | 100.00 | 2 | 1.67 | 118 | 98.33 |
| 4 | Other state | 0 | 0.00 | 30 | 100.00 | 3 | 10.00 | 27 | 90.00 | 0 | 0.00 | 30 | 100.00 | 0 | 0.00 | 30 | 100.00 | 3 | 2.50 | 117 | 97.50 |
| C | Reasons for selling at a particular period/time | ||||||||||||||||||||
| 1 | Lack of storage facility | 5 | 16.67 | 25 | 83.33 | 3 | 10.00 | 27 | 90.00 | 0 | 0.00 | 30 | 100.00 | 0 | 0.00 | 30 | 100.00 | 8 | 6.67 | 112 | 93.33 |
| 2 | Quality deterioration | 13 | 43.33 | 17 | 56.67 | 9 | 30.00 | 21 | 70.00 | 3 | 10.00 | 27 | 90.00 | 6 | 20.00 | 24 | 80.00 | 31 | 25.83 | 89 | 74.17 |
| 3 | Financial urgency | 11 | 36.67 | 19 | 63.33 | 6 | 20.00 | 24 | 80.00 | 10 | 33.33 | 20 | 66.67 | 25 | 83.33 | 5 | 16.67 | 52 | 43.33 | 68 | 56.67 |
| 4 | To fetch good price | 25 | 83.33 | 5 | 16.67 | 26 | 86.70 | 4 | 13.30 | 28 | 93.33 | 2 | 06.67 | 12 | 40.00 | 18 | 60.00 | 91 | 75.83 | 29 | 24.17 |
| 5 | Indebtedness to traders | 8 | 26.67 | 22 | 73.33 | 7 | 23.33 | 23 | 76.67 | 5 | 16.67 | 25 | 83.33 | 12 | 40.00 | 18 | 60.00 | 32 | 26.67 | 88 | 73.33 |
| Tiptur (n1=30) | Turuvekere (n2=30) | Chikkanayakana halli (n3=30) | Sira (n4=30) | Overall (n=120) | |||||||||||||||||
| YES | NO | YES | NO | YES | NO | YES | NO | YES | NO | ||||||||||||
| f | % | f | % | f | % | f | % | f | % | f | % | f | % | f | % | f | % | f | % | ||
| D | Reasons for selling at a particular place | ||||||||||||||||||||
| 1 | Market was very near to place | 26 | 86.67 | 4 | 13.33 | 29 | 96.67 | 1 | 03.33 | 6 | 20.00 | 24 | 80.00 | 26 | 86.67 | 4 | 13.33 | 87 | 72.50 | 33 | 27.50 |
| 2 | The better transport facilities available to the market | 28 | 93.33 | 2 | 06.67 | 20 | 66.67 | 10 | 33.33 | 13 | 43.33 | 17 | 56.67 | 9 | 30.00 | 21 | 70.00 | 70 | 58.33 | 50 | 41.67 |
| 3 | Better prices were available in the market | 28 | 93.33 | 2 | 06.67 | 19 | 63.33 | 11 | 36.67 | 28 | 93.33 | 2 | 06.67 | 6 | 20.00 | 24 | 80.00 | 81 | 67.50 | 39 | 32.50 |
Table text extracted from the original PDF; superscript letters are shown inline. The original table image is below.
View original table image
Reasons for selling at a particular place Processing industries 0 0.00 30 100.00 0 0.00 30 100.00 0 0.00 30 100.00 0 0.00 30 100.00 0 0.00 120 100.0 0 7 Directly to the consumers 0 0.00 30 100.00 1 03.33 29 96.67 0 0.00 30 100.00 0 0.00 30 100.00 1 0.83 119 99.17
Overall Marketing behaviour of coconut growers
From Table 2, the study showed that half of the coconut growers (50.00%) in Tiptur taluk fell under the high level of marketing behaviour. Whereas significant number of coconut growers (73.33%) in Turuvekere taluk fell under the medium level of marketing behaviour. Two-fifth (40.00%) of coconut growers of Chikkanayakanahalli and more than two-third (70.00%) of coconut growers of Sira taluk fell under the low level of marketing behaviour. Thus, among the overall coconut growers more than two-fifth of coconut growers (40.83%) fell under medium level of marketing behaviour followed by low level of marketing behaviour (30.83%) and then followed by high level of marketing behaviour (28.34%). This might be due to the low desire or lack of interest to learn and use internet or poor communication channels which can limit coconut growers ability to learn about and implement effective marketing strategies and also less effort to explore more marketing option. The findings of Chengappa (2017) [4] and Raghuraja (2001) [5] are consistent with this trend.
| Sl. No. | Category | Tiptur (n1=30) | — | Turuvekere (n2=30) | — | Chikkanayakana halli (n3=30) | — | Sira (n4=30) | — | Total (n=120) | — |
|---|---|---|---|---|---|---|---|---|---|---|---|
| f | % | f | % | f | % | f | % | f | % | ||
| 1 | Low < (17.05 – 1.95) | 2 | 6.67 | 2 | 6.67 | 12 | 40.00 | 21 | 70.00 | 37 | 30.83 |
| 2 | Medium (17.05 + 1.95) | 13 | 4.33 | 22 | 73.33 | 10 | 33.33 | 4 | 13.33 | 49 | 40.83 |
| 3 | High > (17.05 + 1.95) | 15 | 50.00 | 6 | 20.00 | 8 | 26.67 | 5 | 16.67 | 34 | 28.34 |
| Mean=17.05 SD=3.91 | |||||||||||
| f = Frequency and% = Percentage |
Table text extracted from the original PDF; superscript letters are shown inline. The original table image is below.
View original table image
Comparison of marketing behaviour among coconut growers with Kruskal-Wallis One-way ANOVA
From the Table 3 showing the Kruskal-wallis one-way ANOVA applied to know the significant difference in the marketing behaviour among coconut growers of selected taluks, showed that there is a significant difference in the marketing behaviour among coconut growers of selected taluks with H-value of 31.46 significant at one per cent level. Where, Tiptur taluk performed better with 82.35 mean rank followed by the Turuvekere taluk with mean rank of 69.05 then Chikkanayakanahalli taluk with mean rank of 56.35 followed by the Sira taluk with mean rank of 34.25. Where it implies that as the mean rank value is more/increased the marketing behaviour is also more/increased and vice versa.
| Sl. No | Taluks | Sample size | Mean rank | H-Value |
|---|---|---|---|---|
| 1 | Tiptur | n1 = 30 | 82.35 | 31.46** |
| 2 | Turuvekere | n2 = 30 | 69.05 | |
| 3 | Chikkanayakanahalli | n3 = 30 | 56.35 | |
| 4 | Sira | n4 = 30 | 34.25 |
Table text extracted from the original PDF; superscript letters are shown inline. The original table image is below.
View original table image
Conclusion
In conclusion, the findings of this study shed light on the variations exist in the levels of marketing behaviour among coconut growers. Overall, the analysis revealed that a significant number of coconut growers fell into the medium categories of marketing behaviour, emphasizing the need for targeted interventions to enhance marketing knowledge and practices among coconut growers. This investigation also disclosed that in gathering and getting market information by coconut growers, majority of them got from mobile phone calls and contact with other fellow farmers. But some of them are lagging behind in getting information through institutional sources and social media. Therefore, there is a need to strengthen the marketing information system. Understanding marketing behaviour are important for government officials, farmers support services and everyone involved in the coconut business. Further it will guide us that we need specific plans to help coconut farmers in different areas because their challenges and needs vary. If we understand better how farmers sell their coconuts and provide them with the right help and information, they can do better in the market. This means they can earn more money and improve their lives. It also helps to make sure that coconut farming stays strong, sustainable and evergreen in Tumkur district.
References
1 in the original paper- World -Area, Production and Productivity of Coconut in Major Coconut Growing Countries; c2021. [Weblink: https://coconutboard.gov.in/Statistics.aspx]. [Visited on 29 April, 2024].