
Research article · 2024 · Full text
International Journal of Agriculture Extension and Social DevelopmentScientific temperament of doctoral research scholars towards academic research in the discipline of agricultural sciences in India
Volume 7(6) · Pages 178–187 · DOI: 10.33545/26180723.2024.v7.i6c.688 ↗
Research areasMotivation and Self-Concept in SportsLeadership, Courage, and Heroism StudiesEducation and Critical Thinking Development
Abstract
Author-writtenFostering scientific temperament among researchers is crucial for informed decision-making and advancing knowledge. While education provides tools, instilling the proper mindset is essential for effective application. Recognizing and addressing the scientific temperament of scholars is vital for enhancing the rigor and impact of academic research. This study aims to measure the scientific temperament of doctoral research scholars in agricultural sciences comprehensively, facilitating accurate assessment by other researchers. A Scientific Temperament Index (STI) was developed using Relevancy percentage and Principal Component Analysis (PCA) methods, comprising four dimensions and eleven indicators. Despite investigations into research scholars' attitudes, there is a notable gap in focusing on their scientific temperament, which this paper addresses by providing a detailed methodology. Findings reveal that most respondents (47%) possess a moderate level of scientific temperament towards conducting academic research, while 36% exhibit a high level. Notably, no significant difference was found between the scientific temperament of scholars from rural and urban backgrounds, but gender disparities were evident, with male respondents displaying a different temperament compared to females. Additionally, there was no significant variance in the scientific temperament of Ph.D scholars between universities of varying rankings. The study suggests a need for training in scientific techniques and research methodologies, alongside increased support for research scholars. Future research should focus on analyzing the effect of gender on scientific temperament and productivity. Overall, this study provides valuable insights for enhancing the rigor and impact of academic research in agricultural sciences and beyond.
Summary
Source-checkedPlain-language reading of the full paper, prepared with AI and checked against the text. Each point links to the authors' own words.
Why it matters
- Developing a scientific temperament in researchers is essential for advancing knowledge and making informed decisions. View evidence ↗
- Scientific temperament is defined as a way of life or attitude that applies scientific approaches to solve daily problems. View evidence ↗
- While previous research has looked at the attitudes of scholars, there has been a lack of focus specifically on their scientific temperament. View evidence ↗
The question
- The study aims to comprehensively measure the scientific temperament of doctoral research scholars within the field of agricultural sciences. View evidence ↗
What they did
- The researchers developed a Scientific Temperament Index (STI) using eleven indicators across four dimensions, utilizing Principal Component Analysis (PCA) and Relevancy percentage. View evidence ↗
- Respondents were categorized into low, medium, and high levels of scientific temperament using the cumulative square root frequency method. View evidence ↗
What they found
- The majority of respondents (47%) had a moderate level of scientific temperament, while 36% exhibited a high level. View evidence ↗
- There was no significant difference in scientific temperament between scholars from rural (mean 0.699) and urban (mean 0.724) backgrounds. View evidence ↗
- Gender disparities were significant, with male respondents having a higher mean scientific temperament (0.701) compared to female respondents (0.612). View evidence ↗
- No statistically significant difference was found in scientific temperament between scholars from top-ranking universities (mean 0.71) and lowest-ranking universities (mean 0.70). View evidence ↗
- Scientific attitude, habit, and method were found to be more important indicators of scientific temperament than scientific knowledge. View evidence ↗
What it means
- The authors recommend increasing support for research scholars and providing training in research methodologies and scientific techniques. View evidence ↗
- The authors state that future research should specifically analyze how gender affects both productivity and scientific temperament. View evidence ↗
Visual summary
3 visualsIllustrations explain the paper; charts are replotted from the paper's own table values.
STI Framework
AI-generated conceptual illustration (Agricultural research scholars in India). It explains the idea and does not show study data.
View source evidence ↗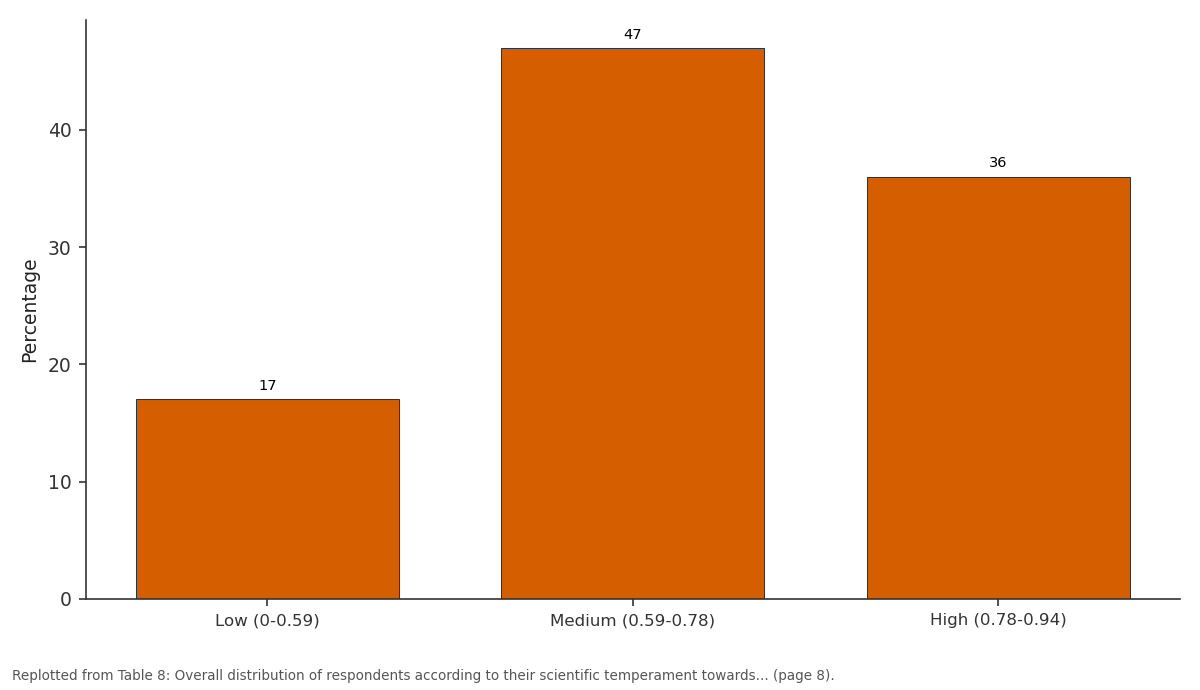
Percentage: Low (0-0.59) vs Medium (0.59-0.78) vs High (0.78-0.94)
Replotted from Table 8 (page 8) of the original paper. Every bar is the paper's own table value.
View source evidence ↗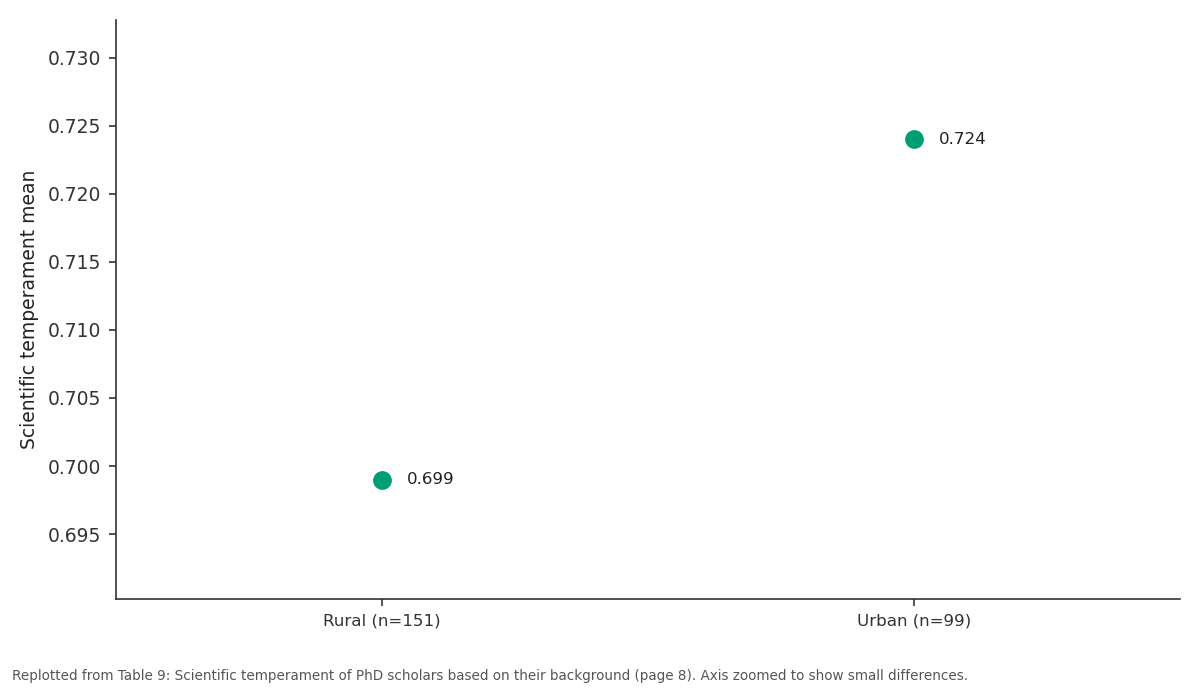
Scientific temperament mean: Rural (n=151) vs Urban (n=99)
Replotted from Table 9 (page 8) of the original paper. Every bar is the paper's own table value.
View source evidence ↗Figures & tables
From the original paper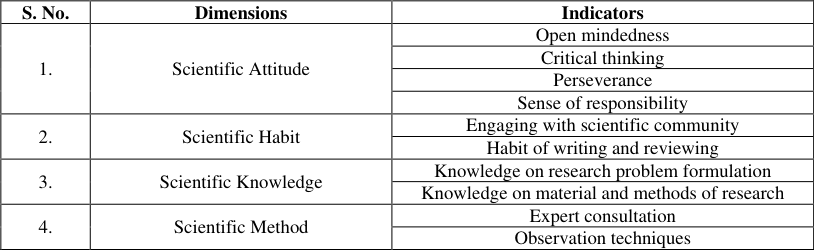 Table 1
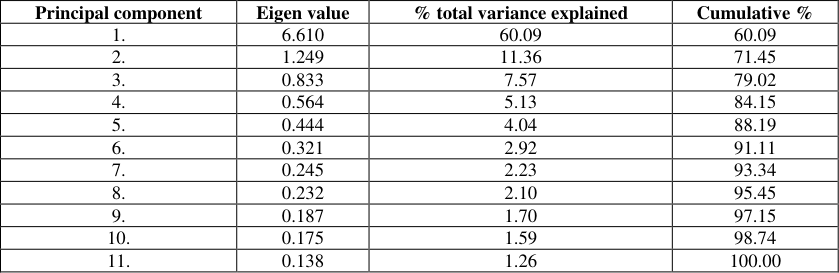 Table 2
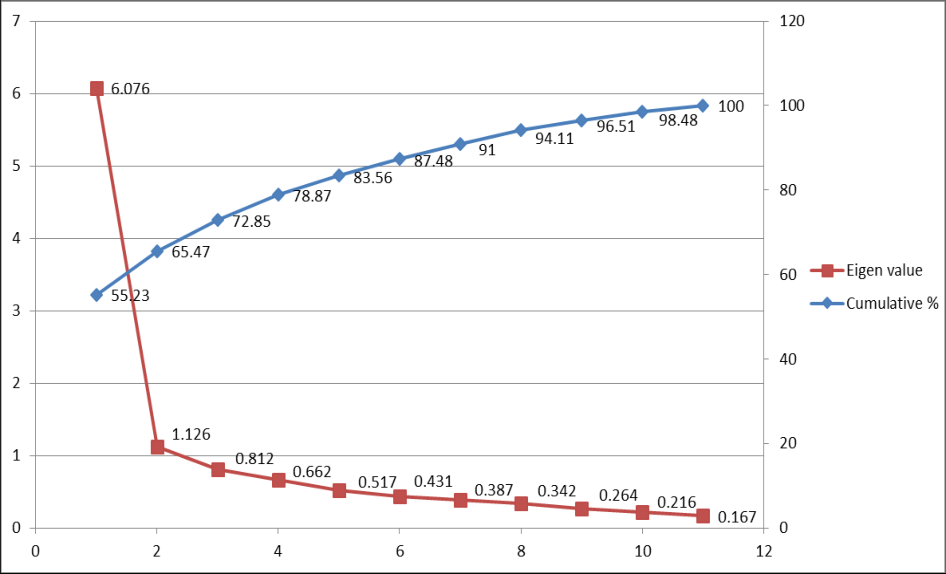 Figure 1
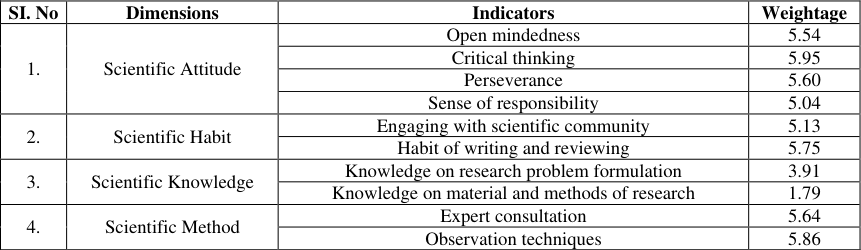 Table 3
 Table 5
 Table 4
 Table 6
 Table 7
 Table 8
 Table 9
 Table 10
 Table 11
Introduction
Since childhood, humans have been actively interacting with their physical and social environments, which provide opportunities to experience a variety of circumstances. An individual's disposition toward any phenomenon develops throughout time as a result of ongoing exposure to their physical and social environment. There is general agreement that temperament results from intricate interactions between genetic, biochemical, and environmental factors across time as a person adapts to constantly changing circumstances and experiences. An individual's emotional tendencies and responses to any phenomenon are referred to as their temperament. Temperaments differ from person to person and continue to evolve across time and space, enabling an individual to react in a certain way that further forms that individual's personality. An individual's personality can be defined as a distinctive style of thinking, feeling, and acting, or as an ordered pattern of actions and characters. Environment, temperament, and character interact continuously to shape personality. Every person's personality is significantly shaped by temperament. The definition of a scientific temperament is an attitude or way of life that entails using scientific approaches to solve difficulties that arise in day-to-day existence. It refers to an individual's emotional and mental dispositions towards science and scientific research. It determines their attitudes, habits, and methods when conducting academic research. Scientific temperament is a crucial aspect of the scientific process as it allows for rational thinking, skepticism, and a willingness to test and validate ideas through experimentation and mathematical modeling. There are several dimensions that make up scientific temperament, including scientific attitude, scientific habit, scientific knowledge, and scientific method (Saxena, 2014) [17] . Scientific attitude refers to an individual's curiosity and openness to new ideas and a willingness to question assumptions. Scientific habit refers to the consistent and persistent approach to conducting research, including discipline and attention to detail. Scientific knowledge www.extensionjournal.com refers to the individual's understanding of the scientific method and their ability to apply it in their research. Lastly, scientific method refers to the individual's adherence to rigorous methodology and their ability to analyze and interpret data. Dhar (2009) [7] cites a number of characteristics of the scientific temperament, including a healthy dose of skepticism, the absence of prejudice or bias, objectivity, open-mindedness, and humility, the ability to suspend judgment in the absence of sufficient evidence, perseverance, and-most importantly-a positive attitude toward failure. Numerous scientists, philosophers, and educators have defined the term "scientific temperament," but it was used first time by the country's then-prime minister Shri. Jawaharlal Nehru, who envisioned Indians with a scientific temperament. That is to say, he desired for people to be able to reason independently, comprehend and apply scientific methods of inquiry in their daily lives, as well as analyze information and make thoughtful decisions rather than accepting claims at face value and refrain from using overly simplistic reasoning. One of the key uses of scientific temperament is in the advancement of scientific knowledge. Scientists with a strong scientific temperament are able to think critically and objectively, which allows them to identify and solve problems in their research. This, in turn, leads to the discovery of new knowledge and the advancement of scientific understanding.
Additionally, scientific temperament is also crucial for the application of scientific knowledge in practical settings. Scientists with a strong scientific temperament are able to apply their knowledge and skills to solve real-world problems and make informed decisions. Any human being must possess scientific temperament because his or her quality of life depends on the judgments they make. For that matter, individuals conducting science or scientific research, having a scientific temperament is essential since only when an individual evaluates issues objectively and with an open mind will their decisions allow for significant advancement in their research. The focus of the higher education system was mostly on learning different approaches or procedures for determining or comprehending a phenomenon, with little emphasis placed on its practical application. In other words, the educational system provided us with a weapon but did not instruct us in its proper use. In order to establish a scientific temperament in today's children, it is imperative to foster a scientific mindset in them. The attitudes of the research scholars toward academic research were the topic of numerous investigations, but the scientific temperament of research scholars was not able to be established. Understanding the status quo of scholars and keeping in mind the value of scientific temperament in academic research are absolutely essential for making immediate changes to the way they conduct their study.
Literature Review of the study
Scientific temperament is defined as an attitude or way of life which involves critical thinking, logical reasoning, and willingness to question and meet the facts without having pre conceived notion. Scientific temperament has been defined by various scientists, philosophers and educationists. As pointed by Dhar (2009) [7] , there are many traits related to scientific temperament such as healthy skepticism, freedom from prejudice or bias, objectivity, open mindedness and humility, willingness to suspend judgment without sufficient evidence and perseverancepositive approach to failure. Scientific temperament is a prerequisite for any human being as his quality of life lies on the type of decisions he makes. For that matter, scientific temperament for persons conducting science is very crucial as their decisions make sufficient progress in research only when they view objectively with open-mindedness. The temperaments established with regard to conducting science and scientific research determines an individual scholar's attitudes towards research. The scientific habits and methods adopted for dealing with the day to day problems encountered while conducting academic research and acquired knowledge shapes his/her academic research. Some of the studies explaining how various characteristics such as attitude towards research, knowledge associated with research methodologies, logical reasoning, perseverance, innovativeness, open-mindedness, etc. related to scientific temper had significant influence on researchers were as shown below. Shivarasad et al. (2022) [18] conducted a study on research scholars of management studies to investigate the scientific temperament and academic achievements by taking a sample of 100 respondents representing 69 from male and 31 from female category. The results when different dimensions of scientific temper and academic achievement were compared using a regression analysis, showed that there is a significant relationship between rationality and curiosity dimensions of scientific temper and academic achievement of doctoral scholars. The study further compared the various dimensions of scientific temper such as open-mindedness, rationality, objectivity, superstition and curiosity among rural and urban scholars and found no significant relation except with open-mindedness trait. When demographic variables such as locality, gender and stream of undergraduate students were compared with the scientific temper of undergraduate students in a study carried out by Acharya (2021) [1] the results revealed that students from urban locality and science stream were having comparatively high scientific temper. Comprehending the attitude of the students towards research would certainly help in understanding the scientific temperament of research scholars. A study conducted by Muthuswamy et al. (2017) [13] on attitude toward research of doctoral scholars; using self-administered interview schedule on 159 PhD scholars who had completed their course work, identified six dimensions of attitude such as love for research, research fear, research usefulness, difficulties in research, importance of research and benefits of research using factor analysis. The study also found that interest in subject domain, wanting to work in a first-grade research group and availability of an interesting research project were the three driving forces led the scholars to join into a doctoral programme. Further, the study also highlighted the need for training in the areas of article writing & publication, identifying journals for publication and communication skills. Boppana (2019) [4] in a study carried out to investigate the attitude of 50 postgraduate students towards research found that majority i.e. 58 per www.extensionjournal.com cent were having favorable attitude followed by 42 per cent having most favorable attitude towards research. It further reported that achievement motivation and innovativeness of students had a positive and significant correlation with the attitude towards research. While exploring the effect of students' attitude towards research on demographic variables in a study conducted by Maqsood et al. (2019) [12] on students of university of Punjab, he found male students were having positive attitude towards research when compared with their female counterparts. However, comparing overall scores, the study found that both male and female students were having positive attitude towards research. The study also identified five factors of attitude towards research such as positive attitude towards research, research usefulness for profession, research anxiety, research difficulty and relevance to life employing factor analysis as very important for measuring research scholar's attitude towards research. Oguan (2014) [16] in a descriptive and associational research to investigate the influence of attitude and anxiety towards research on overall achievement of 338 undergraduate students of college of Arts and Science Rizal Technological University, Mandaluyong, Philippines, found that male students were more positive towards research than their female counterparts. However, overall students displayed a positive attitude towards research and negative attitude on difficulty of research. When academic grades and attitude towards research were compared, students were found positively aligned. Although they were positively inclined, they identified themselves as more anxious towards the same and admitted it as stressful. Scientific knowledge or the knowledge on how to conduct scientific research is an important attribute or a quality which helps in determining a person's scientific temperament. In order to test the research questions or hypothesis one must necessarily know how to measure it objectively therefore research methodology courses help from formulating thesis to analyzing the data and publication. A qualitative study conducted by Daniel et al. (2017) [21] on students enrolled in masters and PhD programmes of research-intensive universities in New Zealand and Malaysia made an attempt to explore the postgraduate student's conceptions of research methodology courses contributing to their learning. Findings revealed that participants recognized research methodology courses are a significant body of knowledge in postgraduate education yet notable differences in perspectives of understanding what constitutes research methodology is observed as some participants found it as important only to acquire necessary skills without deeper understanding of the research and some found choosing research methodology courses following major advisor suggestion, study domain and the nature of research problem. The study further reported major challenges perceived by the respondents as framing research question, understanding the role of literature associated with the chosen study and difficulties in performing data analysis. Jansen et al. (2022) [11] in a study on architecture student's attitude towards research methodology courses found that the students were reasonably favorable and were not anxious about the research related course but reported to have found them stressful and not enjoyable. When the attitude towards research between male and female respondents was compared, it is observed that female students found those courses enjoyable and no relation was established with respect to the age of the respondents. Further the study also identified three types of students' vis a vis relaxed, virtuous and worried who needed a different approach for improving their attitude towards research. When Heretick et al. (2021) [10] explored 92 younger nontraditional adult learners having age between 26 to 49 years and older nontraditional adult learners above 50 years via online survey in a study on anxiety and attitudes of younger and older nontraditional adult learners towards statistics and research found, that the earlier had significantly expressed higher anxiety and more negative beliefs than their older counterparts. Ndenje-Sichalwe and Elia (2021) [15] in a study conducted on postgraduate students of information studies in Tanzania on research methodology practices being followed. The study emphasized the need to strengthen research methodology concepts by giving necessary trainings to students as well as lecturers as majority of the students were very poor in understanding and application of research methodology concepts. The success of any doctoral scholar does not only depend upon his personal abilities but also on the effectiveness of PhD programme designed in the institutes. Verderame et al. (2018) [20] in a study on competency based assessment for the training of PhD students and early career scientists expressed their point of view about the current training programs designed for PhD students and early career scientists. The study expressed their concern over current training programmes as they were not sufficiently preparing them to equip complex knowledge, skills and attitudes required to be a successful scientist. Therefore the study suggested a framework 'competency based assessment for the training of PhD students and early career scientists'. As a part of this framework, the study identified ten core competencies essential for every PhD students end early career scientists regardless of their discipline. The ten core competencies such as broad conceptual knowledge of a scientific discipline, deep knowledge of a specific field, critical thinking skills, experimental skills, computational skills, collaboration and team science skills, responsible conduct of research and ethics, communication skills, leadership skills and survival skills. The study further developed sub competencies under each broad core competencies. Based on the stage of PhD students and early career scientists the supervisor evaluated whether the students or early career scientists are fulfilling the necessary core competencies designed in their curriculum. Skakni et al. (2022) [19] in a study on assessing the extent of career competencies such as knowledge, skills and abilities required for performing a job of junior researchers within and outside academia. The data was extracted by sending career competencies questionnaire developed by (Akkermans et al., 2013) [2] to 727 PhD students and junior PhD holders across 16 countries. The results revealed that career competencies within and beyond academia were clearly contrasted and male respondents reported to have stronger career competencies in preparation for both within and outside academia when compared with their female counterparts. Further it was found that there is a significant difference between PhD students and PhD holders in terms of career competencies within and outside the academia. The study conducted by Bagaka et al. (2015) [3] for exploring students success in a doctoral programme using a mixed method approach by taking a total of 113 students both from alumni and current doctoral students identified, six dimensions representing various aspects of doctoral programme. Multiple linear regression models were used to determine extent of student's satisfaction with the identified dimensions of doctoral programme. The results revealed that general quality of the academic programme, quality of programme support, advisor support and research engagement dimensions found significant predictors of overall satisfaction of the doctoral programme. According to a study by Nag et al. (2020) [4] , research is not just a process of finding facts, but rather a comprehensive, creative, and continuous process that establishes connections between various phenomena. It also helps to generate new strategies for knowledge creation and advancement, leading to problem-solving through rigorous inquiry. The study used both primary and secondary sources of data and based on the thorough analysis, the study suggests researchers to pursue original research. This can lead to the generation of new knowledge, problem-solving and advancement in various fields.
Research Methodology
Scientific temperament is the emotional/mental disposition of an individual towards science or scientific research where a man or woman makes decisions (both, big and small) and acts according to a rational belief system, which can be tested and validated as and when required by mathematical modeling and/or experimentation (Saxena, 2014) [17] . The temperaments established with regard to conducting science and scientific research determines an individual scholar's attitudes towards research. The scholar habits and methods adopting while dealing with the day to day problems encountered while conducting academic research and acquired knowledge shapes his/her academic research. Based on thorough investigation of available literature, scientific temperament for the purpose of this study was operationalized as a composite of four dimensions viz. scientific attitude, scientific habits, scientific knowledge and scientific methods followed by the respondent research scholar towards conducting academic research as given in the table 1.
| S. No. | Dimensions | Indicators |
|---|---|---|
| 1. | Scientific Attitude | Open mindedness |
| Critical thinking | ||
| Perseverance | ||
| Sense of responsibility | ||
| 2. | Scientific Habit | Engaging with scientific community |
| Habit of writing and reviewing | ||
| 3. | Scientific Knowledge | Knowledge on research problem formulation |
| Knowledge on material and methods of research | ||
| 4. | Scientific Method | Expert consultation |
| Observation techniques |
Table text extracted from the original PDF; superscript letters are shown inline. The original table image is below.
View original table image
Selection of major indicators
Initially 14 indicators related to scientific attitude, scientific habits, scientific knowledge and scientific method dimensions of scientific temperament were selected based on literature review. The indicators chosen under each dimension were thought to make a significant contribution in measuring the scientific temperament of research scholars. Therefore the selected indicators must be thoroughly examined before being included in the final index. Thus, these indicators were given to scientists and experts through Google forms as well as direct methods and they were requested to rate the relevancy of each indicator on a three-point scale, i.e. 'Most relevant,' 'Relevant,' and 'Least relevant,' with scores of 3, 2, and 1 respectively. The relevancy weightage (RW) was calculated for each indicator by using the following formula: [8] , was done considering 11 selected indicators and using IBM SPSS 26 version software. Principal components were described as the part of multivariate procedures wherein linear combinations of correlated indicators are involved to maximize the variance accounted for in the original set of indicators (Chakravarty, 2017) [5] . The normalized data were loaded to SPSS. PCA was run to obtain factor loadings and Eigen values. Components were identified; those were having Eigen values greater than 1.
According to the number of Eigen values greater than 1, the same numbers of components were extracted by using varimax rotational method for each indicator. Then method followed by Feroze et al. (2010) [9] adopted for this study to assign weights to the indicators.
Calculation of Scientific Temperament Index (STI)
It was constructed based on principles laid down by the Feroze et al. (2010) [9] where scientific temperament is the function of four dimensions expressed as Scientific temperament = f (SA, SH, SK, SM) Where SA = Scientific attitude SH = Scientific habit SK = Scientific knowledge SM = Scientific method Index values of SA, SH, SK, SH of each individual respondent in the sample by using the formula.
Where, SA 1 was the index value of the scientific attitude for the respondent 1; W 1 was the weight generated by the PCA for the first indicator 1; A 1 Normalized value of indicator 1; Accordingly, index values of the SH, SK and SM were calculated. PCA was applied again using the values of SA, SH, SK, SM to calculate the index value for scientific temperament. Finally, Scientific Temperament Index (STI) of each respondent was calculated based on the following formula.
Where, STI 1 is the Scientific Temperament Index value of the research scholar 1; W sa is the weight generated by the PCA for the first dimension i.e. scientific attitude; W sh is the weight generated by the PCA for the scientific habit; W sk is the weight generated by the PCA for the scientific knowledge; W sm is the weight generated by the PCA for the scientific method SA 1 = Scientific attitude index value of research scholar 1, SH 1 = Scientific habit index value of research scholar 1, SK 1 = Scientific knowledge index value of research scholar 1, SM 1 = Scientific method index value of research scholar 1, Accordingly, STI was calculated for each respondent. Finally, taking average of all respondents STI value, scientific temperament index value of research scholars was calculated. Based on the obtained composite index score, through cumulative square root frequency method, the respondent research scholars were grouped in to three categories, as low, medium and high scientific temperament.
Results and Discussion
Results and Discussion
Scientific temperament of research scholars towards conducting academic research
The scientific temperament of research scholars was measured through development of an index, using the indicator approach. Scientific temperament index of research scholars was a composite of four dimensions scientific attitude, scientific knowledge, scientific habit and scientific method. The final 11 indicators for developing the scientific temperament index were subjected to principal component analysis and first two principal components were selected with Eigen values greater than 1. The Eigen values for the selected two principal components were 6.610 and 1.249 (Table 2). The values of the 1 st Eigen value were multiplied with the 1 st extracted component matrix column and The fact that indicators related to scientific attitude, scientific habit, and scientific methods were given higher weights than indicators related to scientific knowledge suggested that the first three dimensions were comparatively more important than the scientific knowledge when assessing scientific temperament. In summary, the results of this analysis indicated that a researcher's scientific attitude, habit, knowledge, and methods play a significant role in determining the scientific temperament of research scholars towards conducting academic research. It is important for research scholars to maintain a balance between having a positive attitude, engaging with the scientific community, having a good understanding of research problem formulation, material and methods of research, and seeking expert consultation and using appropriate observation techniques. www.extensionjournal.com
| Principal component | Eigen value | % total variance explained | Cumulative % |
|---|---|---|---|
| 1. | 6.610 | 60.09 | 60.09 |
| 2. | 1.249 | 11.36 | 71.45 |
| 3. | 0.833 | 7.57 | 79.02 |
| 4. | 0.564 | 5.13 | 84.15 |
| 5. | 0.444 | 4.04 | 88.19 |
| 6. | 0.321 | 2.92 | 91.11 |
| 7. | 0.245 | 2.23 | 93.34 |
| 8. | 0.232 | 2.10 | 95.45 |
| 9. | 0.187 | 1.70 | 97.15 |
| 10. | 0.175 | 1.59 | 98.74 |
| 11. | 0.138 | 1.26 | 100.00 |
Table text extracted from the original PDF; superscript letters are shown inline. The original table image is below.
View original table image
Categorization of respondents based on scientific attitude
Based on the obtained weights for indicators associated with scientific attitude dimension were multiplied with the respondent normalized score for calculating scientific attitude index score. The respondents were further categorized based on index values obtained; into low, medium and high levels of scientific attitude using cumulative square root frequency method.
The distribution of respondents according to their scientific attitude showed that 70 individuals (28%) had a low scientific attitude, 124 individuals (50%) had a medium scientific attitude, and 56 individuals (22%) had a high scientific attitude (Table 4). The scientific attitude, which includes being skeptical, objective, and open-minded, is important for the progress of science and technology as it ensures that research is conducted in a thorough and unbiased way. Additionally, having a scientific attitude is a key aspect of scientific literacy and should be nurtured in students as they advance in their education. The results suggested that a majority of the respondents (78%) had a moderate to high scientific attitude towards conducting academic research, with only 28 per cent having a low scientific attitude. This indicated that the majority of the respondents had a positive attitude towards research. The findings are supported by Boppana (2019) [4] , who also reported that majority of the respondents were having favorable to most favorable attitudes towards research. Categorization of respondents based on scientific habits followed From the Table 5, it can be inferred that most of the respondents (43%) had followed a medium level of scientific habits, while 23 per cent of respondents had followed low and 34 per cent had followed high levels of scientific habits while conducting academic research. In conclusion, the results of the study suggested that a moderate level of scientific habit is present among the majority of the respondents, while a relatively equal number of respondents had low and high levels of scientific habit. The development of scientific habit is vital for individuals because it allows them to use scientific principles and methods in their thinking and problem-solving, leading to more critical thinking, improved problem-solving skills and better informed decision making. Scientific habit is also crucial for the advancement of science and technology, as it ensures research is conducted in a rigorous and unbiased way.
| Categories of scientific attitude | Frequency | Percentage |
|---|---|---|
| Low (0-0.70) | 70 | 28 |
| Medium (0.70-0.88) | 124 | 50 |
| High (0.88-1.0) | 56 | 22 |
Table text extracted from the original PDF; superscript letters are shown inline. The original table image is below.
View original table image
| Categories of scientific habit | Frequency | Percentage |
|---|---|---|
| Low (0-0.67) | 57 | 23 |
| Medium (0.67-0.88) | 108 | 43 |
| High (0.88-1.0) | 85 | 34 |
Table text extracted from the original PDF; superscript letters are shown inline. The original table image is below.
View original table image
Categorization of respondents based on scientific knowledge
As scientific knowledge encompasses an array of abilities and skills, including the ability to formulate problems, design experiments, analyze data and interpret results. It is crucial for researchers and scholars, particularly those pursuing a PhD, as it enables them to conduct research and make contributions to their field. The distribution of respondents according to their scientific knowledge in the Table 6 showed that the most (39%) had medium scientific knowledge, followed by (29%) having high scientific knowledge and (32%) with low scientific knowledge. These findings indicated that a significant portion of the respondents had a moderate level of knowledge about research problem formulation and material and methods of research. However, it is also important to note that a significant portion (32%) of the respondents had low scientific knowledge, indicating a potential need for further education and training in this area. The findings are supported by Ndenje-Sichalwe and Elia (2021) [15] as their study also emphasized the need to strengthen research methodology concepts by giving necessary trainings to students as well as lecturers as majority of the students were very poor in understanding and applying of research methodology concepts.
| Categories of scientific knowledge | Frequency | Percentage |
|---|---|---|
| Low (0-0.51) | 80 | 32 |
| Medium (0.51-0.67) | 98 | 39 |
| High (0.67-0.89) | 72 | 29 |
Table text extracted from the original PDF; superscript letters are shown inline. The original table image is below.
View original table image
Categorization of respondents based on scientific methods followed
The distribution of respondents according to their scientific methods as indicated in the Table 7 showed that most scholars (44%) had followed medium level of scientific methods followed, by 30 per cent research scholars who had followed high scientific methods and 26 per cent who had followed low scientific methods while conducting academic research. These findings suggested that a significant portion of the respondents had a moderate level of knowledge about scientific methods, which includes expert consultation for any doubts in conducting research and careful observation of any phenomena while conducting research. However, it is also important to note that a significant portion (26%) of the respondents had low scientific method, indicating a potential need for further education and training in this area.
| Categories of scientific method | Frequency | Percentage |
|---|---|---|
| Low (0-0.70) | 65 | 26 |
| Medium (0.70-0.90) | 110 | 44 |
| High (0.90-0.10) | 75 | 30 |
Table text extracted from the original PDF; superscript letters are shown inline. The original table image is below.
View original table image
Comparison of scientific temperament of PhD scholars based on their background
The comparison of scientific temperament of PhD scholars based on their background showed that the mean scientific temperament score for rural scholars was 0.699 and for urban scholars was 0.724 with a standard deviation of ±0.13 (Table 9). The results indicate that there was no significant difference between the scientific temperament of respondent research scholars born and brought up in rural and urban areas. The findings are contradictory with the study conducted by Acharya (2021) [1] where they found that undergraduate urban students from urban locality were having comparatively better scientific temperaments compared to their rural counterparts. The reasons for non significant difference in research scholars could be attributed to the experience and competencies rural students gained during PhD programme.
| Category | Scientific temperament mean | Standard deviation | z |
|---|---|---|---|
| Rural (n=151) | 0.699 | 0.16 | 1.651 (p=0.21) |
| Urban (n=99) | 0.724 | 0.13 |
Table text extracted from the original PDF; superscript letters are shown inline. The original table image is below.
View original table image
Comparison of scientific temperament of PhD scholars based on their gender
As shown in the Table 10, the findings of the comparison of the mean values of scientific temperament for the male respondents (0.701) and the female respondents (0.612) were significant at the 5 per cent level of significance. It further suggested that while teaching, special attention should be given to female respondents. The findings of this study were also in agreement with those of Acharya (2021) [1] and Maqsood et al. (2019) [12] , which likewise discovered that male students had superior scientific temperaments and favorable attitudes toward research. This may be due to the reasons that among all the married respondents, female respondents represent a sizable percentage and they may have additional responsibilities.
| Category | Scientific temperament mean | Standard deviation | z |
|---|---|---|---|
| Male (n=148) | 0.701 | 0.19 | 1.807 (p=0.03) |
| Female (n=102) | 0.612 | 0.22 |
Table text extracted from the original PDF; superscript letters are shown inline. The original table image is below.
View original table image
Comparison of scientific temperament of PhD scholars in top ranking and lowest ranking universities
It is clearly evident from the Table 11, that there was no significant difference in the scientific temperament of PhD scholars between top ranking and lowest ranking universities. The mean scientific temperament score for top ranking universities (0.71) and the mean score for lowest ranking universities (0.70) with the p-value of 0.42 indicated that there was no statistically significant difference in the scientific temperament between the two groups. It should be emphasized that the results of this study seem to indicate that a university's reputation may not always reflect the scholarly temperament of its PhD students. This might be because of a variety of elements, such as character traits, mentorship, and research opportunities, have a role in the formation of a scientific temperament. Based on findings it could be argued that universities, regardless of their standing, should give their PhD scholars equal opportunities to develop their scientific temperament.
| Category | Scientific temperament mean | Standard deviation | z |
|---|---|---|---|
| Top ranking universities (n=135) | 0.71 | 0.14 | 1.96 (p=0.42) |
| Lowest ranking universities (n=115) | 0.70 | 0.16 |
Table text extracted from the original PDF; superscript letters are shown inline. The original table image is below.
View original table image
Conclusion
Next to China and United States, India has the third largest higher education system in the world in terms of size, diversity, and the total number of institutions. Over the past 60 years, a number of governments have released a variety of educational plans, but they have not been sufficient to strengthen the educational system. Research and development are crucial for any institute to advance and operate to the wants of clients. Any human being must possess scientific temperament because his or her quality of life depends on the judgments they make. For that matter, individuals conducting science or scientific research, having a scientific temperament is essential since only when an individual evaluates issues objectively and with an open mind will their decisions allow for significant advancement in their research. The focus of the higher education system was mostly on learning different approaches or procedures for determining or comprehending a phenomenon, with little emphasis placed on its practical application. Any country's economy values a PhD degree highly since it indicates that the holder is a knowledge creator and has the potential to push the boundaries of knowledge. From the foregoing understanding, it appears that having a scientific temperament is a requirement for any scholar conducting research, yet very little research has been done. Hence, the present study was conducted to measure scientific temperament of doctoral research scholars in discipline of agricultural sciences in India. The findings suggest that there was a significant difference in scientific temperament of male and female doctoral research scholars. So, its better to focus future research on role and influence of gender on scientific temperament and productivity of research scholars.
Figures and tables from the paper
| SI. No | Dimensions | Indicators | Weightage |
|---|---|---|---|
| 1. | Scientific Attitude | Open mindedness | 5.54 |
| Critical thinking | 5.95 | ||
| Perseverance | 5.60 | ||
| Sense of responsibility | 5.04 | ||
| 2. | Scientific Habit | Engaging with scientific community | 5.13 |
| Habit of writing and reviewing | 5.75 | ||
| 3. | Scientific Knowledge | Knowledge on research problem formulation | 3.91 |
| Knowledge on material and methods of research | 1.79 | ||
| 4. | Scientific Method | Expert consultation | 5.64 |
| Observation techniques | 5.86 |
Table text extracted from the original PDF; superscript letters are shown inline. The original table image is below.
View original table image
| Categories of scientific temperament | Frequency | Percentage |
|---|---|---|
| Low (0-0.59) | 42 | 17 |
| Medium (0.59-0.78) | 118 | 47 |
| High (0.78-0.94) | 90 | 36 |
Table text extracted from the original PDF; superscript letters are shown inline. The original table image is below.
View original table image
References
20 in the original paper- Acharya R. The impact of locality and stream of study on scientific temperament among students. J Educ Res. 2021;34(2):89-98.
- Akkermans J, Brenninkmeijer V, Huibers M, Blonk RW. Competencies for the contemporary career: Development and preliminary validation of the career competencies questionnaire. J Career Dev. 2013;40(3):245-267.
- Bagaka JG, Badillo N, Bransteter I, Rispinto S. Exploring student success in a doctoral program: The power of mentorship and research engagement. Int J Dr Stud. 2015;10(1):323-342.
- Boppana J, VKH, Patel JB. Attitude of postgraduate students towards research. Guj J Ext Educ. 2019;30(1).
- Chakravarty A. Multivariate techniques for data analysis: An overview. Int J Res Econ Soc Sci. 2017;7(5):32-40.
- Daniel B, Kumar V, Omar N. Postgraduate conception of research methodology: Implications for learning and teaching. Int J Res Method Educ. 2018;41(2):220-236.
- Dhar PL. Developing scientific temper. Available at: pldhar.files.wordpress.com/2009/09/scientifictemper.pdf. Retrieved on 25-01-2021.
- Feroze SM, Chauhan AK. Performance of dairy selfhelp groups (SHGs) in India: Principal component analysis (PCA) approach. Indian J Agric Econ. 2010;65(902-2016-67912).
- Heretick DM, Tanguma J. Anxiety and attitudes toward statistics and research among younger and older nontraditional adult learners. J Contin High Educ. 2021;69(2):87-99.
- Jansen SJT, Boumeester HJFM, Rooij RM. Architecture students and research courses: are they aligned? Students' attitude towards research courses. Learn Environ Res. 2022;25(2):549-563.
- Maqsood Z, Huma S, Riaz N, Sardar I. Attitude towards research of university students. A multivariate analysis. J Educ Res Rev. 2019;4(3):37-43.
- Muthuswamy P, Vanitha R, Suganthan C, Ramesh PS. A study on attitude towards research among the doctoral students. Int J Civ Eng Technol. 2017;8(11):811-823.
- Nag G, Gope L, Nag GS. Research effectiveness: Some introductory thoughts to share. Educ Quest Int J Educ Appl Soc Sci. 2020;11(2):75-81.
- Ndenje-Sichalwe E, Elia EF. Research methodology practices among postgraduate Information Studies students in Tanzania. IFLA J. 2021;47(2):129-141.
- Oguan Jr FE, Bernal MM, Pinca MCD. Attitude and anxiety towards research, its influence on the students' achievement in the course. Asian J Manag Sci Educ. 2014;3(4):165-172.
- Saxena A. Understanding scientific temperament and assessing its social relevance. J Sci Temper. 2014;2(1&2):121-140. www.extensionjournal.com
- Shivarasad J, Reddy KJ, Singh R. Investigating the scientific temperament among research scholars of management studies. J Manag Res. 2022;25(1):56-65.
- Skakni I, Maggiori C, Masdonati J, Akkermans J. Ready for careers within and beyond academia? Assessing career competencies amongst junior researchers. High Educ Res Dev. 2022:1-16.
- Verderame MF, Freedman VH, Kozlowski LM, McCormack WT. Point of view: Competency-based assessment for the training of PhD students and earlycareer scientists. Elife. 2018;7.
- Antonia SJ, Villegas A, Daniel D, Vicente D, Murakami S, Hui R, et al. Durvalumab after chemoradiotherapy in stage III non-small-cell lung cancer. New England Journal of Medicine. 2017 Nov 16;377(20):1919-1929.