
Research article · 2024 · Full text
International Journal of Agriculture Extension and Social DevelopmentProfitability and cost of credit of made tea production in some selected areas of Maulvibazar district in Bangladesh
Volume 7(6) · Pages 98–105 · DOI: 10.33545/26180723.2024.v7.i6b.673 ↗
Research areasAgricultural Economics and Practices
Abstract
Author-writtenProfitability is the main cause for running a successful farm business and credit can play a significant role in achieving profitable agribusiness. The present study seeks to find out the financial profitability of tea cultivation, receipt, utilization, repayment, magnitude and extent of transaction cost involved for obtaining loan from 9 selected tea estates of Maulvibazar District applying simple random method. Descriptive statistics method like average, percentage, correlation, ratio etc. was used. This research indicates that Tea cultivation in Maulvibazar District is financially viable. Cost of production per kilogram and cost of cultivation per hectare of made tea were Tk. 158.18 and Tk. 2, 49,791, respectively. The highest cost component was the labour wage constituting 23.66% followed by establishment 18.00% and tea manufacturing 14.91% respectively. The average per hectare yield was 1547 kilogram. Gross return per kilogram and gross margin was per ha. Tk. 35.96 and Tk. 50,500,00 respectively. The average benefit-cost ratio was 1.20. The study showed that there exits positive correlation between the credit received and size of holdings The study shows that about seventy five per cent of credit is utilized for field level operations. Cost of credit including rate of interest is 13.48 per cent. To maintain the financial viability of the tea production, quality clonal plant materials should be used and cost of cultivation is to be reduced.
Summary
Source-checkedPlain-language reading of the full paper, prepared with AI and checked against the text. Each point links to the authors' own words.
Why it matters
- The tea sector is vital to Bangladesh's national economy because it generates employment, earns foreign exchange through exports, and helps reduce rural poverty. View evidence ↗
- A lack of standardized cost accounting practices among tea estates makes it difficult to compare production costs between different estates or within a single estate. View evidence ↗
The question
- The study aims to evaluate the financial profitability of tea cultivation and analyze the receipt, use, repayment, and transaction costs of loans across nine tea estates in the Maulvibazar District. View evidence ↗
What they did
- The researchers used a simple random sampling method to select nine tea estates from a total of 15 loan borrowers in the Maulvibazar district. View evidence ↗
- The study employed descriptive and statistical analysis tools, including averages, percentages, ratios, and correlation coefficients. View evidence ↗
What they found
- The average cost to produce one kilogram of made tea was Tk. 158.18. View evidence ↗
- Including both fixed and variable costs, the average cost of production per hectare was Tk. 249,791. View evidence ↗
- Labor wages were the most significant cost component, accounting for 23.66% of total production expenses. View evidence ↗
- The average yield of tea per hectare was 1,547 kg. View evidence ↗
- The average gross margin was Tk. 35.96 per kilogram and Tk. 50,500 per hectare. View evidence ↗
- Approximately 75.14% of the total loans obtained were used for field-level expenditures. View evidence ↗
- Loan repayment was highly satisfactory, with an average repayment rate of 100%. View evidence ↗
- The effective cost of credit, which includes the official 13% interest rate and transaction costs, was 13.48%. View evidence ↗
What it means
- The authors conclude that tea cultivation in the Maulvibazar District is financially viable. View evidence ↗
- To maintain financial viability, the authors recommend increasing per-hectare yields through better seeds and BTRI vegetative clones, while reducing production costs. View evidence ↗
Visual summary
3 visualsIllustrations explain the paper; charts are replotted from the paper's own table values.
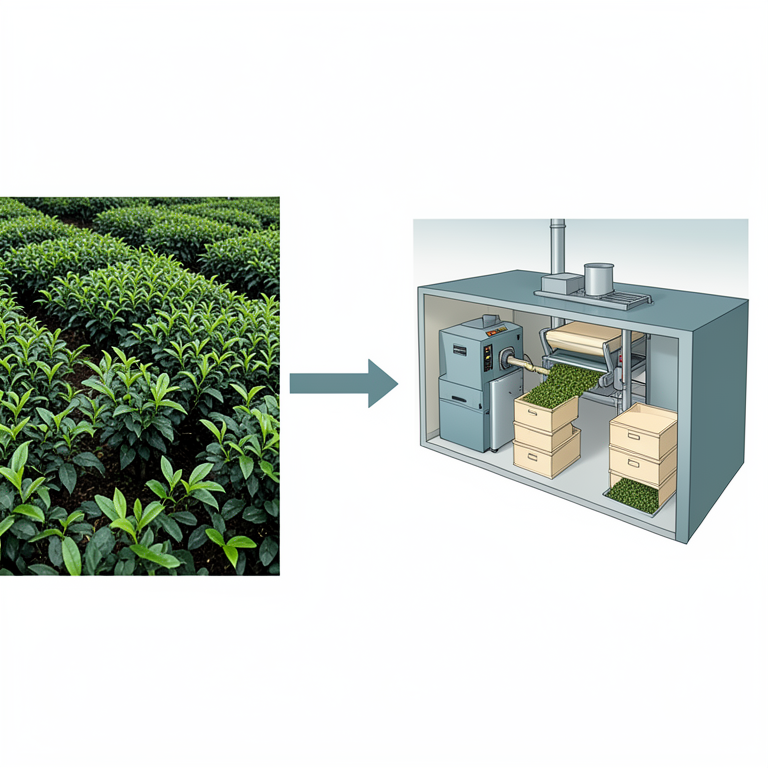
Cost Distribution of Tea Production
AI-generated conceptual illustration (tea plants and processed tea leaves in a factory setting). It explains the idea and does not show study data.
View source evidence ↗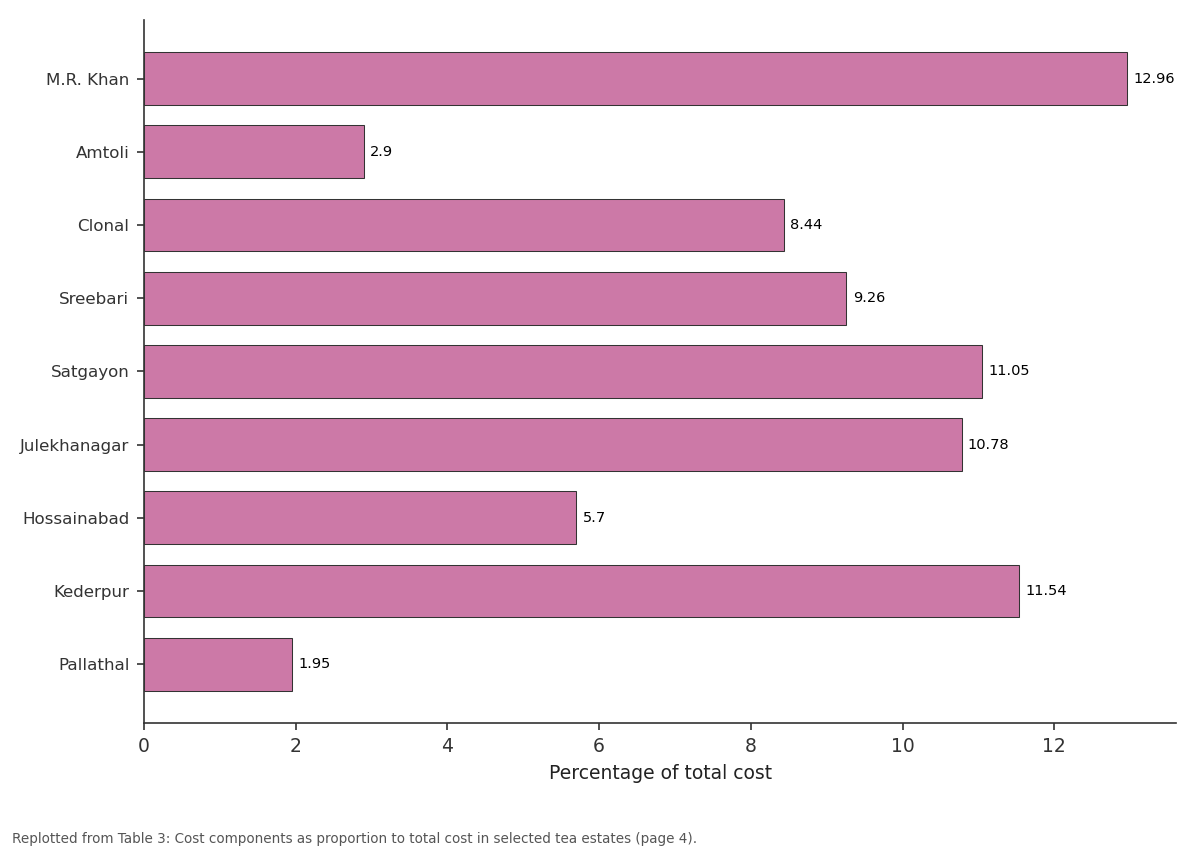
Labor Welfare: M.R. Khan vs Amtoli vs Clonal vs Sreebari vs Satgayon
Replotted from Table 3 (page 4) of the original paper. Every bar is the paper's own table value.
View source evidence ↗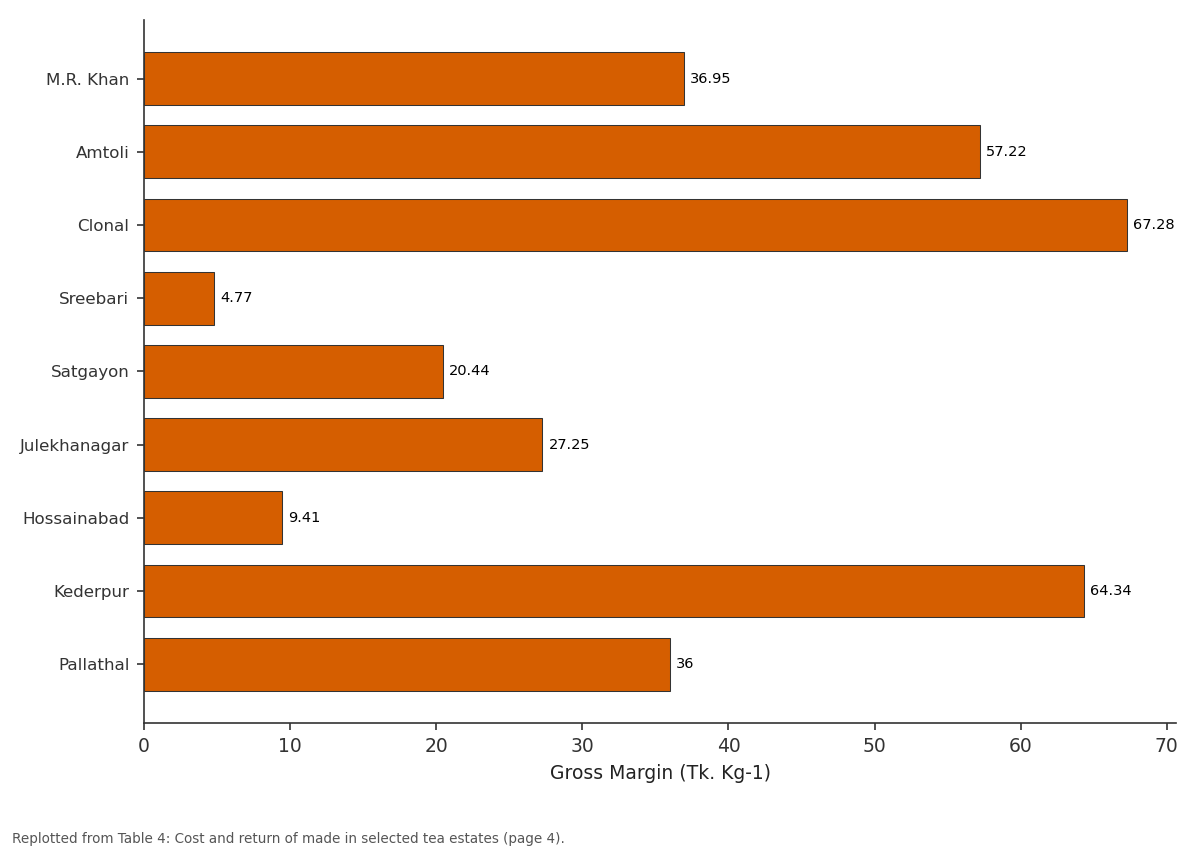
Tk. Kg-1: M.R. Khan vs Amtoli vs Clonal vs Sreebari vs Satgayon
Replotted from Table 4 (page 4) of the original paper. Every bar is the paper's own table value.
View source evidence ↗Figures & tables
From the original paper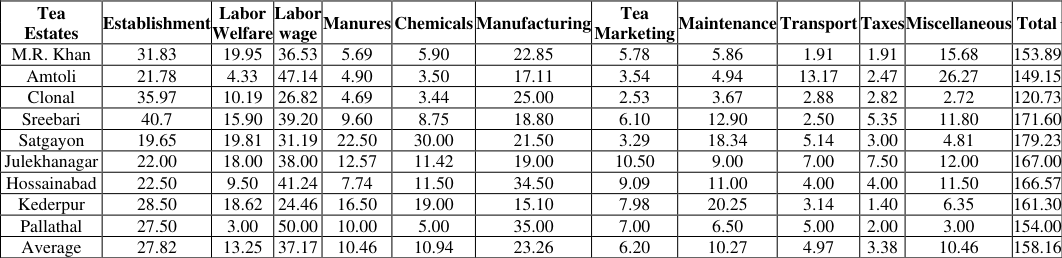 Table 1
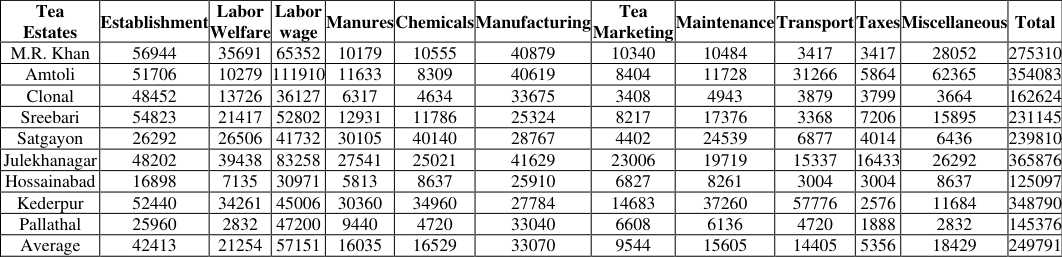 Table 2
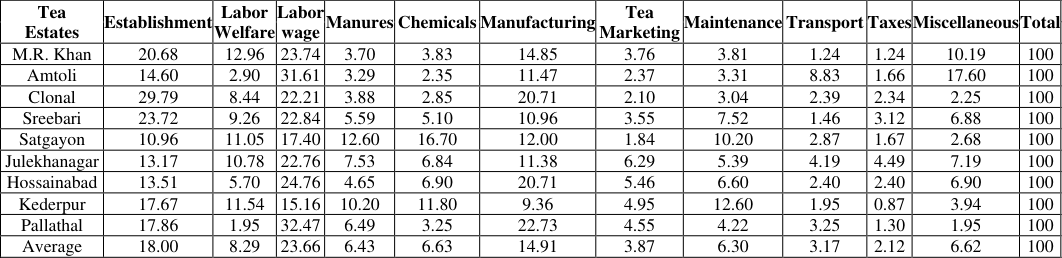 Table 3
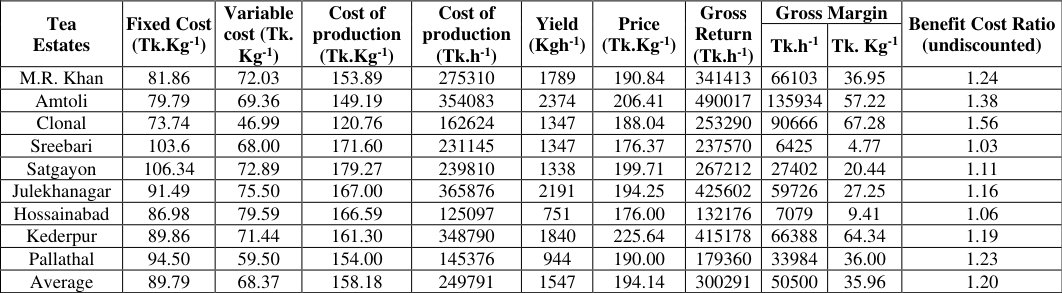 Table 4
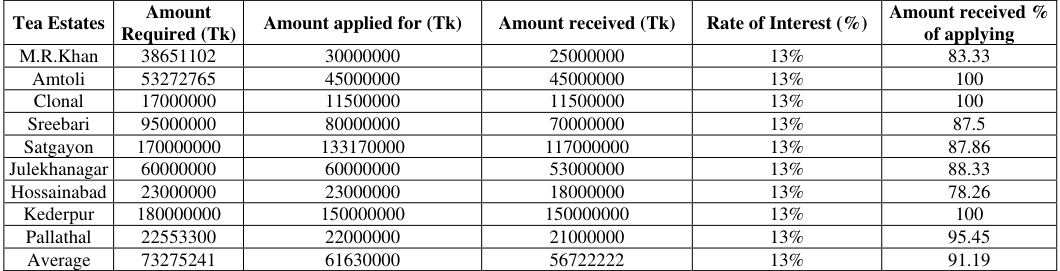 Table 5
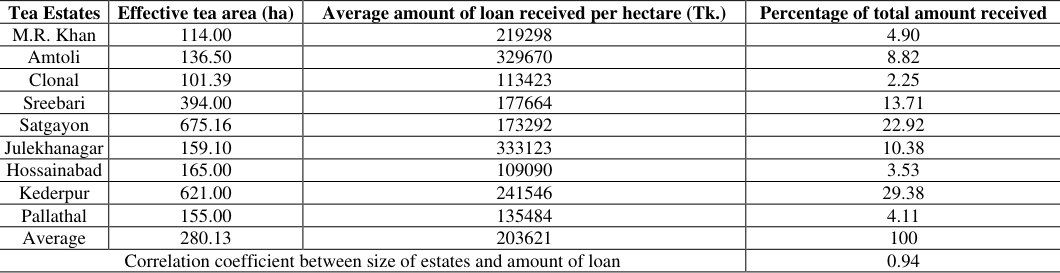 Table 6
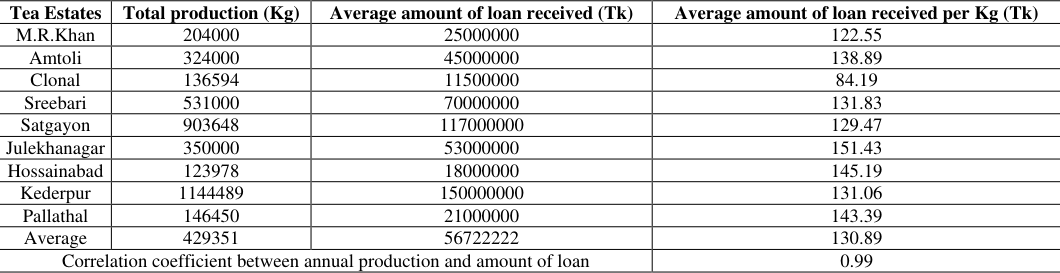 Table 7
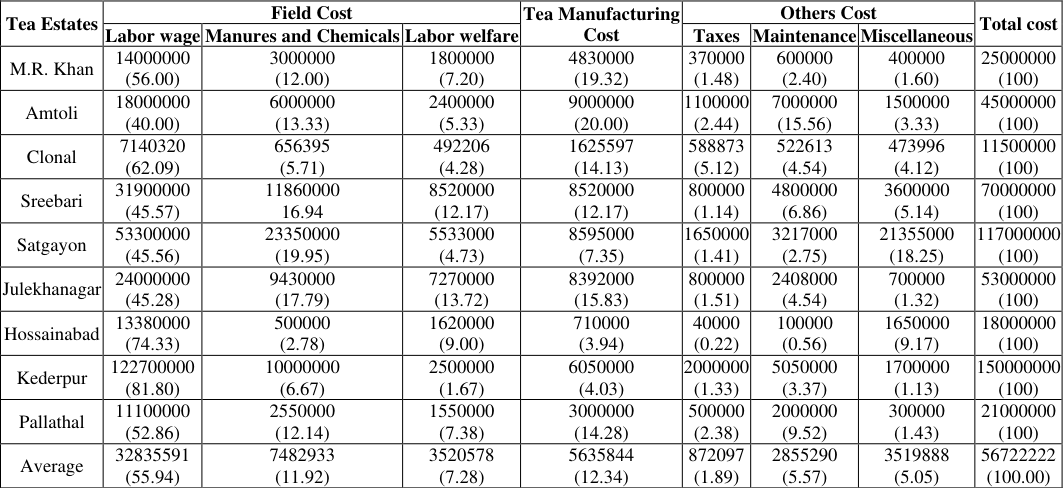 Table 8
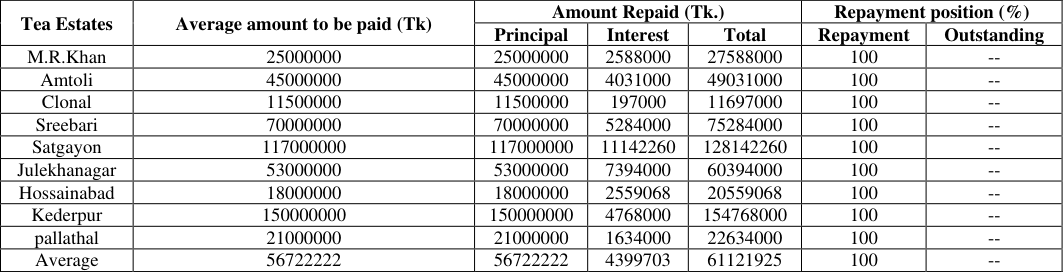 Table 9
 Table 10
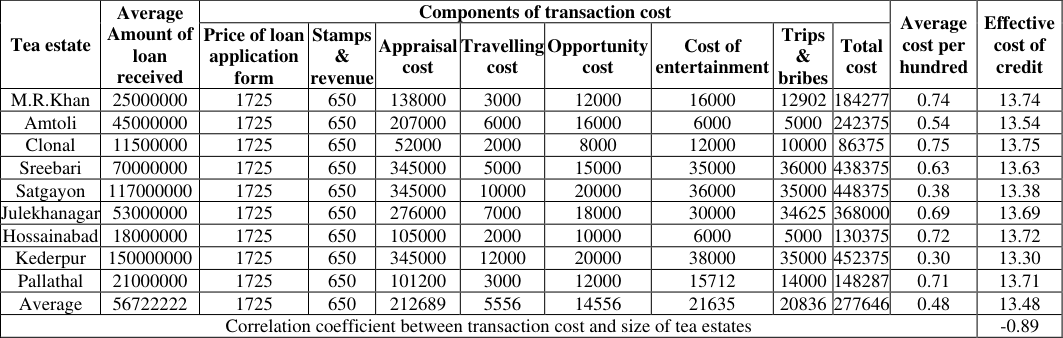 Table 11
Introduction
Tea industry is a more than 166 years old and labour intensive agro-based export-oriented industry in Bangladesh. The industry starts its journey from 1984 establishing commercial cultivation at Malnicherra in Sylhet District. But at present this industry has extended vast areas of Maulvibazar, Habigong and Chattogram District. Very recently Panchagarh District has come up in this line as a new area both in small farming concept and tea estates for commercial commitments. Tea (Camellia sinensis) belongs to the family Theaceae. Tea is one of the significant nonalcoholic beverage drinks worldwide and has been gaining popularity as an important health drink in view of its purported medicinal value. Nowadays it is served as a morning drink for nearly two third of the world population daily (Islam, et al. 2005) [6] . Tea sector plays a significant role in the national economy through employment generation, export earnings and poverty reduction in the rural areas. Bangladesh contributed 1.63% of world tea production and shared only 0.04% of global tea exports (BTB, 2019) [4] , Presently there are 167 tea estates and 5351 small growers/holders have devoted an area of 117264 hectare for tea plantation out of which 64164 hectares been cultivated under tea (BTB, 2019) [4] . It affords direct employment to about one lakh four thousand poor people out of which 51% are women. Tea industry stressed with various difficulties has also increased per hectare yield from 639 Kgh -1 in 1970 to 1767 Kgh -1 in 2019. Bangladesh produced 96.07 million kg of tea and consumed 95.20 million kg of tea (595 grams/per head). Due to increased tea drinking habit, population growth and rapid urbanization consumption increased @ 2.24% per annum but on the other hand the rate of export has been decreasing @8.38% for the last 20 years (from 2000-2020). If these trends continue, export will quickly shrink to standstill and the country will be a net importer of tea to meet the local demand of the country. The sharp increase in internal consumption of tea with tight supply has resulted in an extraordinary demand for tea in Bangladesh. At its present rate, population will be about 182.31 million and domestic www.extensionjournal.com requirement of tea will be about 84.06 million kg and production will be 93.63 million kg by 2025. Thus, production must be increased by investment in field, factory, labour welfare and human resource development to meet internal demand and maintain export share to earn foreign exchange (Ahmed 2012) [1] . The cost of production of a commodity plays an important role in the economy of the industry concerned. It regulates and also indicates the growth of an industry. It furnishes the real base for making a policy decision. In spite of such role of production cost and the fact that tea industry is one of the oldest organized industries of our country. Cost has remained as an underdeveloped field of study. Systematic cost accounting is still little known or practised by a significant no. of estates and the costing methods are not being standardised. This makes inter-estate and also intraestate cost comparisons extremely difficult and unrewarding. For a perennial crop like tea the concept of short run cost as adopted in farm management studies have little relevance. It is not easy to disentangle and classify the various items, which go to make costs of production. Each estate or company has own methods of allocating the items of expenditure. This study likes to see "standard abstract of charges" which can enable us to tell at a glance different emphasis which different estates place upon different aspects of production. It is evident that availability of some quantitative and qualitative data both in land and manufacturing sector is essential in working out cost per of unit area and per unit of output. Data on various components of fixed and variable costs both in the field and manufacturing sector however are available. Profitability is one of the major criteria for determination of planters' acceptance of tea production. This study depicts the cost of cultivation, gross return, gross margin and benefit cost ratio to measure the efficiency of made tea cultivation. With the introduction of modern techniques in crop production and deterioration of farmers' economic condition in Bangladesh, credit is now as an indispensable ingredient of production. Tea estates are managed and controlled by joint stock companies, partnership and proprietary concerned. Tea industry requires both long-term and shortterm finance. Long term fund is necessary for financing capital expenditure e.g. planting and replanting, factory construction or improvement, construction of labour quarters and hospitals etc. The short term finance is needed as working capital for defraying seasonal expenses of production and distribution of teas. The owners of the proprietary tea estates are not always able to invest that required amount of fund to meet the current expenditure for tea production. That is why, sanction of hypothecation loan for production is indispensable for accelerating the production of tea in Bangladesh. Tea being an agro-based industry, Bangladesh Krishi Bank (BKB) has been providing loan to tea industry for its improvement and development especially with particular emphasis on production since 1959.Bangladesh tea industry is to face a lot of problems such as production and quality, cost of production, extension and replantation of tea, marketing of tea, reduction of exports and export promotion activities etc. As a matter of fact, in spite of all these unfavourable conditions, BKB is still providing the financial assistance for accelerating tea production in Bangladesh.
But, as of to-day, no. of in-depth study was undertaken to investigate the lending and borrowing aspects of the tea estates. The present study is concerned with the extent of loan received from credit institution by the tea estate, its utilization, repayment and cost of credit therein. As an agro-industry, economic research on tea is to be run from the very foundation of tea estates. Keeping this view in mind, Bangladesh tea research institute started research on tea economics since 1991. Saha and Gazi (1994) [9] carried out a study on" Economic profile of the tea estates managed by Bangladesh Tea Board" to examine the economic profitability and break even yield of mature tea production. The study revealed that per kilogram cost of production and per hectare cost of cultivation at BTB managed tea garden are Tk. 32.36 and Tk. 42,155, respectively. Saha et al. (2007) [11] undertaken an experiment on "cost of production of tea in selected areas of Bangladesh". They found that on an average per kilogram cost of made tea was Tk. 54.40. The average per kilogram cost of made tea was the highest (Tk. 62.69 kg -1 ) at U class while it was the lowest (Tk. 53.07 kg -1 ) at A class. They noted that production cost decreased with an increase in production. The average per kg cost of made tea in greater Sylhet and greater Chittagong was Tk. 52.47 and Tk. 59.13, respectively. The average per kg cost of made tea was the highest at greater Chittagong irrespective of type of managements and classes. The average per kg cost of made tea was the highest (Tk. 57.67 kg -1 ) at proprietary tea estates while it was the lowest (Tk. 47.91 kg -1 ) at BTB managed tea estates. Saha et al. (2011) [12] conducted a research work on "cost of production of green leaf in some selected small tea growers of Bangladesh". He found that on an average per kilogram cost of green of small farmer was found to be Tk 10.16 and Tk 12.65 on the basis of variable and fixed cost basis respectively. On an average, the expenditure was the highest for labour wage Tk. 4.15 and was the lowest Tk 0.73 for chemicals. Cost of labour wage was the major cost items constituting 40.85% of the total cost. Among the labour cost, the highest cost was incurred in plucking (44.33%) followed by weeding (28.68%). The second major cost was incurred in overhead accounting for 18.60% of the total cost. Saha et al. (2012) [13] was undertaken a study to work our production cost and economic profitability for made tea cultivation in Bangladesh. The study showed that per kilogram and per hectare cost of made tea were tk.63.42 and Tk. 87886 respectively. The highest cost component was the labour wage constitutes 22.60% followed by tea manufacturing 22.39%. The average per kilogram and per hectare gross margin of Bangladesh tea was tk.49.79 and Tk. 69023. The gross margin as well as benefit cost ratio was noted to be higher at Sylhet valley circle compared with Chittagong valley circle. Borah Kaberi et al. (2015) [3] made a survey on "growth of small tea growers and economic independence of local person in Assam". He found that high profit along with steady income and employment attracted a lot of young people in rural and urban areas. This type of private entrepreneurship initiated by the Small Tea Growers promoted the spirit of agro-industrialization and strengthened the local economy of Assam. www.extensionjournal.com Kiruthiga, D. et al (2017) [7] made an investigation on "economics of tea cultivation in the Nilgiris District". He revealed that cost of cultivation for small farmers was low wherein the revenue is high. Since growers are efficient in using the inputs and they procure by their own in most cases while it is difficult for relatively larger farmers. As a result, the yield is high for small farmers as towards the relatively larger farmers The present study aims at analyzing the recent cost and cost structure, economic profitability, availability, utilization, repayment behaviour and cost of finance of made tea in some selected regimes of Maulvibazar District. Hence, the proposed study is expected to generate a lot of vital information useful for the planters and policy planners to guide the tea industry in Maulvibazar District which is at present indispensable for the overall development of the tea estate and the earning of foreign currency for the country.
Materials and Methods
To satisfy the objectives an up-to-date list of the tea loan borrowers was taken from the regional office of Bangladesh Krishi Bank (BKB) for selecting of the sample design. There were altogether 15 tea loan borrowers in Maulvibazar district, out of which nine tea estates were selected by applying simple random method. A pre-designed structured schedule is given for the collection of data from the selected tea estates. Both descriptive and statistical methods of analyses using average, percentage, ratio, correlation coefficient etc. were followed in the study. The cost components considered for evaluating per kilogram and per hectare cost of made tea were: (i) Establishment (ii) Labor Welfare (iii) Labor wage (iv) Fertilizers and manures (v) Insecticides and pesticides (vi) Tea manufacturing (vii) Tea Marketing (viii) Transport (ix) Maintenance of building and machinery (x) Taxes (xi) Miscellaneous. The per kilogram cost of tea indicates all sorts of costs involved to produce and manufacture one kilogram of finished tea. Similarly, the per hectare cost will mean all sorts of cost incurred per unit of time for cultivation and manufacturing of tea in one hectare of plantation area. To measure the economic performance of mature tea cultivation descriptive statistics such as the average, percentage, total cost, gross return, gross margin, and benefit cost ratio etc. were used.
Gross Return
Where, GR i = Gross Return from i th product (Tk. ha -1 ) Q i = Quantity of the ith product (kg) P i = Average price of the ith product (Tk.) I= 1, 2, 3………., n.
Gross margin
Gross margin was calculated among the difference between gross return and total variable costs. That is, GM= GR-TV Where, GM= Gross margin, GR= Gross Return, TVC= Total variable cost.
Results and Discussion
Results and Discussion
Cost of cultivation and Economic Profitability of made tea
The cost incurred for use of different inputs in tea cultivation was calculated on the basis of per unit area, output and return received. The study showed that on an average, per kilogram cost of made tea was Tk. 158.18 (Table 1). The average per kilogram cost was the highest at Satgayon tea estate (Tk. 179.23) while it was the lowest at Clonal tea estate (Tk. 120.73). The study revealed that on an average, the expenditure was the highest for labour wage Tk. 37.17 followed by establishment Tk. 27.82, tea manufacturing Tk. 23.26 and labour welfare Tk. 13.25 respectively. When all fixed and variable costs are considered, the average per hectare cost of made tea was found to be Tk. 249791 (Table 2). It was noted that per hectare cost was the highest at Julekhanagar tea estate (Tk. 365876) and the lowest at Hossainabad tea estate (Tk. 125097). Table 3 exhibited the percentage of different items of cost to total production cost of made tea cultivation. Labour wage was the important items of expenses constituting 23.66% of the total expenses. The second major cost was incurred in establishment accounting for 18% of the total cost. The percentage of labour cost was the highest at Pallathal tea estate 32.47% while it was the lowest at Kederpur tea estate 15.16%. The percentage of establishment cost was seen to be the highest at Clonal tea estate 29.79% while it was the lowest at Julekhanagar tea estate 13.17%. It was observed that on an average, the per hectare yield of Bangladesh tea was 1547 Kg (Table 4). The yield was the highest at Amtoli tea estate, 2374 Kgh -1 while it was the lowest at Hossainabad tea estate, 751 Kgh -1 . The average per kilogram price in the selected tea estates was Tk. 194.14. The price was the highest at Kederpur tea estate, Tk. 225.64 Kg -1 while it was the lowest at Hossainabad tea estate, Tk. 176 Kg -1 . The study showed that on an average, per kilogram and per hectare gross margin in the selected tea estates was Tk. 35.96 and Tk. 50,500, respectively. The study showed that per kilogram gross margin was seen to be the highest at Clonal tea estate Tk. 67.28 and the lowest was at Sreebari tea estate Tk. 4.77. The study revealed that that per hectare gross margin was the highest at Amtoli tea estate Tk. 1, 35, 934 while it was the lowest at Sreebari tea estate Tk 6,425. When all costs are taken into account, the average benefit-cost ratio was 1.20. This implies that a planter could earn Tk. 1.20 with investment of Tk. 1.00 www.extensionjournal.com
| Tea Estates | Fixed Cost (Tk.Kg-1) | Variable cost (Tk. Kg-1) | Cost of production (Tk.Kg-1) | Cost of production (Tk.h-1) | Yield (Kgh-1) | Price (Tk.Kg-1) | Gross Return (Tk.h-1) | Gross Margin | — | Benefit Cost Ratio (undiscounted) |
|---|---|---|---|---|---|---|---|---|---|---|
| Tk.h-1 | Tk. Kg-1 | |||||||||
| M.R. Khan | 81.86 | 72.03 | 153.89 | 275310 | 1789 | 190.84 | 341413 | 66103 | 36.95 | 1.24 |
| Amtoli | 79.79 | 69.36 | 149.19 | 354083 | 2374 | 206.41 | 490017 | 135934 | 57.22 | 1.38 |
| Clonal | 73.74 | 46.99 | 120.76 | 162624 | 1347 | 188.04 | 253290 | 90666 | 67.28 | 1.56 |
| Sreebari | 103.6 | 68.00 | 171.60 | 231145 | 1347 | 176.37 | 237570 | 6425 | 4.77 | 1.03 |
| Satgayon | 106.34 | 72.89 | 179.27 | 239810 | 1338 | 199.71 | 267212 | 27402 | 20.44 | 1.11 |
| Julekhanagar | 91.49 | 75.50 | 167.00 | 365876 | 2191 | 194.25 | 425602 | 59726 | 27.25 | 1.16 |
| Hossainabad | 86.98 | 79.59 | 166.59 | 125097 | 751 | 176.00 | 132176 | 7079 | 9.41 | 1.06 |
| Kederpur | 89.86 | 71.44 | 161.30 | 348790 | 1840 | 225.64 | 415178 | 66388 | 64.34 | 1.19 |
| Pallathal | 94.50 | 59.50 | 154.00 | 145376 | 944 | 190.00 | 179360 | 33984 | 36.00 | 1.23 |
| Average | 89.79 | 68.37 | 158.18 | 249791 | 1547 | 194.14 | 300291 | 50500 | 35.96 | 1.20 |
Table text extracted from the original PDF; superscript letters are shown inline. The original table image is below.
View original table image
| Tea Estates | Establishment | Labor Welfare | Labor wage | Manures | Chemicals | Manufacturing | Tea Marketing | Maintenanc | e Transport | Taxes | Miscellaneous | Total |
|---|---|---|---|---|---|---|---|---|---|---|---|---|
| M.R. Khan | 20.68 | 12.96 | 23.74 | 3.70 | 3.83 | 14.85 | 3.76 | 3.81 | 1.24 | 1.24 | 10.19 | 100 |
| Amtoli | 14.60 | 2.90 | 31.61 | 3.29 | 2.35 | 11.47 | 2.37 | 3.31 | 8.83 | 1.66 | 17.60 | 100 |
| Clonal | 29.79 | 8.44 | 22.21 | 3.88 | 2.85 | 20.71 | 2.10 | 3.04 | 2.39 | 2.34 | 2.25 | 100 |
| Sreebari | 23.72 | 9.26 | 22.84 | 5.59 | 5.10 | 10.96 | 3.55 | 7.52 | 1.46 | 3.12 | 6.88 | 100 |
| Satgayon | 10.96 | 11.05 | 17.40 | 12.60 | 16.70 | 12.00 | 1.84 | 10.20 | 2.87 | 1.67 | 2.68 | 100 |
| Julekhanagar | 13.17 | 10.78 | 22.76 | 7.53 | 6.84 | 11.38 | 6.29 | 5.39 | 4.19 | 4.49 | 7.19 | 100 |
| Hossainabad | 13.51 | 5.70 | 24.76 | 4.65 | 6.90 | 20.71 | 5.46 | 6.60 | 2.40 | 2.40 | 6.90 | 100 |
| Kederpur | 17.67 | 11.54 | 15.16 | 10.20 | 11.80 | 9.36 | 4.95 | 12.60 | 1.95 | 0.87 | 3.94 | 100 |
| Pallathal | 17.86 | 1.95 | 32.47 | 6.49 | 3.25 | 22.73 | 4.55 | 4.22 | 3.25 | 1.30 | 1.95 | 100 |
| Average | 18.00 | 8.29 | 23.66 | 6.43 | 6.63 | 14.91 | 3.87 | 6.30 | 3.17 | 2.12 | 6.62 | 100 |
Table text extracted from the original PDF; superscript letters are shown inline. The original table image is below.
View original table image
| Tea Estates | Establishment | Labor Welfare | Labor wage | Manures | Chemicals | Manufacturing | Tea Marketing | Maintenance | Transport | Taxes | Miscellaneous | Total |
|---|---|---|---|---|---|---|---|---|---|---|---|---|
| M.R. Khan | 56944 | 35691 | 65352 | 10179 | 10555 | 40879 | 10340 | 10484 | 3417 | 3417 | 28052 | 275310 |
| Amtoli | 51706 | 10279 | 111910 | 11633 | 8309 | 40619 | 8404 | 11728 | 31266 | 5864 | 62365 | 354083 |
| Clonal | 48452 | 13726 | 36127 | 6317 | 4634 | 33675 | 3408 | 4943 | 3879 | 3799 | 3664 | 162624 |
| Sreebari | 54823 | 21417 | 52802 | 12931 | 11786 | 25324 | 8217 | 17376 | 3368 | 7206 | 15895 | 231145 |
| Satgayon | 26292 | 26506 | 41732 | 30105 | 40140 | 28767 | 4402 | 24539 | 6877 | 4014 | 6436 | 239810 |
| Julekhanagar | 48202 | 39438 | 83258 | 27541 | 25021 | 41629 | 23006 | 19719 | 15337 | 16433 | 26292 | 365876 |
| Hossainabad | 16898 | 7135 | 30971 | 5813 | 8637 | 25910 | 6827 | 8261 | 3004 | 3004 | 8637 | 125097 |
| Kederpur | 52440 | 34261 | 45006 | 30360 | 34960 | 27784 | 14683 | 37260 | 57776 | 2576 | 11684 | 348790 |
| Pallathal | 25960 | 2832 | 47200 | 9440 | 4720 | 33040 | 6608 | 6136 | 4720 | 1888 | 2832 | 145376 |
| Average | 42413 | 21254 | 57151 | 16035 | 16529 | 33070 | 9544 | 15605 | 14405 | 5356 | 18429 | 249791 |
Table text extracted from the original PDF; superscript letters are shown inline. The original table image is below.
View original table image
| Tea Estates | Establishment | Labor Welfare | Labor wage | Manures | Chemicals | Manufacturing | Tea Marketing | Maintenance | Transport | Taxes | Miscellaneous | Total |
|---|---|---|---|---|---|---|---|---|---|---|---|---|
| M.R. Khan | 31.83 | 19.95 | 36.53 | 5.69 | 5.90 | 22.85 | 5.78 | 5.86 | 1.91 | 1.91 | 15.68 | 153.89 |
| Amtoli | 21.78 | 4.33 | 47.14 | 4.90 | 3.50 | 17.11 | 3.54 | 4.94 | 13.17 | 2.47 | 26.27 | 149.15 |
| Clonal | 35.97 | 10.19 | 26.82 | 4.69 | 3.44 | 25.00 | 2.53 | 3.67 | 2.88 | 2.82 | 2.72 | 120.73 |
| Sreebari | 40.7 | 15.90 | 39.20 | 9.60 | 8.75 | 18.80 | 6.10 | 12.90 | 2.50 | 5.35 | 11.80 | 171.60 |
| Satgayon | 19.65 | 19.81 | 31.19 | 22.50 | 30.00 | 21.50 | 3.29 | 18.34 | 5.14 | 3.00 | 4.81 | 179.23 |
| Julekhanagar | 22.00 | 18.00 | 38.00 | 12.57 | 11.42 | 19.00 | 10.50 | 9.00 | 7.00 | 7.50 | 12.00 | 167.00 |
| Hossainabad | 22.50 | 9.50 | 41.24 | 7.74 | 11.50 | 34.50 | 9.09 | 11.00 | 4.00 | 4.00 | 11.50 | 166.57 |
| Kederpur | 28.50 | 18.62 | 24.46 | 16.50 | 19.00 | 15.10 | 7.98 | 20.25 | 3.14 | 1.40 | 6.35 | 161.30 |
| Pallathal | 27.50 | 3.00 | 50.00 | 10.00 | 5.00 | 35.00 | 7.00 | 6.50 | 5.00 | 2.00 | 3.00 | 154.00 |
| Average | 27.82 | 13.25 | 37.17 | 10.46 | 10.94 | 23.26 | 6.20 | 10.27 | 4.97 | 3.38 | 10.46 | 158.16 |
Table text extracted from the original PDF; superscript letters are shown inline. The original table image is below.
View original table image
Availability, Utilization, repayment and cost of credit for obtaining tea loan
The Table.5 shows that on average loan received per tea estate was Tk. 5,67,2,222.00 The research shows that tea estate received 91.19% of the loan against applied amount. It was observed that on an average the amount of loan received per hectare was Tk. 2,03,621,00 (Table 6). The study showed that a positive correlation (0.94) existed www.extensionjournal.com between the amount of loan received and the size of tea estates. This implies that with the increased of size of tea estate the average amount of loan obtained also increases. Saha et al. (2008) [10] also found that the amount of loan per hectare was increased with the increase of farm size The study also depicts that average amount of loan obtained by larger tea estates was relatively higher than that of smaller tea estates. It was therefore clear that beneficiaries of the tea loan under consideration were the larger tea estates. The Table.7 showed the distribution of loan according to annual production. The research revealed that there was a strong positive correlation (0.99) between the amount of loan received and production. It was observed that amount of loan obtained was higher whose production more. The study also revealed that on an average amount of loan received per kilogram was 130.89. Loans obtained by the tea estates from different sources were generally spent for different purposes. That is why a thorough investigation was done to examine the utilization of pattern of loan for tea production. The analysis of credit utilization revealed that about 75.14% of the total loan was utilized in meeting field expenditure followed by tea manufacturing 12.34% and others 12.5% respectively (Table 8). Among the field costs, labour wage was the highest contributing about 55.94% of the total cost. The study showed that the tea loan borrowers utilized loan properly as per schedule. www.extensionjournal.com The Table.9 depicted the repayment capacity of the selected tea loanee. The average loan repayment in general was highly satisfactory and it was 100 per cent. This was mostly because of the fact that tea was a cash crop and its price was realized in the auction market, which was controlled by the brokers. So, the bank loan was realized by instalment from the auction market where there is no control of tea estates. That was why the repayment behaviour was highly satisfactory. Therefore, it could be concluded that tea estates were the best re-payers compared with other agricultural loan. While getting loans from any source, particularly institutional sources, the farmers had to spend some amount of money for its negotiation. These expenses incurred in getting loans were termed as transaction cost of credit. The Table .10 showed that the average amount of non interest cost incurred by an estate for his tea loan for an average amount of loan of Tk. 5,67,22,222.00 was 2,77,646.00. The loanee had to incur an average amount of Tk.1725.00 for price of application loan form Tk. 650 for stamps and revenue, Tk. 2,12,689 for appraisal cost, Tk. 5,556 travelling cost, Tk. 14,556.00 for sacrificing of working days lost in obtaining the loan, Tk. 21,635.00 for cost of entertainment and Tk. 20,836.00 for unplanned expenditure. The average transaction cost of getting a loan of taka 100 was only Tk. 0.48 excluding the usual rate of interest. Then the effective cost of credit including the official rate of 13% became Tk. 13.48. The highest proportion of non interest cost incurred by a loanee was for appraisal cost which accounted to 76.60 per cent of the total cost incurred. The lowest amount 0.23% was spent by the loanees for stamp and revenue. The non interest cost in loan transaction for tea loan was very negligible since the average amount was high. www.extensionjournal.com It was noted that the transaction cost was decreased with the increase of the size of tea estates. Saha et al (2008) [10] showed that transaction cost bore an inverse correspondence with loan size which implied that transaction costs became lower when loan size increased. Thus, it was clear that the borrowers having small size of tea estates incurred the highest cost of credit because the initial expenditure in the process of getting loan was almost the same in the study area. The study also revealed that, on an average, transaction cost per hundred was lower in comparison to any other agricultural or non-agricultural loan. Therefore, it encouraged the tea planters for taking loan from BKB which eventually increased the production of Bangladesh tea which in turn increased the export earning of the country.
| Tea Estates | Effective tea area (ha) | Average amount of loan received per hectare (Tk.) | Percentage of total amount received |
|---|---|---|---|
| M.R. Khan | 114.00 | 219298 | 4.90 |
| Amtoli | 136.50 | 329670 | 8.82 |
| Clonal | 101.39 | 113423 | 2.25 |
| Sreebari | 394.00 | 177664 | 13.71 |
| Satgayon | 675.16 | 173292 | 22.92 |
| Julekhanagar | 159.10 | 333123 | 10.38 |
| Hossainabad | 165.00 | 109090 | 3.53 |
| Kederpur | 621.00 | 241546 | 29.38 |
| Pallathal | 155.00 | 135484 | 4.11 |
| Average | 280.13 | 203621 | 100 |
| Correlation coefficient between size of estates and amount of loan | 0.94 |
Table text extracted from the original PDF; superscript letters are shown inline. The original table image is below.
View original table image
Conclusion
Tea cultivation in Maulvibazar District was financially viable. To sustain the viability per hectare yield of the district should be increased and its quality could be improved by introducing BTRI vegetative clones and better quality seeds and also by reducing per hectare cost of production which helped the tea estates sustainable and financially viable. The utilization of tea loan was done as per schedule and repayment capacity of the tea loanees was highly satisfactory. Therefore, the BKB should provide loan to the tea estates in adequate amount in proper time which enhanced per hectare yield for sustaining the tea estates financially viable.
Figures and tables from the paper
| Tea Estates | Amount Required (Tk) | Amount applied for (Tk) | Amount received (Tk) | Rate of Interest (%) | Amount received % of applying |
|---|---|---|---|---|---|
| M.R.Khan | 38651102 | 30000000 | 25000000 | 13% | 83.33 |
| Amtoli | 53272765 | 45000000 | 45000000 | 13% | 100 |
| Clonal | 17000000 | 11500000 | 11500000 | 13% | 100 |
| Sreebari | 95000000 | 80000000 | 70000000 | 13% | 87.5 |
| Satgayon | 170000000 | 133170000 | 117000000 | 13% | 87.86 |
| Julekhanagar | 60000000 | 60000000 | 53000000 | 13% | 88.33 |
| Hossainabad | 23000000 | 23000000 | 18000000 | 13% | 78.26 |
| Kederpur | 180000000 | 150000000 | 150000000 | 13% | 100 |
| Pallathal | 22553300 | 22000000 | 21000000 | 13% | 95.45 |
| Average | 73275241 | 61630000 | 56722222 | 13% | 91.19 |
Table text extracted from the original PDF; superscript letters are shown inline. The original table image is below.
View original table image
| Tea Estates | Total production (Kg) | Average amount of loan received (Tk) | Average amount of loan received per Kg (Tk) |
|---|---|---|---|
| M.R.Khan | 204000 | 25000000 | 122.55 |
| Amtoli | 324000 | 45000000 | 138.89 |
| Clonal | 136594 | 11500000 | 84.19 |
| Sreebari | 531000 | 70000000 | 131.83 |
| Satgayon | 903648 | 117000000 | 129.47 |
| Julekhanagar | 350000 | 53000000 | 151.43 |
| Hossainabad | 123978 | 18000000 | 145.19 |
| Kederpur | 1144489 | 150000000 | 131.06 |
| Pallathal | 146450 | 21000000 | 143.39 |
| Average | 429351 | 56722222 | 130.89 |
| Correlation coefficient between annual production and amount of loan | 0.99 |
Table text extracted from the original PDF; superscript letters are shown inline. The original table image is below.
View original table image
| Tea Estates | Average amount to be paid (Tk) | Amount Repaid (Tk.) | — | — | Repayment position (%) | — |
|---|---|---|---|---|---|---|
| Principal | Interest | Total | Repayment | Outstanding | ||
| M.R.Khan | 25000000 | 25000000 | 2588000 | 27588000 | 100 | -- |
| Amtoli | 45000000 | 45000000 | 4031000 | 49031000 | 100 | -- |
| Clonal | 11500000 | 11500000 | 197000 | 11697000 | 100 | -- |
| Sreebari | 70000000 | 70000000 | 5284000 | 75284000 | 100 | -- |
| Satgayon | 117000000 | 117000000 | 11142260 | 128142260 | 100 | -- |
| Julekhanagar | 53000000 | 53000000 | 7394000 | 60394000 | 100 | -- |
| Hossainabad | 18000000 | 18000000 | 2559068 | 20559068 | 100 | -- |
| Kederpur | 150000000 | 150000000 | 4768000 | 154768000 | 100 | -- |
| pallathal | 21000000 | 21000000 | 1634000 | 22634000 | 100 | -- |
| Average | 56722222 | 56722222 | 4399703 | 61121925 | 100 | -- |
Table text extracted from the original PDF; superscript letters are shown inline. The original table image is below.
View original table image
| Components of costs | Average cost of average amount of loan | Cost per hundred | Percentage of total transaction costs |
|---|---|---|---|
| Price of application loan form | 1725 | 0.003 | 1.00 |
| Stamps and revenue | 650 | 0.001 | 0.23 |
| Appraisal cost | 212689 | 0.370 | 76.60 |
| Travelling cost | 5556 | 0.009 | 2.00 |
| Opportunity cost (days lost) | 14556 | 0.026 | 5.24 |
| Cost of entertainment | 21635 | 0.038 | 7.43 |
| Trips and bribes | 20836 | 0.036 | 7.50 |
| Total | 277646 | 0.483 | 100 |
Table text extracted from the original PDF; superscript letters are shown inline. The original table image is below.
View original table image
References
10 in the original paper- Ahmed KM. Investment for Sustainable Development of Bangladesh Tea Industry. An Empirical Study [Internet]; c2012 [cited 2020 Aug 06]. Available from: https:/bea-bd.org/site/images/pdf/9.pdf
- Borah K, Das AK. Growth of Small tea cultivation and economic independence of the indigenous people in Assam. Int J Res Social Sci Humanities. 2015;5(1):8293.
- Islam GMR, Iqbal M, Quddus KG, Ali MY. Present Status and future needs of tea industry in Bangladesh. Proc Pakistan Acad Sci. 2005;42(4):305-314.
- Kiruthiga D, Damodaram K. Economics of Tea Cultivation in the Nilgiris district. EPRA Int J Agric Rural Econ Res. 2017;4(1):16-21.
- Raza SMS. Prospects and Challenges of Tea Industry in Bangladesh. Cost Manage. 2019;47(2):31-35.
- Saha JK, Gazi SU. Economics of mature tea cultivation under the management of Bangladesh Tea Board. Two and a Bud. 1994;41(2):40-43. Tea Research Association, Tocklai Experimental Station, Jorhat.
- Saha JK, Alam MF. Availability, utilization and repayment of tea loan in some selected tea estates of Bangladesh. J Rural Dev. 2008;35(1):149-161.
- Saha JK, Alam AFMB, Haque MW. Cost of production of tea in selected areas of Bangladesh. SAARC J Agric. 2007;5(1):23-31. SAARC Agricultural Information Centre, BARC Complex, Council, Farmgate, Dhaka www.extensionjournal.com 1215.
- Saha JK, Hussain MI, Hossain MA, Saha A. Cost of production of green leaf in some selected tea growers of Bangladesh. Planters' Chronicle. 2011;103(12):39-29. The United Planters' Association of Southern India, The Nilgiris, Tamil Nadu, India.
- Saha JK, Hoque MM, Roy P. Economy of Tea Production in Bangladesh. J Rural Dev. 2012;37(2):137-176.