
Research article · 2024 · Full text
International Journal of Research in AgronomyAssessing the climatic parameters in Vindhyan zone of Eastern Uttar Pradesh
Volume 7(6) · Pages 169–172 · DOI: 10.33545/2618060x.2024.v7.i6c.829 ↗
Research areasClimate variability and modelsClimate change impacts on agricultureHydrology and Drought Analysis
Abstract
Author-writtenThis paper examines long-term climatic data over a 21-year period (2000-2020) for the Vindhyan zone in Eastern Uttar Pradesh. The study focuses on seasonal and annual trends, standard deviation (SD), and coefficient of variation (CV). Weather data was collected from the Department of Agronomy at Banaras Hindu University in Varanasi, Uttar Pradesh. The data series was analyzed using MS Excel and Mann-Kendall software. Temperature and rainfall trends were assessed through linear regression analysis. The highest mean temperatures recorded were 35.5 ℃ during the summer season, 30.6 ℃ during the southwest monsoon, 28.9 ℃ during the post-monsoon season, and 22.9 ℃ during the winter season. The highest mean annual temperature, 31.93 ℃, was observed in 2015. For the lowest mean temperatures, seasonal variations were noted as follows: 19.9 ℃ in summer, 25.0 ℃ during the southwest monsoon, 16.6 ℃ in post-monsoon, and 10.1 ℃ in winter. The lowest mean annual temperature, 16.3 ℃, was recorded in 2002 in the Vindhyan zone of Uttar Pradesh.
Summary
Source-checkedPlain-language reading of the full paper, prepared with AI and checked against the text. Each point links to the authors' own words.
Why it matters
- Climate change affects both human and biological systems through various factors. View evidence ↗
- Changes in crop yields and their response to fertilizers necessitate updated crop management to avoid economic losses for farmers and environmental damage. View evidence ↗
- Future projections suggest an increase in the frequency of flooding, droughts, and heat stress. View evidence ↗
The question
- The study aims to examine annual and seasonal climatic trends, including standard deviation and coefficient of variation, in the Vindhyan zone of Eastern Uttar Pradesh from 2000 to 2020. View evidence ↗
What they did
- Weather data for the analysis was sourced from the Department of Agronomy at Banaras Hindu University in Varanasi. View evidence ↗
- The researchers used MS Excel, Mann-Kendall software, and linear regression analysis to assess rainfall and temperature trends. View evidence ↗
- The study categorized the year into four seasons: Winter (Dec-Feb), Summer (Mar-May), South-West Monsoon (Jun-Sep), and Post-monsoon (Oct-Nov). View evidence ↗
What they found
- Maximum mean temperatures varied by season, peaking at 35.5 ℃ in summer and reaching a low of 22.9 ℃ in winter. View evidence ↗
- Minimum mean temperatures ranged from a high of 25.0 ℃ during the southwest monsoon to a low of 10.1 ℃ in winter. View evidence ↗
- The highest recorded annual maximum mean temperature was 31.93 ℃ in 2015. View evidence ↗
- The lowest annual minimum mean temperature in the Vindhyan zone was 16.3 ℃, recorded in 2002. View evidence ↗
- Rainfall was highest during the southwest monsoon (800.58 mm) and lowest in the summer season (4.48 mm). View evidence ↗
- The maximum annual rainfall recorded during the study period was 1181.25 mm in 2001. View evidence ↗
- Annual maximum and minimum temperatures showed an increasing trend from 2000 to 2020, though this increase was not statistically significant. View evidence ↗
- Annual rainfall patterns showed indications of a decreasing trend over the last two decades, but the result was not statistically significant. View evidence ↗
Visual summary
3 visualsIllustrations explain the paper; charts are replotted from the paper's own table values.
Climatic Trend Summary
AI-generated conceptual illustration (The landscape of the Vindhyan zone in Eastern Uttar Pradesh, featuring semi-arid plains and scrub vegetation). It explains the idea and does not show study data.
View source evidence ↗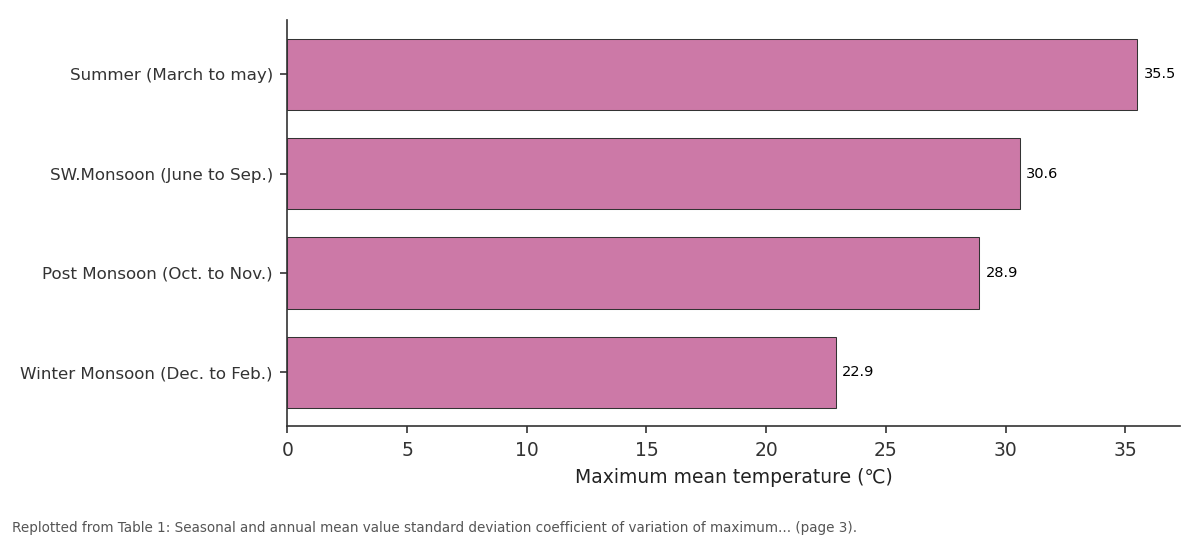
Temperature / Tmax / Mean: Summer (March to may) vs SW.Monsoon (June to... vs Post Monsoon (Oct. to... vs Winter Monsoon (Dec. to...
Replotted from Table 1 (page 3) of the original paper. Every bar is the paper's own table value.
View source evidence ↗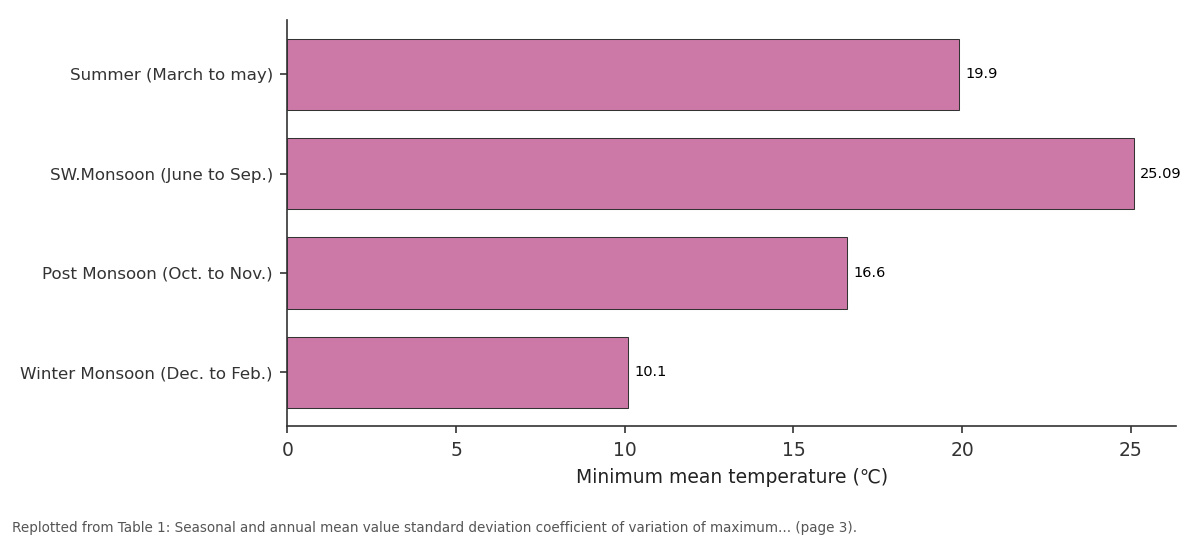
Tmin / Mean: Summer (March to may) vs SW.Monsoon (June to... vs Post Monsoon (Oct. to... vs Winter Monsoon (Dec. to...
Replotted from Table 1 (page 3) of the original paper. Every bar is the paper's own table value.
View source evidence ↗Figures & tables
From the original paper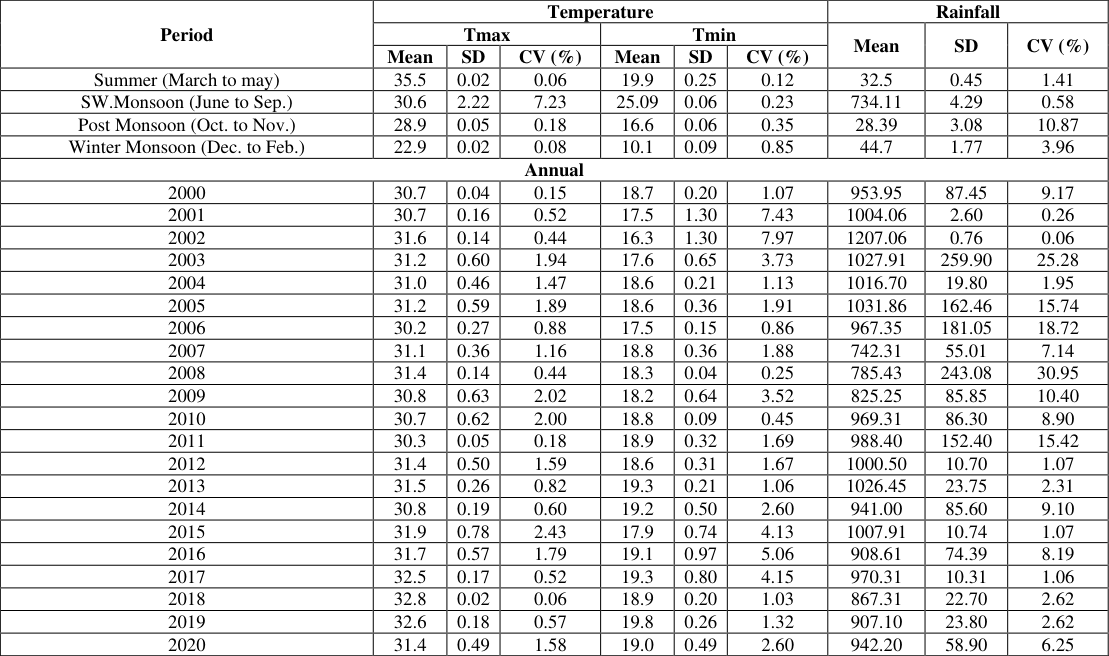 Table 1
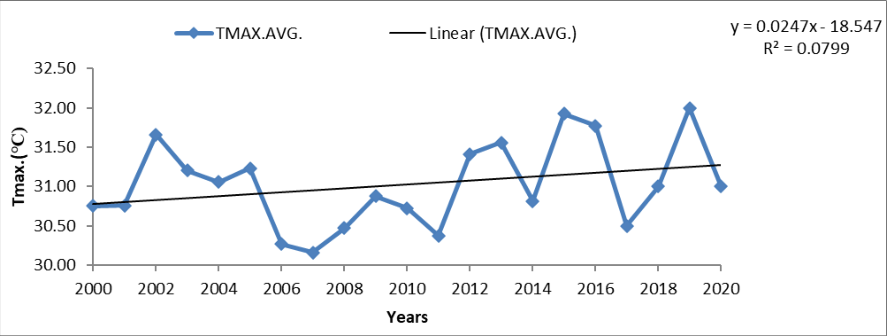 Figure 1
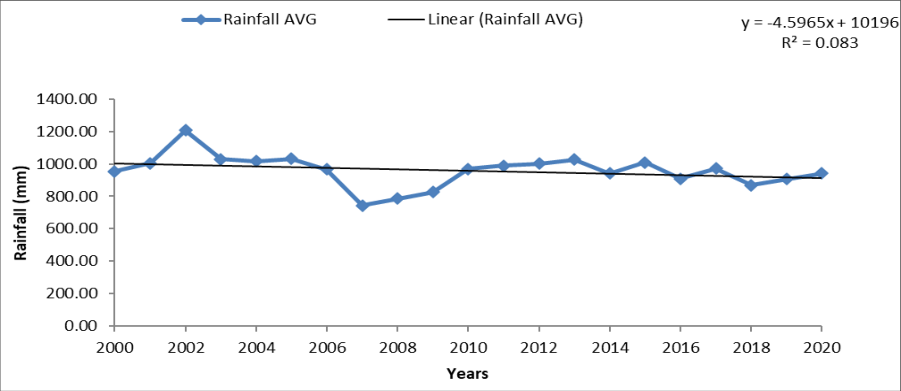 Figure 3
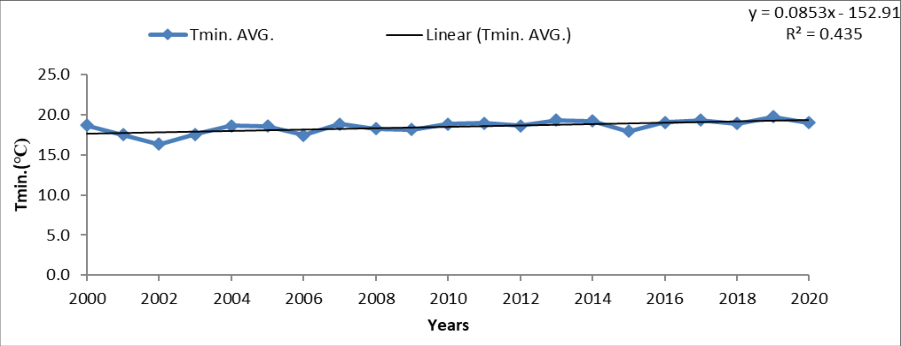 Figure 2
Introduction
Climate change encompasses various factors that impact both biological and human systems in diverse ways. The significant spatial variability of climate change effects has been extensively studied. Increases in global average temperatures obscure substantial differences in temperature rise between land and sea, as well as between high and low latitudes. It is highly likely that precipitation will increase in high latitudes, whereas decreases are expected in most tropical and subtropical land regions. Various tests were conducted to analyze climatic parameters, such as temperature and rainfall trends, using both parametric and non-parametric methods. Nonparametric tests are particularly advantageous as they can be applied to independent data sets and can tolerate outliers (Hamed and Rao, 1998). Variations in average yield levels and annual yield variability, along with changes in crop response to fertilizer inputs, require adaptations in crop management to prevent negative economic returns for farmers and environmental harm from imbalanced nutrient inputs. Climate change and variability are concerns both globally and nationally. Several questions need to be addressed to determine the nature of variability in significant weather events, particularly the amount of rainfall received in a season or year and its distribution within the season. It is widely anticipated that as the Earth's temperature rises, there will be an increase in climate and weather variability. Changes in the frequency and intensity of extreme climate events, as well as variability in weather patterns, will have significant implications for both human and natural systems. Projections indicate a rise in the frequency of heat stress, droughts, and flooding events throughout the remainder of this century, with numerous adverse effects expected beyond those resulting from changes in average variables alone. The 19th century witnessed a cooler climate period, followed by rapid global warming in the late 20th century. The temperature increase is also evident since there is a reduction in the total number of frost days in the mid-latitudes and an increase in the number of extreme warm days. Droughts have increased in tropical and subtropical regions since the 1970s. Decreasing precipitation over land, combined with rising temperatures and evapotranspiration, has led to drying and contributed to droughts in many areas.
The tropics are particularly impacted by these droughts. Numerous studies on rainfall trends have been conducted, including indications of rising precipitation in Australia (Suppiah and Hennessy, 1998) [4] and New York, USA (Burns et al., 2007) [1] . These examples illustrate the impacts of a mere 0.5°C cooling in annual mean temperature on society. Surface global temperatures increased during the 20th century, and inter annual climate variability has been observed in numerous regions worldwide. Events such as the El Niño occurrences of 1982/83 and 1997/98, as well as the 1991 Mt. Pinatubo volcanic eruption, led to significant variability in inter annual climate patterns in tropical regions during the late 20th century.
Materials and Method
In 2019, an experiment was conducted at Acharya Narendra Deva University of Agriculture & Technology in Kumarganj, Ayodhya (U.P.). Weather data from this period was collected from Banaras Hindu University in Varanasi. The collected data was then analyzed to observe past trends in rainfall, maximum temperature (T max), and minimum temperature (T min). The climate profile of the study area and the materials and methods used during the investigation are described in the following sections.
Season
Season
Maximum Temperature
The maximum temperature was measured by using mercury thermometer in max. Degree Celsius occurs the 2 to 4 o'clock.
Minimum Temperature
The minimum temperature was measured by using alcohol thermometer in mini. Degree Celsius occurs before sunrise.
Total rainfall
The rainfall is measured on daily basis, hence, its weekly, seasonal and annual totals are considered for analysis. Amongst the seasonal, total it is again sub-classified as monsoon season are crop growing season rainfall.
Trend analysis
Year-to-year variability in climatic conditions may obscure gradual transitions from one regime to another. Statistical methods, including moving averages, frequency distribution, and stepwise regressions, were utilized to investigate climatic trends. Historical data on weather parameters particularly rainfall and temperature, in the Vindhyan region of Eastern Uttar Pradesh, were collected for analysis. The data covered the period from 2000 to 2020, contingent upon data availability. Climatic variability and weather trend analyses were conducted based on this historical data, encompassing both past observations and projections for the future.
Standard Deviation
Standard deviation of maximum, minimum temperature and rainfall has been calculated over seasonal and annual basis by using the expression Where, X= Rainfall frequency, = Mean Rainfall, n = No. of years.
Coefficient variation
Coefficient of variation (CV) of maximum, minimum temperature, and rainfall has calculated over seasonal and annual basis by using the expression.
CV% = (SD/Mean) x 100
The net change in rainfall amount and temperature was estimated using sub-division-wise data for rainfall and regionwise data for temperature. The areal average method (Sen, 1998) [5] was employed to calculate the net change, categorizing it as positive significant, positive non-significant, negative significant, or negative non-significant for both rainfall and temperature in relation to the area. The overall net change in the climate of the entire study area was determined by calculating the difference between the total positive and total negative values of the monthly, seasonal, and annual data.
Results and Discussion
An analysis of annual and seasonal temperature trends from 2000 to 2020, as well as annual & seasonal temperature and rainfall trends from 2000 to 2020, was conducted for the Vindhyan zone of Eastern Uttar Pradesh.
Seasonal & annual temperature (maximum & minimum) variability
The seasonal variation of maximum mean temperatures was observed as follows: 35.5 ℃ in the summer season, 30.6 ℃ during the southwest monsoon, 28.9 ℃ in the post-monsoon season, and 22.9 ℃ in the winter season. The standard deviation (SD) for maximum temperatures was 0.02 in summer, 2.22 during the southwest monsoon, 0.05 in the post-monsoon season, and 0.02 in winter. The coefficient of variation (CV) for maximum temperatures was 0.06% in summer, 7.23% during the southwest monsoon, 0.18% in the post-monsoon season, and 0.08% in winter. The seasonal variation of minimum mean temperatures was recorded as 19.9 ℃ in the summer season, 25.0 ℃ during the southwest monsoon, 16.6 ℃ in the postmonsoon season, and 10.1 ℃ in the winter season. The standard deviation for minimum temperatures was 0.25 in summer, 0.06 during the southwest monsoon, 0.06 in the post-monsoon season, and 0.09 in winter. The coefficient of variation for minimum temperatures was 0.12% in summer, 0.23% during the southwest monsoon, 0.35% in the post-monsoon season, and 0.85% in winter. The highest maximum mean temperature of 31.93 ℃ was recorded in 2015, with the highest standard deviation of 0.78 and the highest coefficient of variation of 2.43% also occurring in 2015. The lowest minimum mean temperature of 16.3 ℃ was recorded in 2002 in the Vindhyan zone of Uttar Pradesh. Similarities in monsoonal and annual trends were also observed in the recent work of Pingale et al. (2014) [2] in the state of Rajasthan, India. A significant rise in maximum temperature in the Western Himalayas indicates the warming of this cold region. Similar findings were observed in the work of Pal and Al-Tabbaa (2010) [3] .
Seasonal & annual temperature rainfall variability
Seasonal & annual temperature rainfall variability
Trends annual maximum and minimum temperature
To understand climate variability and change during the period from 2000 to 2020, the analysis focused on recognizing recent trends in the variation of each climatic parameter, including maximum and minimum temperatures and total rainfall.
The trend analysis of annual maximum & minimum temperature revealed an increasing trend throughout the period from 2000 to 2020, (Fig. 1 & 2). However, none of these trends were statistically significant.
Conclusion
The study conducted an analysis of annual and seasonal temperature trends from 2000 to 2020, alongside annual and seasonal rainfall trends, focusing on the Vindhyan zone of Eastern Uttar Pradesh. Seasonal variations in maximum mean temperatures were observed across different seasons, ranging from 35.5 ℃ in summer to 22.9 ℃ in winter, with corresponding standard deviations and coefficients of variation for each season. Similarly, seasonal variations in minimum mean temperatures were recorded, with corresponding standard deviations and coefficients of variation. The highest maximum mean temperature and lowest minimum mean temperature were recorded in specific years. Seasonal rainfall exhibited variability, with notable coefficients of variation and standard deviations, highlighting the variability in rainfall patterns across seasons and years. In order to comprehend climate variability and change during the period from 2000 to 2020, the analysis focused on identifying recent trends in each climatic parameter, including maximum and minimum temperatures and total rainfall. The trend analysis of annual maximum and minimum temperatures indicated an increasing trend throughout the period, although statistically significant trends were not observed. Similarly, the trend analysis of annual rainfall suggested alterations in the normal annual rainfall pattern over the last two decades, with indications of decreasing trends. However, these trends were not statistically significant.
Figures and tables from the paper
| Period | Temperature | — | — | — | — | — | Rainfall | — | — |
|---|---|---|---|---|---|---|---|---|---|
| Tmax | Tmin | Mean | SD | CV (%) | |||||
| Mean | SD | CV (%) | Mean | SD | CV (%) | ||||
| Summer (March to may) | 35.5 | 0.02 | 0.06 | 19.9 | 0.25 | 0.12 | 32.5 | 0.45 | 1.41 |
| SW.Monsoon (June to Sep.) | 30.6 | 2.22 | 7.23 | 25.09 | 0.06 | 0.23 | 734.11 | 4.29 | 0.58 |
| Post Monsoon (Oct. to Nov.) | 28.9 | 0.05 | 0.18 | 16.6 | 0.06 | 0.35 | 28.39 | 3.08 | 10.87 |
| Winter Monsoon (Dec. to Feb.) | 22.9 | 0.02 | 0.08 | 10.1 | 0.09 | 0.85 | 44.7 | 1.77 | 3.96 |
| Annual | |||||||||
| 2000 | 30.7 | 0.04 | 0.15 | 18.7 | 0.20 | 1.07 | 953.95 | 87.45 | 9.17 |
| 2001 | 30.7 | 0.16 | 0.52 | 17.5 | 1.30 | 7.43 | 1004.06 | 2.60 | 0.26 |
| 2002 | 31.6 | 0.14 | 0.44 | 16.3 | 1.30 | 7.97 | 1207.06 | 0.76 | 0.06 |
| 2003 | 31.2 | 0.60 | 1.94 | 17.6 | 0.65 | 3.73 | 1027.91 | 259.90 | 25.28 |
| 2004 | 31.0 | 0.46 | 1.47 | 18.6 | 0.21 | 1.13 | 1016.70 | 19.80 | 1.95 |
| 2005 | 31.2 | 0.59 | 1.89 | 18.6 | 0.36 | 1.91 | 1031.86 | 162.46 | 15.74 |
| 2006 | 30.2 | 0.27 | 0.88 | 17.5 | 0.15 | 0.86 | 967.35 | 181.05 | 18.72 |
| 2007 | 31.1 | 0.36 | 1.16 | 18.8 | 0.36 | 1.88 | 742.31 | 55.01 | 7.14 |
| 2008 | 31.4 | 0.14 | 0.44 | 18.3 | 0.04 | 0.25 | 785.43 | 243.08 | 30.95 |
| 2009 | 30.8 | 0.63 | 2.02 | 18.2 | 0.64 | 3.52 | 825.25 | 85.85 | 10.40 |
| 2010 | 30.7 | 0.62 | 2.00 | 18.8 | 0.09 | 0.45 | 969.31 | 86.30 | 8.90 |
| 2011 | 30.3 | 0.05 | 0.18 | 18.9 | 0.32 | 1.69 | 988.40 | 152.40 | 15.42 |
| 2012 | 31.4 | 0.50 | 1.59 | 18.6 | 0.31 | 1.67 | 1000.50 | 10.70 | 1.07 |
| 2013 | 31.5 | 0.26 | 0.82 | 19.3 | 0.21 | 1.06 | 1026.45 | 23.75 | 2.31 |
| 2014 | 30.8 | 0.19 | 0.60 | 19.2 | 0.50 | 2.60 | 941.00 | 85.60 | 9.10 |
| 2015 | 31.9 | 0.78 | 2.43 | 17.9 | 0.74 | 4.13 | 1007.91 | 10.74 | 1.07 |
| 2016 | 31.7 | 0.57 | 1.79 | 19.1 | 0.97 | 5.06 | 908.61 | 74.39 | 8.19 |
| 2017 | 32.5 | 0.17 | 0.52 | 19.3 | 0.80 | 4.15 | 970.31 | 10.31 | 1.06 |
| 2018 | 32.8 | 0.02 | 0.06 | 18.9 | 0.20 | 1.03 | 867.31 | 22.70 | 2.62 |
| 2019 | 32.6 | 0.18 | 0.57 | 19.8 | 0.26 | 1.32 | 907.10 | 23.80 | 2.62 |
| 2020 | 31.4 | 0.49 | 1.58 | 19.0 | 0.49 | 2.60 | 942.20 | 58.90 | 6.25 |
Table text extracted from the original PDF; superscript letters are shown inline. The original table image is below.
View original table image
References
5 in the original paper- Burns DA, Klaus J, McHale MR. Recent climate trends and implications for water resources in the Catskill Mountain region, New York, USA. Journal of Hydrology. 2007;336:155-170.
- Pingale SM, Khare D, Jat MK, Adamowski J. Observed spatial and temporal trends of mean and extreme rainfall and temperature for 33 urban centers in the arid and semiarid state of Rajasthan, India. Atmospheric Research. 2014;138:73-90.
- Pal I, Al-Tabbaa A. Long-term changes and variability of monthly extreme temperatures in India. Theoretical and Applied Climatology. 2010;100:45-56.
- Suppiah R, Hennessy KJ. Trends in total rainfall, heavy rain events and number of dry days in Australia, 1910-1990. International Journal of Climatology. 1998;10:1141-1164.
- Sen Z. Average areal precipitation by percentage weighted polygon method. Journal of Hydrologic Engineering. 1998;3(1):69-72.