
Research article · 2024 · Full text
International Journal of Research in AgronomyAllelopathic effect of tree grows on dry matter accumulation and yield of green-gram crop in northern transitional zone of Karnataka
Volume 7(6S) · Pages 84–89 · DOI: 10.33545/2618060x.2024.v7.i6sb.814 ↗
Research areasAllelopathy and phytotoxic interactionsPlant Parasitism and ResistanceSeed Germination and Physiology
Abstract
Author-writtenField experiments were conducted to study the allelopathic effect of teak and casuarina tree rows on greengram in kharif season for two consecutive years. Looking to all the crop growth and yield parameters in both sites the greengram performance was poor outside cement ring compared to inside cement ring. Growth and yield of greengram ICR was better than OCR over the distances whereas OCR the growth and yield was the poorest in 0-3m and got nullified after 9m in casuarina and 12 m in teak.
Summary
Source-checkedPlain-language reading of the full paper, prepared with AI and checked against the text. Each point links to the authors' own words.
Why it matters
- Agroforestry is a land-use system that integrates the simultaneous production of crops and forest or fruit trees on the same piece of land. View evidence ↗
- The performance of crops in agroforestry systems is determined by both competition for physical resources and the effects of allelochemicals released by trees. View evidence ↗
- Casuarina equisetifolia is a common agroforestry tree, but it has been observed to negatively impact nearby agricultural crops. View evidence ↗
The question
- The study aimed to determine how rows of teak and casuarina trees affect the performance of greengram crops. View evidence ↗
What they did
- Field experiments were conducted over two kharif crop seasons from 1998 to 2000 at a farmer's field. View evidence ↗
- The study used established tree rows consisting of 12-year-old casuarina and 20-year-old teak. View evidence ↗
- Treatments involved measuring crop performance at 3-meter intervals from the tree row, ranging from 0-3 meters up to 15-18 meters. View evidence ↗
- To isolate the effects of roots, cement rings 90 cm deep and 60 cm wide were inserted into the soil at the same distance intervals. View evidence ↗
- Researchers measured growth parameters every 15 days and recorded seed weight, grain yield, and stover yield at harvest. View evidence ↗
What they found
- Greengram grown outside cement rings (OCR) had significantly lower plant dry matter at 15 days after sowing compared to those grown inside rings (ICR). View evidence ↗
- In casuarina rows, total dry matter was reduced by 15.45% at 6-9 meters and by 23.29% at 0-3 meters from the tree row. View evidence ↗
- For teak rows, the thousand seed weight was significantly lower for crops outside the cement rings (28.65 g) than for those inside (37.90 g). View evidence ↗
- Grain yield in teak rows was significantly lower outside the cement rings (465.75 kg/ha) compared to inside the rings (602.17 kg/ha). View evidence ↗
- In casuarina rows, grain yield was significantly higher at 15-18 meters (607 kg/ha) than at 0-3 meters (489 kg/ha). View evidence ↗
- In casuarina rows, yield reduction in OCR compared to ICR was most severe at 0-3 meters (36.01%) and became negligible beyond 12 meters. View evidence ↗
- The harvest index for casuarina rows was highest at 15-18 meters (24.10) and lowest at 0-3 meters (21.45). View evidence ↗
What it means
- The authors conclude that the reduction in growth and yield parameters near tree rows is due to a combination of allelopathic effects and resource competition. View evidence ↗
- The study suggests that excluding tree roots (as demonstrated by the cement rings) can mitigate the adverse effects of trees on associated crops. View evidence ↗
Visual summary
3 visualsIllustrations explain the paper; charts are replotted from the paper's own table values.
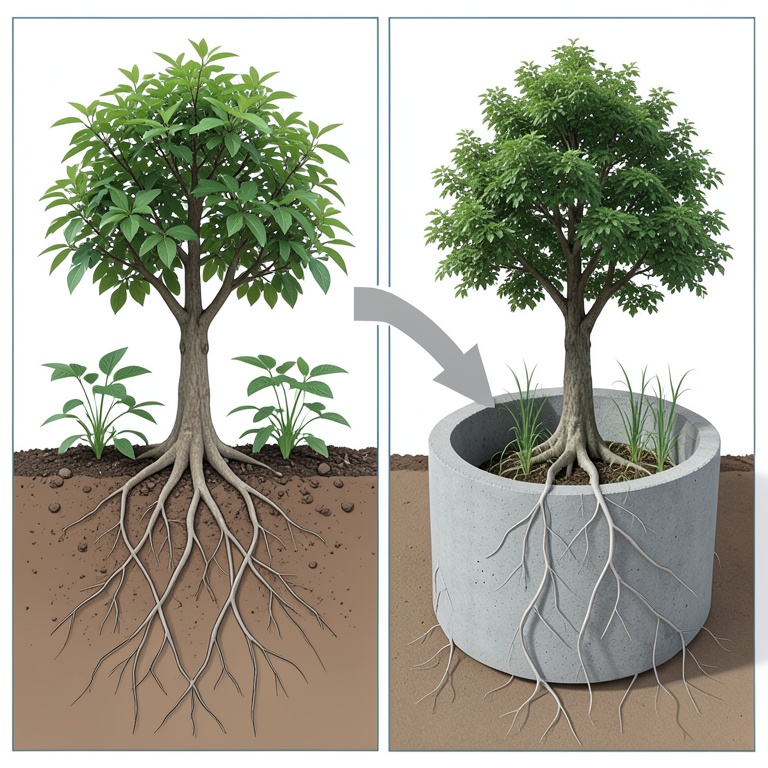
Root Exclusion Concept
AI-generated conceptual illustration (green-gram plants and a tree in soil). It explains the idea and does not show study data.
View source evidence ↗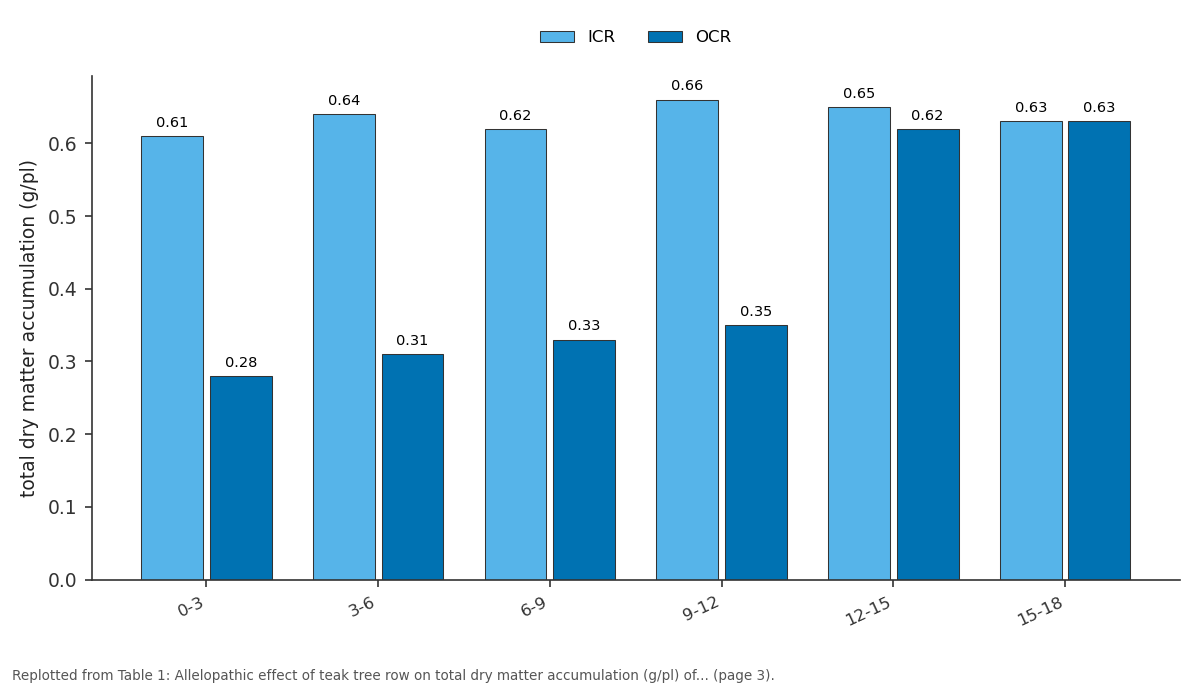
ICR and OCR: 0-3 vs 3-6 vs 6-9 vs 9-12 vs 12-15
Replotted from Table 1 (page 3) of the original paper. Every bar is the paper's own table value.
View source evidence ↗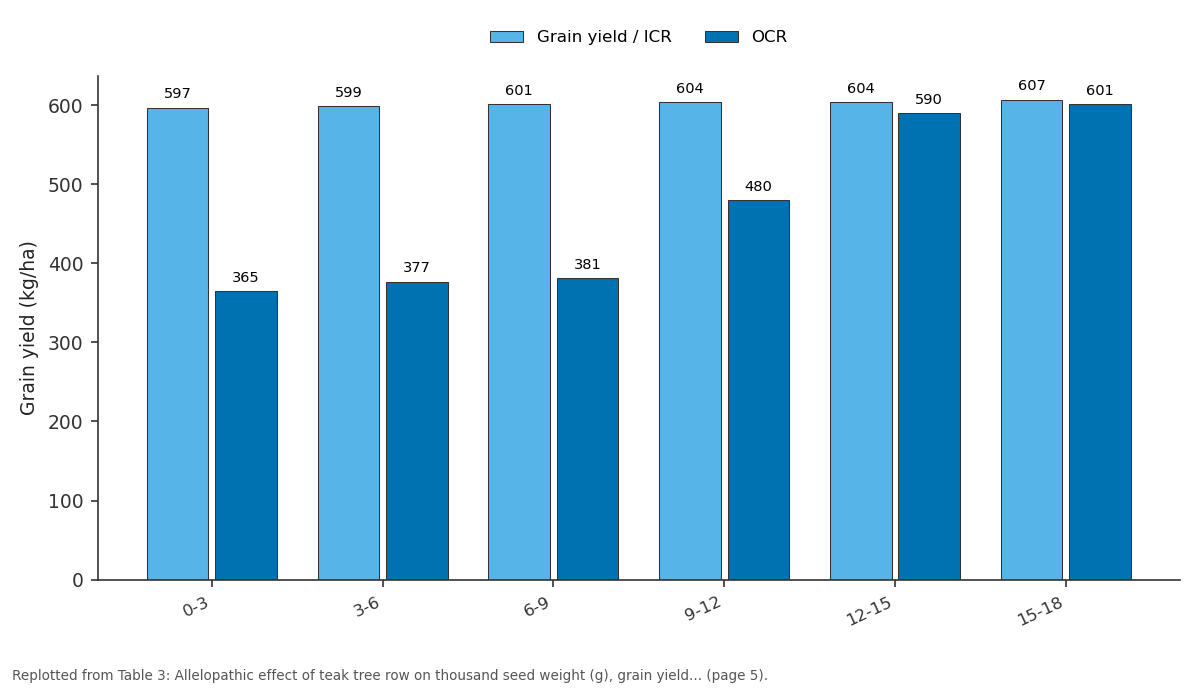
Grain yield / ICR and OCR: 0-3 vs 3-6 vs 6-9 vs 9-12 vs 12-15
Replotted from Table 3 (page 5) of the original paper. Every bar is the paper's own table value.
View source evidence ↗Figures & tables
From the original paper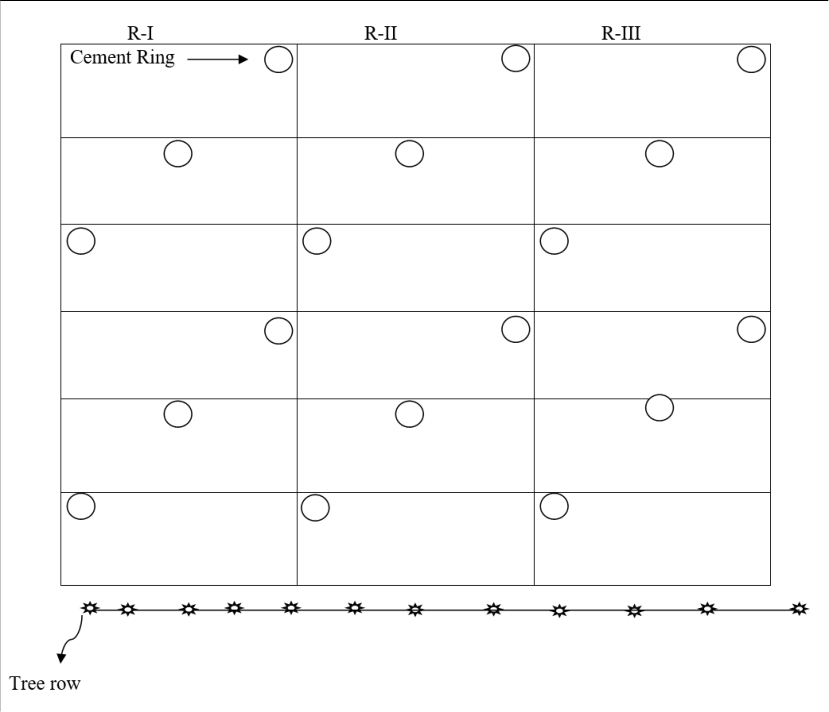 Figure 1
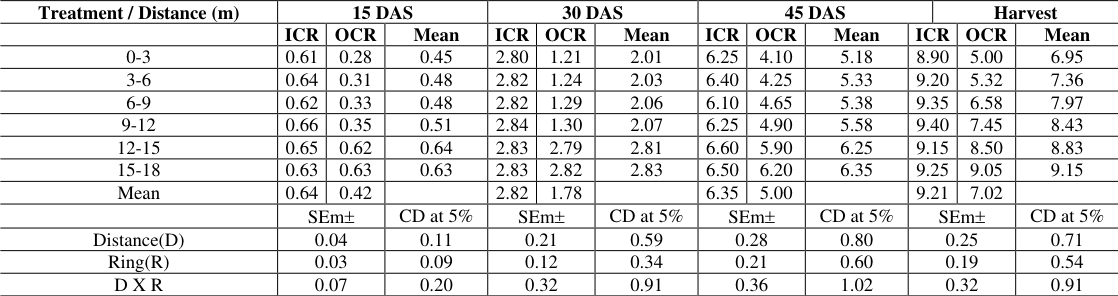 Table 1
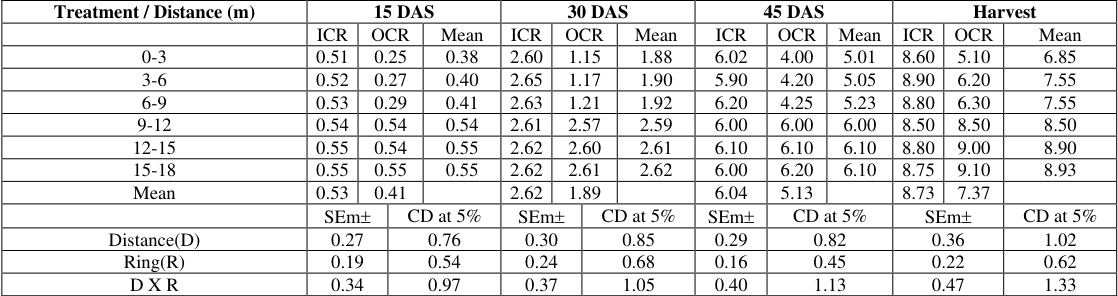 Table 2
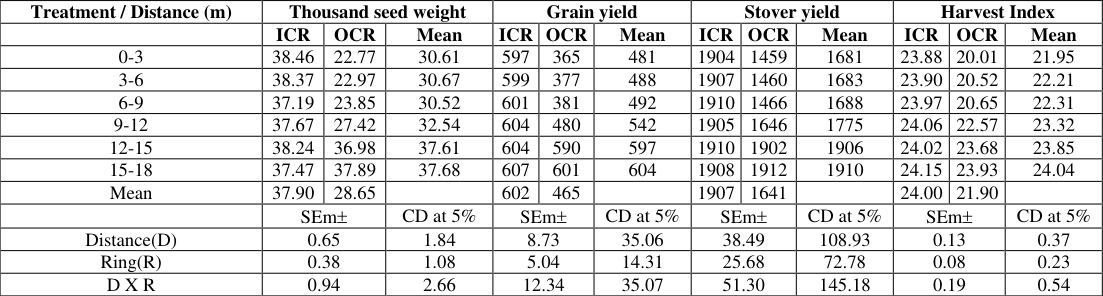 Table 3
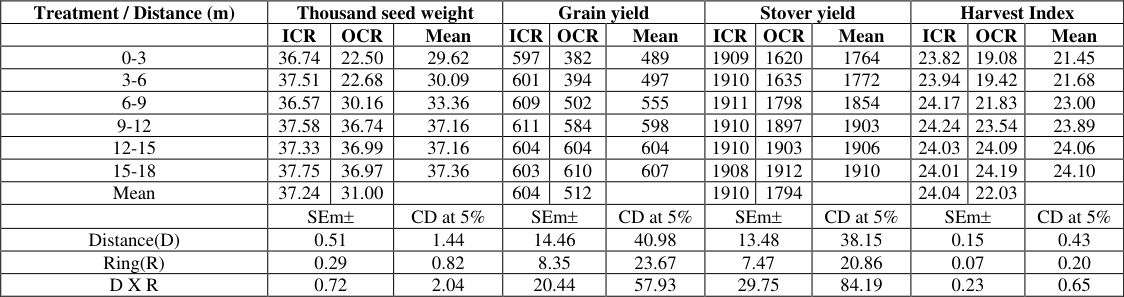 Table 4
Introduction
Trees were grown in agricultural land since generations the research efforts to improve the system have been initiated quite recently. Agroforestry combines the production of crops and forest/fruit trees simultaneously on the same unit of land and applies management practices compatible with the local cultural practices (King and Chandler, 1998) [6] . Trees which are recommended for an agroforestry system ought to have some specific characters such as fast growth rate, good forage, food and wood value, morphology-which should permit the penetration of light to the ground etc. Among the trees recommended for agroforestry programme, multipurpose nitrogen fixing trees are seen as ideal as they contribute to the overall productivity and help to stabilize and enrich the soil. Agroforestry system having many advantages by growing in field crops as shade, timber, fodder, fruits, fuel etc. Inspite proper studies have not been done to see their impacts on agricultural crops. However, the systematic research to improve the productivity of agroforestry systems (growing tree species with arable crops) has been initiated in last three decades. In agroforestry systems, tree-crop interactions are very important but they are quite complex in nature (Tripathi et al 1998) [19] . It is known that not only the competition for physical growth resources but also the interactions of allelochemicals released from the tree and their parts in agroforestry (Chandrashekaraiah, 1986) [2] systems determine the performance of associated crops. This phenomenon of interference (allelopathy+competition) explains the effect of one plant on other plants and/or microorganisms through release of chemicals and their break down metabolites (Wiilis, 1994). With the increased recognition of agroforestry as an alternative land use system, many scientists have focused attention on trees (Palmberg, 1980) [10] . Trees produce a large quantity of litter resulting in production or release of numerous chemicals or organic compounds in to the soil affecting the growth of understorey crops (Tripathi et al, 1998) [19] . Casuarina (Casuarina equisetifolia), is a important tree species grown in agroforestry systems. This tree was noticed to have adverse effects on adjacent agricultural crops. Lack of greengram growth under casuarina was noticed even though light, moisture and nutrients were adequate and was attributed to allelopathic properties (Jadhav and Gaynar, 1995) [5] . In India most of the investigations are based on bioassay studies (Melkania, 1984) [7] and very less successful attempts have been made to confirm allelopathic action in field conditions. Hence, this study was undertaken as a part of Ph D research on teak and casuarina based agroforestry system with greengram to determine the effect of teak and casuarina tree row on the performance of greengram.
Materials and Methods
Field experiments were carried out during two crop seasons (1998-99 and 1999-2000 kharif) at farmer's field. The field was 12 km away from the UAS campus and is situated on Dharwad-Savadatti state highway. The mean annual rainfall of the area was 800 mm. The soil contained 42, 19 and 37% sand, silt and clay respectively, and had field capacity of 27% and bulk density of 1.42.
Field Study: An established 12 years old casuarina tree row and 20 years old teak tree row. Casuarina tree row was aligned in north-south direction, whereas, teak tree row was aligned in East-West was selected. The treatments consisted of varying distances viz., 0-3, 3-6, 6-9, 9-12, 12-15 and 15-18 (T 1 & T 6 ) at 3 m intervals from tree row up to 18 m. The treatment begins at one meter from tree row. In each interval, plot size of 3 m X 8 m size was made. The T 7 to T 12 treatments consisted of cement rings (90 cm deep & 60 cm wide) inserted in to the fields to a depth of 90 cm serially from T 1 to T 6 at 3 rd , 6 th , 9 th , 12 th , 15 th and 18 th m in the plots. The treatments replicated three times using two-factor randomized complete block design. Cement rings were inserted in to the soil by digging pits exposing the soil to sunlight for three weeks and again refilled it profile-wise. The rings were filled with soil and leveled to the soils surface outside the ring. Rings were inserted in to the soil to prevent the interference of tree roots for moisture and nutrients and senescent leaves falling within the rings were removed regularly to overcome allelopathic effect of litter leachates. In all the treatments (T 1 to T 12 ) greengram (variety Chinamung) was sown in 30 X 10 cm spacing @15-20 kg seed rate and fertilizer doze 50: 25 kg N: P 2 O 5 per hectare. Entire quantity of fertilizer doze was applied as basal dose. During 1999-2000 the crop was irrigated at 30 days after sowing (DAS) to overcome moisture deficiency. The crop was sown on 14 th and 16 th of June and 1998 and 1999 respectively in casuarinas tree location while on June 12 th 1998 and June 20 th 1999 in teak tree row location. During the crop growth period observations viz., crop emergence, plant height, number of leaves, dry matter accumulation in leaves, stem and total was recorded at 15 days interval till harvest, number of branches per plant and dry matter accumulation in reproductive parts at 45 DAS and at harvest. The thousand seed weight, number of pods per plant, length of pod seeds per pod, seeds per plant, grain yield and stover yield were recorded at harvest. The data was statistically analysed using two factor randomized complete block design.
Results and Discussion
All the results varied significantly. The drymatter accumulation in greengram was recorded significantly lower at 0-3 m spacing and it increases going away from the tree row. Outside cement ring (OCR) the crop was directly affected by root leachate as compared to inside cement ring (ICR). As the inside cement ring was not affected by roots or its leachates. Outside cement ring recorded significantly lower plant dry matter at 15 DAS (0.42, 1.78, 5.0 & 7.02 g/pl) compared to ICR (064, 2.82, 6.35 & 9.21 g/pl). Similar trend was also observed in casuarina tree row, the drymatter accumulation of greengram was significantly lower nearer the tree row as 0-3 m (0.38 g/pl), 3-6 m (0.40 g/pl) and 6-9m (0.41 g/pl)and afterwards the drymatter accumulation was at par with 15-18 m. Reduction in total drymatter was between 15.45 (6-9 m) to 23.29 (0-3 m) percent.And the similar trend was recorded at later plant growth stages. The dry matter accumulation outside cement ring recorded significantly lower dry matter accumulation of greengram compared to ICR. Reduction in dry matter accumulation was reduced till 9.0 m from the tree row. At the time of harvest, total drymatter reduction was between 7.87-24.04 percent at 3-12 m distance Onyewotu and Stigter (1995) [9] studied on eucalyptus shelterbelts and reported that most of the tree roots were distributed in the top 70 cm of soil and consisted of fine roots, which reached as far as 18m from the shelterbelt. Grewal (1995) [4] reported that eucalyptus consumed about 29 percent more water from the soil profile than field crops. Organic carbon, available P 2 O 5 and K 2 O levels in soils immediately adjacent to the tree line were less than those at 2.7m and 5.4m from the tree line (Nadagouda, 1990) [8] . At Bellary, Karnataka state. Acacia nilotica caused greater yield reduction in rabi sorghum and safflower than eucalyptus and the reduction was attributed to the competition for moisture, which increased with age (Srivastava, 1983) [16] .
Teak
Thousand seed weight: Thousand seed weight was significantly lower at 0-3 m (30.61) distance and increased with increase in distance, the highest being recorded at 15-18m distance (37.68). It was significantly lower till 12m distance. Thousand seed weight OCR (28.65) was significantly lower than ICR (37.90). At various distances ICR plants recorded significantly higher thousand seed weight than OCR except at 12-15 and 15-18m where they were on par with each other. Thousand seed weight were reduced by 13.64-19.00 percent till 12 m distance from tree row. When compared to ICR, OCR the thousand seed weight were reduced by 24.41 percent Grain yield: Grain yield at 0-3 m (481.17) was the lowest and was on par with 3-6m (488.08) and 6-9m (491.67). Till 12m (541.75 at 9-12m) significantly lower grain yield was recorded than at 15-18m (608.05) which was on par with 12-15m (597). The grain yield was significantly lower OCR (465.75) than ICR (602.17). Averaging the grain yield over the ICR and OCR, it was reduced by 22.76 percent OCR and thousand seed weight was reduced by 24.41 percent. The grain yield reduction varied between 10.26 to 20.36 percent from tree row to till 12 m distance and thousand seed weight were reduced by 13.64-19.00 percent.
Inside the rings at various distances the grain yield was on par with each other and were significantly higher than those recorded OCR except at 12-15 and 15-18m where they were on par with each other. When comparisons were made between the crop grown inside cement ring and outside cement ring, it was found that the crop performed better ICR than OCR. Averaging the grain yield over the ICR and OCR, it was reduced by 22.76 percent OCR. The study of Dhushan and Lakshminarayan (1995) [3] indicated that plant stand and growth of pearlmillet and clusterbean plants were poor in the vicinity of Acacia nilotica and were markedly inhibited upto 7.5 m. Nadagouda (1990) [8] also reported reduction in groundnut yield to the extent of 20.40 percent by four years old teak trees. The eucalyptus shelter belt study made by Oneywotu and Stighter (1995) [9] showed that in the case of un-pruned trees, millet yields were poor till 18 m whereas in the case of roots pruned treatment millet yields were much higher at 6 and 18 m distance from shelter belt. Panneerselvam et al. (1998) [12] Concluded that aqueous extracts of root and fully mature leaf leachate of Tectona grandis reduced the shoot length, root length, leaf area and chlorophyll content of peanut and maize seedlings. The maximum content of phytotoxins was found at one meter distance from the tree line (eucalyptus) for all depths. Studies have shown presence of allelo-chemicals with varied concentration in different plant parts. The plant extracts of teak contained phenolic compounds like P-chlorogenic acid, coumaric acid, ferulic acid and also glycosides and their concentration was in the order of root>leaves>soil (Singh and Kohli, 1992 ; Tripathi et al., 1999) [14,20] . Thus it is clear from the studies made on competition for natural resources between tree-crop, there has not been significant competition for moisture, light and nutrients so allelopathic interference may be one of the factors for reduction in crop growth and yield components. Yekkeli (1999) [21] found that the greengram grown in soils collected from 0-3, 3-6, 6-9, 9-12, 12-15 and 15-18 m eucalyptus indicated in soil nearer tree had more detrimental effect than at farther distance soils and they attributed the adverse effect to the allelopathic effect. Patil (1999) [11] found that crops grown in soils collected from 3,6,9,12,15 and 18m away from eucalyptus, teak and casuarina had indicated more detrimental effect on soils nearer the tree than at farther distance. This adverse effect was attributed to the allelopathic effect as one of the factor.
Stover yield
Stover yield responded similar to that of grain yield wherein significantly the lowest yield was recorded at 0-3 m (1681) distance and was on par with 3-6, 6-9, and 9-12m. The yield at 12-15 (1906) and 15-18m (1910) was on par with each other and significantly higher than other distances. Significantly lower stover yield was recorded OCR (1641) than at ICR (1907). ICR crop recorded stover yield on par at various distances and was significantly higher than those recorded OCR except at 12-15 and 15-18m where they were on par with each other.
Harvest index
Significantly lower harvest index was recorded at 0-3 m (21.95) and higher at 15-18m distance (24.04). Till 12m the harvest index was lower than that recorded at 15-18m distance. Outside cement ring recorded significantly lower (21.90) harvest index than inside ring (24). At various distances the harvest index recorded ICR were on par with each other and were significantly higher than those recorded outside cement ring except at 12-15 and 15-18m distances.
Casuarina
Thousand seed weight: Significantly lower thousand seed weight was recorded at 0-3 m (29.62) and till 9m there was significantly lower thousand seed weight than 15-18m (37.36). ICR recorded significantly higher thousand seed weight (37.24) than OCR (31.00). The overall reduction in thousand seed weight in OCR than ICR were 16.76 percent, At various distances ICR test weight was on par and were significantly higher than outside cement ring till 9m and then onwards they were on par.
Grain yield:
The grain yield of greengram recorded at 15-18m (607) was significantly higher. Comparing with this the grain yield at 0-3 m (489) was significantly lower. Then onwards there was increase in yield by moving away from tree row and till 9m significantly lower yield was recorded compared to 15-18m. The grain yield recorded at 9-12 and 12-15m were on par with 15-18m. The percent yield reduction of greengram in casuarina was 19.44, 18.12, 8.57, 1.48 and 0.49 percent at 0-3, 3-6, 6-9, 9-12 and 12-15 m, respectively This indicated that the reduction in grain yield was up to 9 m in casuarina to an extent of 8.57-19.44 percent. The grain yield reduction was 8.57, 18.12 and 19.44 percent at 6-9, 3-6 and 0-3 m from tree row. This showed that the crop performed poor under casuarina tree till 9m. The percent yield reduction of greengram in casuarina was 19.44, 18.12, 8.57, 1.48 and 0.49 percent at 0-3, 3-6, 6-9, 9-12 and 12-15 m, respectively. This indicated that the reduction in grain yield was up to 9 m in casuarina to an extent of 8.57-19.44 percent. Outside cement rings recorded significantly lower grain yield (512) than ICR (604). The interaction of the partitioning effect recorded almost on par grain yield at various distances ICR whereas OCR plants recorded significantly lower grain yield till 9m and the rest of distances recorded grain yield on par with ICR. The crop yield reduction in OCR compared to ICR at 0-3, 3-6, 6-9 and 9-12 m was to the extent of 36.01, 34.44, 17.57 and 4.42, respectively and beyond 12 m the yields were on par with ICR. The findings of Swaminathan et al. (1998) [18] showed decline in vegetable crop yield from 49.6 quintals per hectare to 0.8 quintals per hectare at the end of 6 th year when vegetables were grown under the casuarina trees. Story (1967) [17] reported lack of herbaceous growth under casuarina species. The 20-year-old Eucalyptus tereticornis tree line planted on the farm boundary reduced crop yields upto 10 m in case of greengram, upto 5 m in blackgram and only upto 2.0 m in sorghum (Srivastava and Narain, 1980) [15] . Patil (1999) [11] reported significantly lower wheat yield till 9m from casuarina tree row and Yekkeli (1999) [21] reported significantly lower yield of greengram till 12m from eucalyptus tree row. Allelopathic effect is one of the factors for adverse effect. Jadhav and Gaynar (1995) [5] reported that leaf leachates of Casuarina equisetifolia significantly affected germination and drymatter production in rice and cowpea. Rice was more sensitive than cowpea. Singh (1993) [13] concluded that the leaf leachates of casuarina inhibited radicle length and panicle length of sorghum, sunflower and cowpea. Batish et al. (1998) [1] opined that the vegetation under 14 years old plantations of casuarina was affected compared to the vegetation at adjoining areas.
Stover yield
Similar to that of grain yield, stover yield (kg/ha) was significantly higher at 15-18m (1910) with lowest being at 0-3 m (1764). The distances 9-12 and 12-15m were on par with 15-18m and were significantly higher in stover yield than other distances. The partitioning of underground crop growth resources showed significantly lower stover yield recorded OCR (1794) than ICR (1910). Interaction of these two factors showed on par stover yield ICR at various distances. Whereas OCR till 9m the stover yield was significantly lower whereas with respect to other distances they were on par with ICR.
Harvest index
Significantly higher harvest index was recorded at 15-18m (24.10) than any other distance and significantly lower at 0-3 m (21.45). The harvest index was significantly lower till 9m. Outside cement ring recorded significantly lower (22.03) harvest index than ICR (24.04). Interaction showed that harvest index was on par ICR at various distances and were significantly higher than OCR till 9m and the rest were on par.
Conclusion
In conclusion, the study revealed significant variations in the growth and yield parameters of greengram and casuarina trees at different distances from tree rows and within and outside cement rings. The dry matter accumulation, thousand seed weight, grain yield, stover yield, and harvest index were all influenced by proximity to the tree row and the presence of cement rings. Notably, closer distances to the tree row exhibited lower values for these parameters, indicating the impact of allelopathic effects and competition for resources. Studies by various researchers have corroborated these findings, highlighting the detrimental effects of tree root leachates on crop growth and yield. Furthermore, comparisons between inside and outside cement rings demonstrated the importance of root exclusion in mitigating these adverse effects, with crops performing better within the rings. Overall, these findings emphasize the complex interactions between trees and crops, suggesting the need for strategic management practices to optimize agricultural productivity in agroforestry systems. Further research in this area could provide valuable insights into sustainable land use practices and resource allocation for improved crop production.
Figures and tables from the paper
| Treatment / Distance (m) | 15 DAS | — | — | 30 DAS | — | — | 45 DAS | — | — | — | Harvest | — | — |
|---|---|---|---|---|---|---|---|---|---|---|---|---|---|
| ICR | OCR | Mean | ICR | OCR | Mean | ICR | OCR | Mean | ICR | OCR | Mean | ||
| 0-3 | 0.61 | 0.28 | 0.45 | 2.80 | 1.21 | 2.01 | 6.25 | 4.10 | 5.18 | 8.90 | 5.00 | 6.95 | |
| 3-6 | 0.64 | 0.31 | 0.48 | 2.82 | 1.24 | 2.03 | 6.40 | 4.25 | 5.33 | 9.20 | 5.32 | 7.36 | |
| 6-9 | 0.62 | 0.33 | 0.48 | 2.82 | 1.29 | 2.06 | 6.10 | 4.65 | 5.38 | 9.35 | 6.58 | 7.97 | |
| 9-12 | 0.66 | 0.35 | 0.51 | 2.84 | 1.30 | 2.07 | 6.25 | 4.90 | 5.58 | 9.40 | 7.45 | 8.43 | |
| 12-15 | 0.65 | 0.62 | 0.64 | 2.83 | 2.79 | 2.81 | 6.60 | 5.90 | 6.25 | 9.15 | 8.50 | 8.83 | |
| 15-18 | 0.63 | 0.63 | 0.63 | 2.83 | 2.82 | 2.83 | 6.50 | 6.20 | 6.35 | 9.25 | 9.05 | 9.15 | |
| Mean | 0.64 | 0.42 | 2.82 | 1.78 | 6.35 | 5.00 | 9.21 | 7.02 | |||||
| SEm | CD at 5% | SEm | CD at 5% | SEm | CD at 5% | SEm | CD at 5% | ||||||
| Distance(D) | 0.04 | 0.11 | 0.21 | 0.59 | 0.28 | 0.80 | 0.25 | 0.71 | |||||
| Ring(R) | 0.03 | 0.09 | 0.12 | 0.34 | 0.21 | 0.60 | 0.19 | 0.54 | |||||
| D X R | 0.07 | 0.20 | 0.32 | 0.91 | 0.36 | 1.02 | 0.32 | 0.91 |
Table text extracted from the original PDF; superscript letters are shown inline. The original table image is below.
View original table image
| Treatment / Distance (m) | 15 DAS | — | — | — | 30 DAS | — | — | — | 45 DAS | — | — | Harvest | — | — |
|---|---|---|---|---|---|---|---|---|---|---|---|---|---|---|
| ICR | OCR | Mean | ICR | OCR | Mean | ICR | OCR | Mean | ICR | OCR | Mean | |||
| 0-3 | 0.51 | 0.25 | 0.38 | 2.60 | 1.15 | 1.88 | 6.02 | 4.00 | 5.01 | 8.60 | 5.10 | 6.85 | ||
| 3-6 | 0.52 | 0.27 | 0.40 | 2.65 | 1.17 | 1.90 | 5.90 | 4.20 | 5.05 | 8.90 | 6.20 | 7.55 | ||
| 6-9 | 0.53 | 0.29 | 0.41 | 2.63 | 1.21 | 1.92 | 6.20 | 4.25 | 5.23 | 8.80 | 6.30 | 7.55 | ||
| 9-12 | 0.54 | 0.54 | 0.54 | 2.61 | 2.57 | 2.59 | 6.00 | 6.00 | 6.00 | 8.50 | 8.50 | 8.50 | ||
| 12-15 | 0.55 | 0.54 | 0.55 | 2.62 | 2.60 | 2.61 | 6.10 | 6.10 | 6.10 | 8.80 | 9.00 | 8.90 | ||
| 15-18 | 0.55 | 0.55 | 0.55 | 2.62 | 2.61 | 2.62 | 6.00 | 6.20 | 6.10 | 8.75 | 9.10 | 8.93 | ||
| Mean | 0.53 | 0.41 | 2.62 | 1.89 | 6.04 | 5.13 | 8.73 | 7.37 | ||||||
| SEm | CD at 5% | SEm | CD at 5% | SEm | CD at 5% | SEm | CD at 5% | |||||||
| Distance(D) | 0.27 | 0.76 | 0.30 | 0.85 | 0.29 | 0.82 | 0.36 | 1.02 | ||||||
| Ring(R) | 0.19 | 0.54 | 0.24 | 0.68 | 0.16 | 0.45 | 0.22 | 0.62 | ||||||
| D X R | 0.34 | 0.97 | 0.37 | 1.05 | 0.40 | 1.13 | 0.47 | 1.33 |
Table text extracted from the original PDF; superscript letters are shown inline. The original table image is below.
View original table image
| Treatment / Distance (m) | Thousand seed weight | — | — | Grain yield | — | — | Stover yield | — | — | Harvest Index | — | — |
|---|---|---|---|---|---|---|---|---|---|---|---|---|
| ICR | OCR | Mean | ICR | OCR | Mean | ICR | OCR | Mean | ICR | OCR | Mean | |
| 0-3 | 38.46 | 22.77 | 30.61 | 597 | 365 | 481 | 1904 | 1459 | 1681 | 23.88 | 20.01 | 21.95 |
| 3-6 | 38.37 | 22.97 | 30.67 | 599 | 377 | 488 | 1907 | 1460 | 1683 | 23.90 | 20.52 | 22.21 |
| 6-9 | 37.19 | 23.85 | 30.52 | 601 | 381 | 492 | 1910 | 1466 | 1688 | 23.97 | 20.65 | 22.31 |
| 9-12 | 37.67 | 27.42 | 32.54 | 604 | 480 | 542 | 1905 | 1646 | 1775 | 24.06 | 22.57 | 23.32 |
| 12-15 | 38.24 | 36.98 | 37.61 | 604 | 590 | 597 | 1910 | 1902 | 1906 | 24.02 | 23.68 | 23.85 |
| 15-18 | 37.47 | 37.89 | 37.68 | 607 | 601 | 604 | 1908 | 1912 | 1910 | 24.15 | 23.93 | 24.04 |
| Mean | 37.90 | 28.65 | 602 | 465 | 1907 | 1641 | 24.00 | 21.90 | ||||
| SEm | CD at 5% | SEm | CD at 5% | SEm | CD at 5% | SEm | CD at 5% | |||||
| Distance(D) | 0.65 | 1.84 | 8.73 | 35.06 | 38.49 | 108.93 | 0.13 | 0.37 | ||||
| Ring(R) | 0.38 | 1.08 | 5.04 | 14.31 | 25.68 | 72.78 | 0.08 | 0.23 | ||||
| D X R | 0.94 | 2.66 | 12.34 | 35.07 | 51.30 | 145.18 | 0.19 | 0.54 |
Table text extracted from the original PDF; superscript letters are shown inline. The original table image is below.
View original table image
| Treatment / Distance (m) | Thousand seed weight | — | — | Grain yield | — | — | Stover yield | — | — | Harvest Index | — | — |
|---|---|---|---|---|---|---|---|---|---|---|---|---|
| ICR | OCR | Mean | ICR | OCR | Mean | ICR | OCR | Mean | ICR | OCR | Mean | |
| 0-3 | 36.74 | 22.50 | 29.62 | 597 | 382 | 489 | 1909 | 1620 | 1764 | 23.82 | 19.08 | 21.45 |
| 3-6 | 37.51 | 22.68 | 30.09 | 601 | 394 | 497 | 1910 | 1635 | 1772 | 23.94 | 19.42 | 21.68 |
| 6-9 | 36.57 | 30.16 | 33.36 | 609 | 502 | 555 | 1911 | 1798 | 1854 | 24.17 | 21.83 | 23.00 |
| 9-12 | 37.58 | 36.74 | 37.16 | 611 | 584 | 598 | 1910 | 1897 | 1903 | 24.24 | 23.54 | 23.89 |
| 12-15 | 37.33 | 36.99 | 37.16 | 604 | 604 | 604 | 1910 | 1903 | 1906 | 24.03 | 24.09 | 24.06 |
| 15-18 | 37.75 | 36.97 | 37.36 | 603 | 610 | 607 | 1908 | 1912 | 1910 | 24.01 | 24.19 | 24.10 |
| Mean | 37.24 | 31.00 | 604 | 512 | 1910 | 1794 | 24.04 | 22.03 | ||||
| SEm | CD at 5% | SEm | CD at 5% | SEm | CD at 5% | SEm | CD at 5% | |||||
| Distance(D) | 0.51 | 1.44 | 14.46 | 40.98 | 13.48 | 38.15 | 0.15 | 0.43 | ||||
| Ring(R) | 0.29 | 0.82 | 8.35 | 23.67 | 7.47 | 20.86 | 0.07 | 0.20 | ||||
| D X R | 0.72 | 2.04 | 20.44 | 57.93 | 29.75 | 84.19 | 0.23 | 0.65 |
Table text extracted from the original PDF; superscript letters are shown inline. The original table image is below.
View original table image
References
17 in the original paper- Batish DR, Singh HP, Sassa K. Role of allelopathy regulating the understorey vegetation of Casuarina equisetifolia. Proceedings of the IUFRO. 1998. p. 317-23.
- Chandrashekaraiah AM. Investigations on agroforestry in transitional tract of Dharwad. Ph.D. Thesis, University of Agricultural Sciences, Bangalore; 1986.
- Dhushan JS, Laksminarayan K. Allelopathic effects of Acacia nilotica on cereal and legume crops grown in fields. Allelopathy Journal. 1995;2(1):93-8.
- Grewal SS. Nursery raising, growth, fertilization, cover crops and water use of eucalyptus on foothill alluvium near Chandigarh -a review. Indian Journal of Forestry. 1995;18(1):1-12.
- Jadhav BB, Gaynar DG. Effect of Casuarina equisetifolia leaf litter leachate on germination and seedling growth of rice and cowpea. Allelopathy Journal. 1995;2(1):105-8.
- King KFS, Chandler MT. The waste land. Nairobi, Kenya: International Council for Research in Agroforestry; 1998.
- Melkania NP. Influence of leaf leachates of certain woody species on agricultural crops. Indian Journal of Ecology. 1984;11:82-86.
- Onyewotu LOZ, Stigter CJ. Eucalyptus its reputation and its roots: millet and a eucalyptus shelter belt in Northern Nigeria. Agroforestry Today. 1995;7(1):6-8.
- Palmberg C. Research needs in forest tree breeding and improvement in developing countries. Agroforestry Systems. 1980;9:29-35.
- Panneerselvam R, Karikalan L, Rajan S. Allelopathic effect of Tectona grandis leaf and root extracts on Arachis hypogaea and Zea mays. Allelopathy Journal. 1998;6(1):1220.
- Singh D, Kohli RK. Impact of Eucalyptus tereticornis Sm. shelterbelts on crops. Agroforestry Systems. 1992;20(3):253-66.
- Srivastava, Narain. Studies on effect of eucalyptus leachates on field crops. Forest Research. 1980;6(2):123-128.
- Srivastava AK. Agroforestry systems in black soils. Paper presented in Symposium on Watershed Management, held in Feb. 1983, at Bellary, Karnataka; c1983.
- Story R. Pasture patterns and associated soil water in partially cleared woodland. Australian Journal of Botany. 1967;15:175-187.
- Swaminathan C, Robin S, Kannan K, Malarvizhi D, Dhanakodi CV. Performance of understorey vegetable crops in eucalyptus and casuarina in southern India. Allelopathy Journal. 1998;6(1):39-45.
- Tripathi S, Tripathi A, Kori DC, Tripathi S, Tripathi A. Allelopathic effect of extracts of Dendrocalamus strictus on germination and seedling growth of soybean. Indian Journal of Ecology. 1998;25(2):123-132.
- Tripathi S, Tripathi A, Kori DC, Tripathi S, Tripathi A. Allelopathic evaluation of Tectona grandis leaf, root and soil aqueous extracts on soybean. Indian Journal of Forestry. 1999;22(4):366-374.