
Research article · 2024 · Full text
International Journal of Agriculture Extension and Social DevelopmentImpact of technological interventions of Krishi Vigyan Kendra, Darsi in Prakasam district of Andhra Pradesh
Volume 7(5) · Pages 404–411 · DOI: 10.33545/26180723.2024.v7.i5f.647 ↗
Research areasAgricultural Economics and PracticesSocial and Economic Development in IndiaIndian Economic and Social Development
Abstract
Author-writtenThe research was carried out between 2016 and 2022. Demonstrations implemented in KVK operated villages of Prakasam district were selected purposively. A total of 120 farmers (30 redgram, 30 blackgram, 30 chilli and 30 maize farmers) were selected from 12 villages. Most of the respondents selected for the study were age old (60.00%) with elementary school education (42.50%) having small farm holding size (55.83%) with medium level of farm experience (49.6%) extension contact (46.67%), social participation (45.00%), scientific orientation (65.84%) and medium level of annual Income (60.83%). The chosen trials were carried out in farmers' fields in accordance with the advice of Krishi Vigyan Kendra, Darsi. Mean percentage increase in yield over check for three consecutive years was 35.65% for redgram (2016–17, 2017–18, and 2018–19), 27.27% for blackgram (2018–19, 2019–20, and 2020–21), 8.89% for chilli (2017–18, 2018–19, and 2020–21), and 18.02 percent for maize (2018–19, 2019–20, & 2020–21. Redgram local varieties and LRG 41 were swapped out for LRG 52, while local varieties in blackgram were swapped out for TBG 104 in the demonstration cluster. Areas with LRG 52 showed significant creep from 100 ha to 16000 ha, whereas the TBG104 blackgram variety cultivating areas to treble from 150 ha to 15000 ha. Likewise, the execution of demonstrations resulted in an increase in the area under maize cultivation from 15 ha to 210 ha and the area under chili crop from 50 ha to 250 ha.
Summary
Source-checkedPlain-language reading of the full paper, prepared with AI and checked against the text. Each point links to the authors' own words.
Why it matters
- Krishi Vigyan Kendras (KVKs) serve as essential hubs for providing agricultural technology and knowledge to farmers to improve productivity and financial independence. View evidence ↗
- The KVK system is intended to positively impact rural agricultural communities by improving income, production, and resource efficiency. View evidence ↗
What they did
- The research used an ex-post-facto design and multi-stage sampling to survey farmers in the Prakasam district between 2016 and 2022. View evidence ↗
- The study included a total of 120 respondents, consisting of 30 farmers for each of the four technological interventions. View evidence ↗
- Interventions were implemented via Cluster Front Line Demonstrations (CFLD) and Front Line Demonstrations (FLD), providing inputs and scientific guidance to bridge gaps in farming practices. View evidence ↗
What they found
- The majority of surveyed farmers were middle-aged (60%), had elementary education (42.5%), small farm holdings (55.83%), and medium levels of income (60.83%) and scientific orientation (65.84%). View evidence ↗
- Integrated Crop Management (ICM) in blackgram (T1) resulted in a 27% higher average yield (17.50 q/ha) and 33% higher net returns compared to non-ICM practices (T2). View evidence ↗
- In chilli crops, the ICM module (T1) produced an average yield of 85.83 q/ha, leading to 19% greater net returns and a higher cost-benefit ratio (2.75) than the farmers' practice (T2). View evidence ↗
- The IPM module for fall armyworm in maize increased average yields to 70.68 q/ha (compared to 59.89 q/ha in the check) and increased net returns by 38.4%. View evidence ↗
What it means
- The authors recommend that stakeholders prioritize large-scale Front Line Demonstrations using cluster approaches to accelerate the replacement of low-yielding local cultivars. View evidence ↗
- The authors suggest that policymakers provide sufficient financial support to enable the organization of CFLDs and FLDs under scientific supervision to increase overall agricultural productivity. View evidence ↗
Visual summary
2 visualsIllustrations explain the paper; charts are replotted from the paper's own table values.
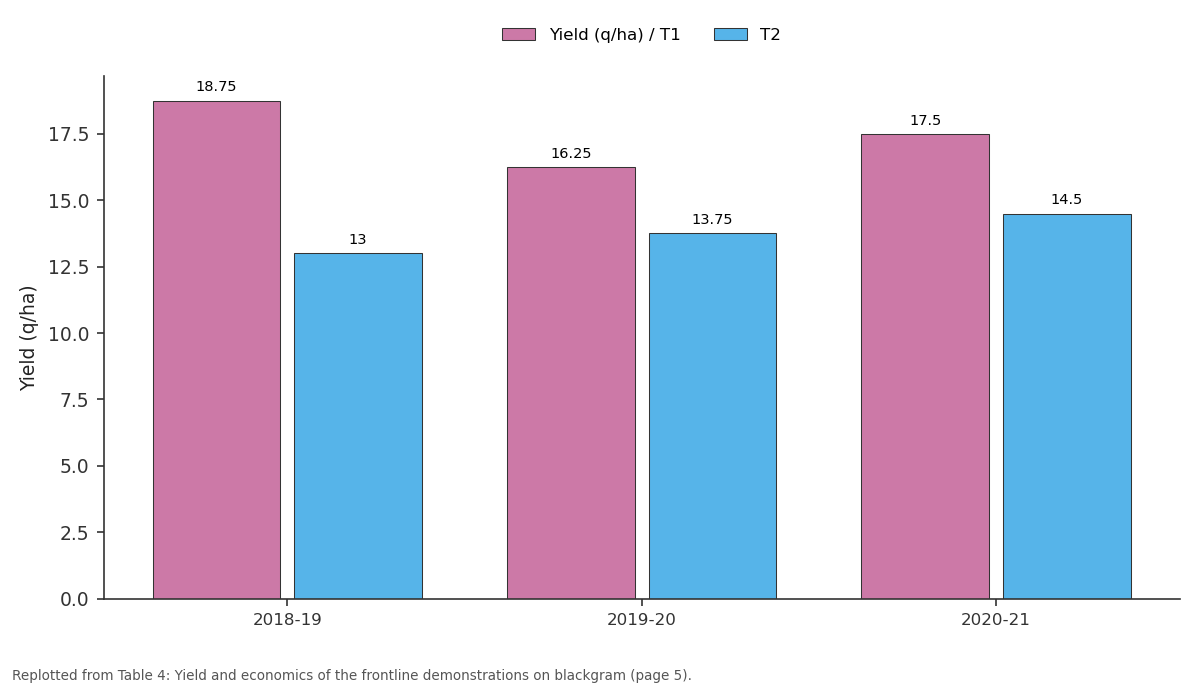
Yield (q/ha) / T1 and T2: 2018-19 vs 2019-20 vs 2020-21
Replotted from Table 4 (page 5) of the original paper. Every bar is the paper's own table value.
View source evidence ↗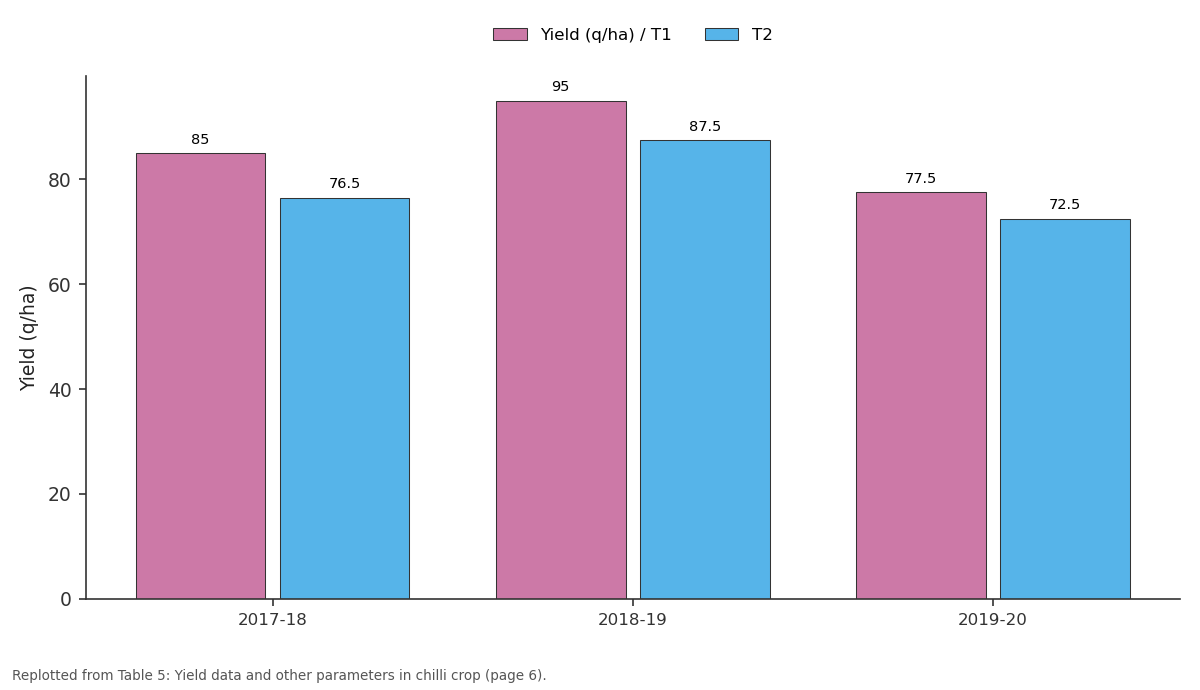
Yield (q/ha) / T1 and T2: 2017-18 vs 2018-19 vs 2019-20
Replotted from Table 5 (page 6) of the original paper. Every bar is the paper's own table value.
View source evidence ↗Figures & tables
From the original paper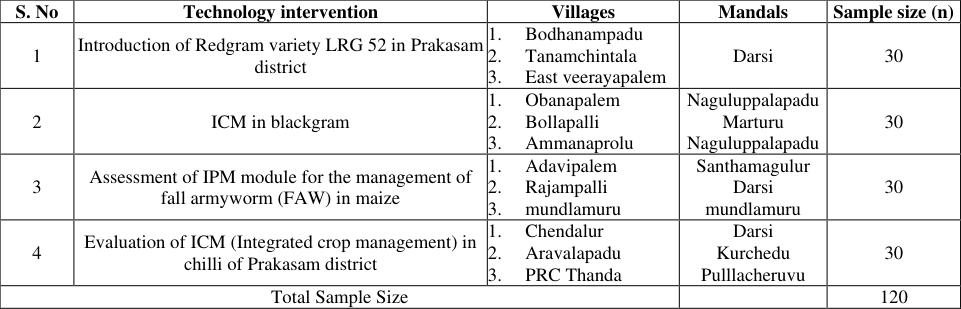 Table 1
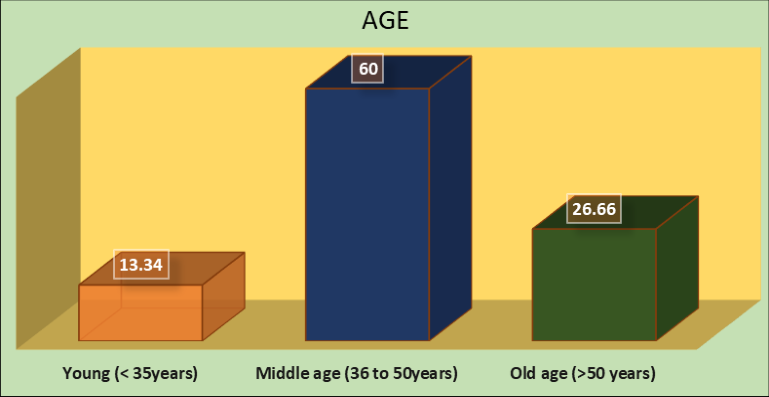 Figure 1
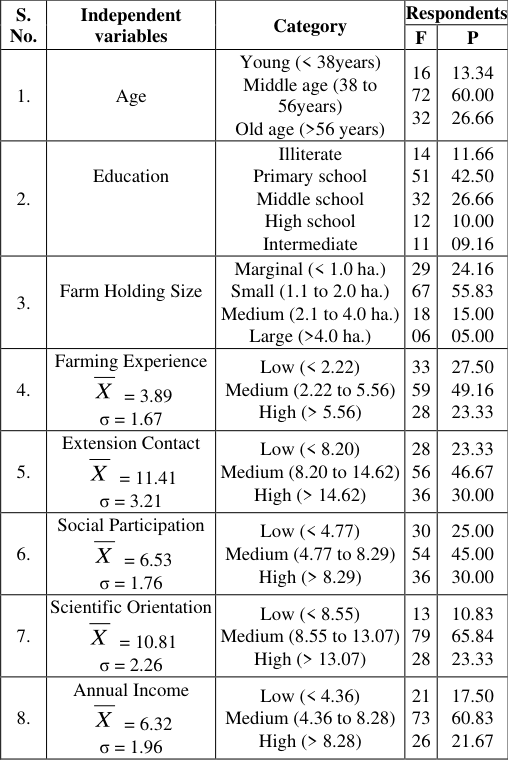 Table 2
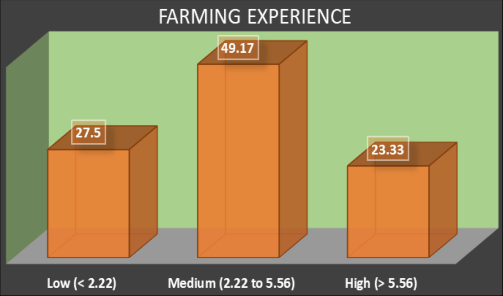 Figure 4
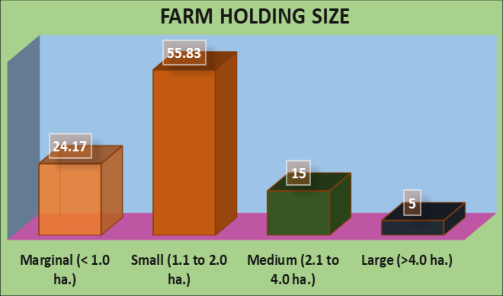 Figure 3
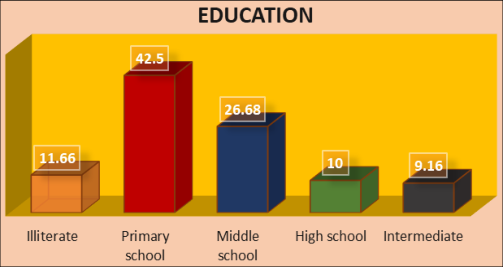 Figure 2
 Table 3
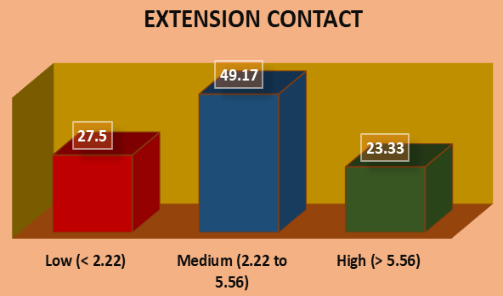 Figure 5
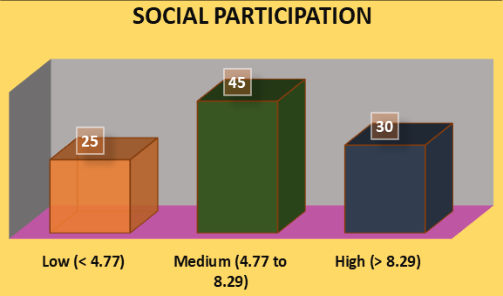 Figure 6
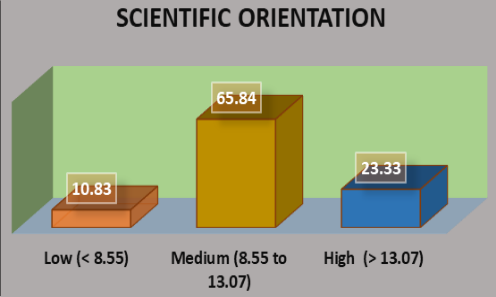 Figure 7
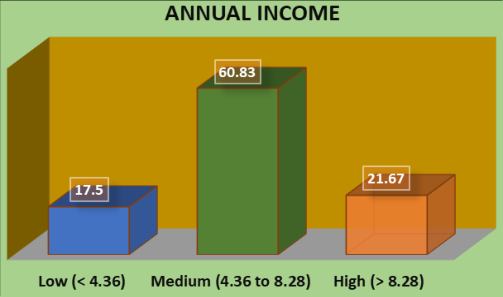 Figure 8
 Table 4
 Table 5
 Table 6
 Table 7
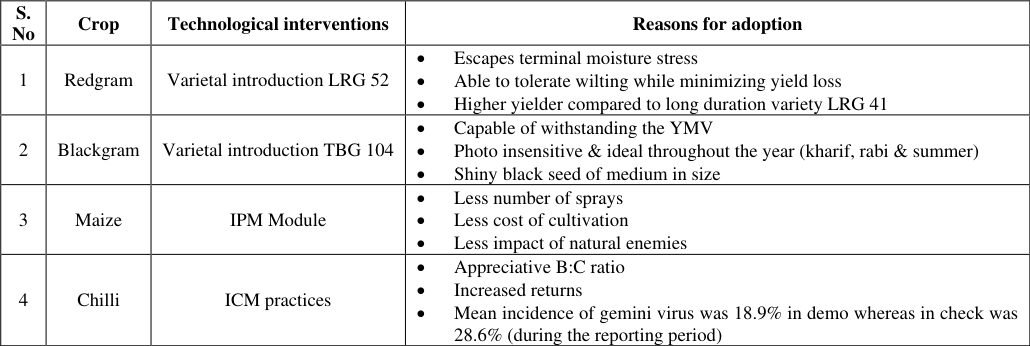 Table 8
Introduction
Krishi Vigyan Kendra (KVKs), the lighthouse for farmers in India, is an institutional project of ICAR. KVKs were dispersed around the nation with the intention of utilizing a multidisciplinary team known as Subject Matter Specialists (SMS) to assist in the transmission of agricultural technology to farmers on their fields. KVKs have a critical role in knowledge management, technological support, and advising to various stakeholders, including farmers, farmwomen, rural youth, and extension workers. The focus is on equipping participants with the essential knowledge and abilities to increase agricultural productivity and achieve financial independence through gainful employment. Throughout the years, the Krishi Vigyan Kendra (KVK) system has expanded the range of its operations in the agricultural and related sectors by executing multiple activities like capacity building programs and frontline demonstrations, technology assessment and refinement in order to bringing new concepts of entrepreneurship opportunities, convergence of extension activities, integrated farming system, crop diversification, value addition, biodiversity conservation, organic farming etc. The KVK System has had a good effect on the rural agricultural community in terms of income, production, productivity, sale price, and most importantly, the ability to use resources as efficiently as possible. Accordingly, an evaluation of the effects of KVK's technology interventions was conducted in KVK Darsi's operational villages between 2016 and 2022. In Prakasam district KVK was launched in 2001 at Darsi under the adminiship of Acharya N.G Ranga Agricultural University (ANGRAU), Lam, Guntur. It is located at Kurchedu road which is 3 km away from Darsi town. It possess a total of 21.46 ha land and it was working in 29 operational mandals covering both Prakasam and Bapatla districts of Andhra Pradesh with 8 farming situations. Predominant crops cultivating under KVK jurisdiction were rice, chilli, tobacco, redram, blackgram, chickpea, greengram and cotton. The present study was conducted with the below mentioned objectives 1. To examine the socio-personal characteristics of KVK beneficiaries 2. To explore the Economic impact of KVK interventions percent, This might be due to lack of opportunity to change their profession among middle aged making them to become loyal to their existing profession. The above findings were in accordance with the results of Patel et al. (2013) [3] . A cursory look at Table 2 and Figure 2 revealed that 42.50% of the farmers belonging to elementary school followed by the rest belonging to middle School (26.66%), illiterate (11.66%), high school (10.00%) and intermediate education (09.16%) categories. Majority of the respondents were educated this might be due to existence of government schools in the villages. This finding was in concurrence with the results of Naik et al. (2015) [4] . It was evident from Table 2. & Figure 3 most of the respondents had small farm holdings (55.83%), followed by marginal farmers (24.16%) category. Whereas, 15.00% belonged to medium farmers and 05.00% of them had large farm holding. Majority (33.34%) of the farmers had medium holdings followed by small holdings. Perhaps the reason was the splitting of joint families resulted in less acreage of land to individual farmers. Hence, there is a need to concentrate on small and medium farmers in transfer of technology. Efforts also should be made to motivate marginal farmers. The above findings were in accordance with the results of Ghuge et al. (2015) [5] . The above Table 2 and Figure 4 illustrated that nearly half of the respondents (49.16%) had medium level of farming experience followed by the rest with low (27.50%) and high (23.33%) level of farming experience. It's possible that this is because farming is the main occupation for farmers, who have been doing this activity for years together. The results were in line with the findings of Madhuri et al., (2020) [6] . It could be comprehended from the Table 2 and Figure 5 that nearly fifty percent (46.67%) of the farmers had medium extension contact, followed by 30.00 percent of them with high and 23.33 percent of them with low extension contact This could be a result of a lack of understanding about extension services or a lack of inclination to consult extension officials. The findings of the study were in line with the findings of Madhuri et al., (2020) [6] . It was evident from the table 2 and Figure 6 that almost fifty percent (45.00%) of the farmers had medium level of social participation, followed by 30.00 percent of them with high level and 25.00 percent of them with low level of social participation. From the results it could be inferred that majority of farmers tend to become members in social organizations Viz., co-operative agricultural credit societies, rythu clubs, farmer producer organizations. The main purpose was to gain from the organization, regardless of whether or not they were interested in it. Perhaps this is why the majority of respondents had medium level of social participation. The findings were in accordance with the findinds of Tomar et al., (2016) [7] . From the Table 2 and Figure 7 it was clear, that more than sixty percent of the farmers (65.84%) had medium scientific orientation subsequently those with high (23.33%) and low (08.55%) levels of scientific orientation. Medium scientific orientation is a superb indication of farmers to accumulate new strategies in farming and can have ended in vast income. A good scientific approach leads to better decision making in agriculture. The results were in accordance with Madhuri et al., (2020) [6] . Results furnished in Table 2 and Figure 8 showed that sixty percent (60.83%) of the farmers had medium annual income followed by 21.67 percent with high and 17.50 percent with low annual income. This may be because most farmers were well educated and can think about the economics of agriculture and allied sectors. The results were in line with the findings of Madhuri et al., (2020) [6] . Table 3 clearly shows that the mean grain yield was 15.6 q/ha, which was 36% higher than LRG 41; the cultivation cost was 3% lower than LRG 41; the gross returns were 23% higher than LRG 41; the net returns were 55% higher than LRG 41; and the cost benefit ratio was 2.50 where as it was 2.03 with LRG 41 variety, which was a positive sign. 4), over the course of three years of demonstration, the net returns from the recommended pactice was significantly higher than the T 2 from 2018-19 to 2020-21. When compared to treatment 2, which yields net returns of Rs 40658/ha, the average net returns from treatment 1 were found to be Rs 61358/ha. The technology intervention offered in demonstration plots (Treatment 1) is credited with producing an extra income of Rs. 20700/ha. Economic analysis of the yield performance revealed that average yield in T 1 was 17.50 which was 27% higher than T 2 ; the cultivation cost was 3% lower than T 2 ; the gross returns were 21% higher than T 2 ; the net returns were 33% higher than T 2 ; and the cost benefit ratio was 2.54in T 1 and in T 2 it was 2.05. Favourable BC Ratio indicated the treatment's economic viability and persuaded farmers of its usefulness. These findings were in line with the results of Dhaka et al., (2010) [9] . The yield performance on economic analysis, which showed that the average yield in T 1 was 85.83 q/ha, whereas in T 2 it was 78.83 q/ha. The net returns were 19% greater than T 2 , the gross returns were 8% higher than T 2 , the cost of cultivation was 6% lesser than T 2 , and the cost benefit ratio was 2.34 in T 2 compared to 2.75 in T 1 . Farmers were convinced with the treatment 1 as there was a significant impact on cost benefit ratio. 6, In demo plot net returns were significantly higher than those of check plot. The average net returns from demo were found to be Rs 70048 /ha, in contrast to check, which had net returns of Rs 50604 /ha. the technology intervention provided in demo, is attributed with generating an additional income of Rs. 19444/ha. The yield performance on economic analysis, which showed that the average yield in demo was 70.68 q/ha, whereas in check it was 59.89 q/ha. The net returns were 38.4% greater than check, the gross returns were 17.86% higher than check, the cost of cultivation was 3.4% lesser than check, and the cost benefit ratio was 2.46 in demo compared to 2.02 in check. Farmers were convinced with the IPM module as there was a significant positive impact on cost benefit ratio.
| Year | Yield (q/ha) | — | Impact (% change in yield) | Cost of cultivation (Rs/ha) | — | Gross returns (Rs/ha) | — | Net returns (Rs/ha) | — | C:B Ratio | — |
|---|---|---|---|---|---|---|---|---|---|---|---|
| LRG 52 | LRG 41 | LRG 52 | LRG 41 | LRG 52 | LRG 41 | LRG 52 | LRG 41 | LRG 52 | LRG 41 | ||
| 2016-17 | 19.5 | 11.3 | 72.57 | 36500 | 37000 | 70450 | 55200 | 33950 | 18200 | 1:1.9 | 1:1.5 |
| 2017-18 | 15.0 | 12.5 | 20.00 | 24150 | 26250 | 57000 | 47500 | 32850 | 21250 | 1:2.4 | 1:1.8 |
| 2018-19 | 12.3 | 10.7 | 14.95 | 25000 | 25000 | 79625 | 69550 | 54625 | 44550 | 1:3.2 | 1:2.8 |
| Mean | 15.6 | 11.5 | 35.65 | 28550 | 29417 | 69025 | 57417 | 40475 | 28000 | 1:2.5 | 1:2.0 |
Table text extracted from the original PDF; superscript letters are shown inline. The original table image is below.
View original table image
Impact of technologies on horizontal spread of varieties/technologies in Prakasam district
Table 7 showed that FLD and CFLDs demonstrated on different crops contributed to an increase in the area under suggested varieties/ technologies.Due to CFLDs, the area increased significantly from 100 ha to 16000 ha under the redgram variety LRG 52 and from 150 ha to 15000 ha under the blackgram variety TBG104. Likewise, as a result of FLDs, the area under maize crop increase from 15 ha to 210 ha and the area under chili crop increased from 50 ha to 250 ha. The horizontal spread of redgram and blackgram crop varieties were positively impacted by the CFLDs. Additionally, the introduction of the IPM module for managing FAW in maize and the ICM module for managing chillies had a major favorable influence on the horizontal spread of technologies. Thus, the study comes to the conclusion that the KVK, Darsi-organized CFLDs & FLDs had a major influence on the horizontal spread of both varieties and technologies.
| S. No | Crop | Title of technology intervention | Area Before adoption | Area After adoption | Impact (% Change in area) |
|---|---|---|---|---|---|
| 1 | Redgram | Introduction of Redgram (LRG 52) | 100 | 16000 | 15900 |
| 2 | Blackgram | Introduction of Blackgram (TBG 104) | 150 | 15000 | 9900 |
| 3 | Maize | Introduction of IPM module for the management of fall army worm (FAW) in maize | 15 | 210 | 1300 |
| 4 | Chilli | ICM in Chilli | 50 | 250 | 400 |
Table text extracted from the original PDF; superscript letters are shown inline. The original table image is below.
View original table image
Reasons for Adoption of recommended technologies
The primary justifications for implementing the suggested technologies were listed in Table 8. The demonstrations of CFLDs and FLDs significantly increased the output potential of various crops on farmer's fields. In order to increase the productivity potential of main crops and hasten the spread of flagship technologies, it is advised that stakeholders involved in the transfer and application of agricultural technologies on farmer's fields prioritize organizing large-scale Front Line Demonstrations (FLDs) in cluster approaches. FLDs cause the majority of low-yielding local cultivars to be replaced. Thus, it is recommended that policy makers enable the frontline extension system to organize CFLDs and FLDs under the careful supervision of agricultural scientists and extension staff by providing sufficient financial support. At the local, state, and federal levels, this could contribute to increased agricultural productivity.
| S. No | Crop | Technological interventions | Reasons for adoption |
|---|---|---|---|
| 1 | Redgram | Varietal introduction LRG 52 | Escapes terminal moisture stress Able to tolerate wilting while minimizing yield loss Higher yielder compared to long duration variety LRG 41 |
| 2 | Blackgram | Varietal introduction TBG 104 | Capable of withstanding the YMV Photo insensitive & ideal throughout the year (kharif, rabi & summer) Shiny black seed of medium in size |
| 3 | Maize | IPM Module | Less number of sprays Less cost of cultivation Less impact of natural enemies |
| 4 | Chilli | ICM practices | Appreciative B:C ratio Increased returns Mean incidence of gemini virus was 18.9% in demo whereas in check was 28.6% (during the reporting period) |
Table text extracted from the original PDF; superscript letters are shown inline. The original table image is below.
View original table image
Conclusion
In conclusion, the analysis of socio-personal characteristics among KVK beneficiaries sheds light on the demographics and educational levels prevalent among farmers. The economic impact of KVK interventions, particularly in introducing new technologies and crop management practices, has been significant, leading to higher yields and increased profitability. Furthermore, the horizontal spread of these technologies has been facilitated by Front Line Demonstrations (FLDs) and Cluster Front Line Demonstrations (CFLDs). To sustain and amplify these positive outcomes, continued support for FLDs and CFLDs, alongside policy measures to promote technological adoption, is essential. This collaborative effort promises to enhance agricultural productivity and economic well-being for farmers in the region.
Figures and tables from the paper
| Year | Yield (q/ha) | — | Impact (% change in yield) | Cost of cultivation (RS/ha) | — | Gross returns (Rs/ha) | — | Net returns (Rs/ha) | — | C:B Ratio | — |
|---|---|---|---|---|---|---|---|---|---|---|---|
| T1 | T2 | T1 | T2 | T1 | T2 | T1 | T2 | T1 | T2 | ||
| 2018-19 | 18.75 | 13.00 | 44.23 | 40200 | 39000 | 112500 | 78000 | 72300 | 39000 | 1:2.80 | 1:2.00 |
| 2019-20 | 16.25 | 13.75 | 18.18 | 41500 | 40500 | 89375 | 75625 | 47875 | 35125 | 1:2.15 | 1:1.87 |
| 2020-21 | 17.50 | 14.50 | 20.69 | 37600 | 36250 | 101500 | 84100 | 63900 | 47850 | 1:2.70 | 1:2.32 |
| Mean | 17.50 | 13.75 | 27.27 | 39766 | 38583 | 101125 | 79241 | 61358 | 40658 | 1:2.54 | 1:2.05 |
Table text extracted from the original PDF; superscript letters are shown inline. The original table image is below.
View original table image
| Year | Yield (q/ha) | — | Impact (% change in yield) | Cost of cultivation (Rs/ha) | — | Gross returns (Rs/ha) | — | Net returns (Rs/ha) | — | C:B Ratio | — |
|---|---|---|---|---|---|---|---|---|---|---|---|
| T1 | T2 | T1 | T2 | T1 | T2 | T1 | T2 | T1 | T2 | ||
| 2017-18 | 85 | 76.5 | 11.11 | 300000 | 335000 | 72500 | 650250 | 422500 | 315250 | 1:2.4 | 1:1.9 |
| 2018-19 | 95 | 87.5 | 8.57 | 305000 | 325000 | 836000 | 770000 | 531000 | 445000 | 1:2.7 | 1:2.3 |
| 2019-20 | 77.5 | 72.5 | 6.90 | 356250 | 370500 | 1123750 | 1051250 | 767500 | 680750 | 1:3.15 | 1:2.83 |
| Mean | 85.83 | 78.83 | 8.88 | 320416.6 | 343500 | 894083.3 | 823833.3 | 573666.6 | 480333.3 | 1:2.75 | 1:2.34 |
Table text extracted from the original PDF; superscript letters are shown inline. The original table image is below.
View original table image
| Year | Yield (q/ha) | — | Impact (% change in yield) | Cost of cultivation (RS/ha) | — | Gross returns (Rs/ha) | — | Net returns (Rs/ha) | — | C:B Ratio | — |
|---|---|---|---|---|---|---|---|---|---|---|---|
| Demo (IPM) | Check (Non IPM) | Demo (IPM) | Check (Non IPM) | Demo (IPM) | Check (Non IPM) | Demo (IPM) | Check (Non IPM) | Demo (IPM) | Check (Non IPM) | ||
| 2018-19 | 68.12 | 55.2 | 23.41 | 47900 | 48300 | 122616 | 99360 | 74716 | 51060 | 1:2.55 | 1:2.05 |
| 2019-20 | 72.8 | 65.2 | 11.66 | 47600 | 49600 | 131040 | 117360 | 83440 | 67760 | 1:2075 | 1:2.36 |
| 2020-21 | 71.13 | 59.28 | 19.99 | 47600 | 50000 | 99590 | 82992 | 51990 | 32992 | 1:2.09 | 1:1.65 |
| Mean | 70.68 | 59.89 | 18.02 | 47700 | 49300 | 117748 | 99904 | 70048 | 50604 | 1:2.46 | 1:2.02 |
Table text extracted from the original PDF; superscript letters are shown inline. The original table image is below.
View original table image
References
11 in the original paper- Mahesh M, Sandeep P, Ashok Ch. Impact of FLD Intervention on Yield, Adoption and Horizontal Spread of Oilseed Crops in Konkan. Indian J Extens Educ. 2016; 52(3 & 4):79-83.
- Patel JB, Patel BD, Sharma TD. Impact of integrated pest management technology on cotton growers. Karnataka J Agric Sci. 2013; 26(1):164-166.
- Naik A, Sreenivasulu M, Sreenivasarao I, Suneetha Devi KB. Profile characteristics of organic redgram farmers of dry land areas of Karnataka. J Res PJTSAU. 2015; 43(3):36-40.
- Ghuge SN, Kadam RP, Pawar GS. Technological gap in kharif sorghum (Sorghum bicolor L.) production technologies in Marathwada Region. J Res PJTSAU. 2015; 43(4):22-26.
- Madhuri K, Prasad SV, Sailaja V, Pratap Kumar Reddy A, Mohan Naidu G. A Study on the Profile Characteristics of the Farmers using Information and Communication Technologies (ICTs). Int J Curr Microbiol Appl Sci. 2020; 9(6):3676-3682.
- Tomar A, Bhardwaj N, Verma AP, Sawant MN. Association between Socio-Demographic Profile and Extent of Use of ICT among Farmers. Int J Agric Sci Res. 2016; 6(6):163-168.
- Ramesh G, Durga Prasad NVVS, Jahnavi M. Study on productivity and profitability of blackgram var. TBG104 through cluster front line demonstration under rainfed conditions of Prakasam district, Andhra Pradesh. Pharma Innovation J. 2023; 12(2):3806-3809.
- Dhaka BL, Meena BS, Suwalka RL. Popularization of improved maize technology through frontline demonstration in South-eastern Rajasthan. J Agric Sci. 2010; 1:39-42.
- Sahaja Deva, Varaprasada Rao Ch, Vinaya Lakshmi P, Prasada Rao GMV. Impact of a pigeonpea variety LRG 52 in rainfed areas of Prakasam dist. Int J Agric Sci. 2019; 11(14):8834-8836.
- Ravi Venkanna Babu M, Jahnavi M, Prasada Rao GMV, Varaprasada Rao CH. Evaluation of integrated crop management in chilli of Prakasam district, A.P. Pharma Innovation J. 2020; 9(11):373-375.
- Yadav KS, Tripathi AK. Integrated crop management in chilli for enhancing productivity and profitability under farmer's condition. Plant Archives. 2017; 17(2):1658-1660.
Cited by 1
From OpenAlex, OpenCitations and reference lists read by Scinovex
- Constraints perceived by dairy farmers in Anantapuramu district of Andhra Pradesh
G Sri Manjula Reddy, Sahaja Deva, B Sahadevareddy, D. V. Srinivasulu · International Journal of Veterinary Sciences and Animal Husbandry · 2024
The present study was carried out in three mandals of Anantapur district to assess the challenges being faced by dairy farmers with the help of pretested semi-structured questionnaire. Data were collected from 180 dairy farmers in 3 mandals through personal interview of respondents. Most of the respondents selected for the study were illitrates (42.78%) of middle age (64.44%) having Marginal farm holding size (47.22%) with medium family size (71.11%) small herd size (63.89%) and high social involvement (86.11%), mainly dependent on agriculture followed by dairy (63.89%). The study revealed tha