
Research article · 2024 · Full text
International Journal of Agriculture Extension and Social DevelopmentDetermination of the socio-economic factors of the sustainable production of fodder crops: Research of semi-arid zone of Rajasthan province
Volume 7(5S) · Pages 85–92 · DOI: 10.33545/26180723.2024.v7.i5sb.654 ↗
Research areasAgricultural Economics and PracticesAgricultural Systems and PracticesAgricultural risk and resilience
Abstract
Author-writtenThe present study was conducted in Rajasthan. The investigation concerned with semi-arid zone of Rajasthan, which is the highest livestock and bovine population in zone, 6986.2 and 3287.9 thousand; respectively. Milk production and productivity depend on the quality and quantity of feed & fodder. Feed and fodder constitute about 60-70 percent cost of milk production. Fodder crisis in the Rajasthan has been debated long back as it is seen a widening gap between increasing demand and decreasing supply due to diminishing resources. Thus, there is need to devise the way & evolve strategies and solutions to prevent large scale resource depletion which, leads negative effects on the process aimed at achieving sustainable development. Hence, an investigation entitled “A Comprehensive Study on Fodder Production and Its Utilization Pattern in Semi-Arid Zone of Rajasthan” was conducted on proportionate randomly selected 240 dairy farmers belonging to different land holding categories and growing at least two fodder crops in a cropping year and having at least one milch animal during investigation were taken as respondents of Dausa and Tonk districts in Semi-arid zone of Rajasthan. Maximum number of the dairy farmers (43.33%) belonged to middle age category ranging from 36 to 50 years of age. It was found that a sizable proportion of the dairy farmers were illiterate (23.33%) which was closely followed by farmers having education up to senior secondary level (17.50%). More than seventy percent (71.66%) of the farmers felt that the period for green fodder deficit was March to June. While, 19.16 percent of them expressed that the September to February and 9.18 the farmers felt July to October as lean period for the green fodder. Most of the farmers (37.92%) were engaged in agriculture + dairy + labour.
Summary
Source-checkedPlain-language reading of the full paper, prepared with AI and checked against the text. Each point links to the authors' own words.
Why it matters
- The quality and quantity of feed and fodder are critical for milk productivity and represent approximately 60-70% of the total cost of milk production. View evidence ↗
- Rajasthan faces a long-standing fodder crisis characterized by a growing gap between the increasing demand for fodder and a decreasing supply caused by diminishing resources. View evidence ↗
- Frequent drought conditions in Rajasthan lead to acute scarcity of water and fodder, severely impacting the state's cattle population. View evidence ↗
The question
- The study aimed to comprehensively investigate fodder production and its utilization patterns within the semi-arid zone of Rajasthan. View evidence ↗
What they did
- The research was conducted in the Dausa and Tonk districts of Rajasthan's semi-arid zone, selected based on their minimum and maximum livestock densities. View evidence ↗
- The study used proportionate random sampling to select 240 dairy farmers as respondents from selected villages. View evidence ↗
- Eligible respondents were dairy farmers who owned at least one milch animal and grew at least two fodder crops per cropping year. View evidence ↗
What they found
- A significant portion of the dairy farmers were illiterate (23.33%), with the next largest group having education up to the senior secondary level (17.50%). View evidence ↗
- The most common livelihood combination among respondents was agriculture combined with dairy and labor (37.92%). View evidence ↗
- Most respondents (61.25%) had a medium level of contact with agricultural extension services. View evidence ↗
- Nearly half of the respondents (47.50%) had low exposure to mass media. View evidence ↗
- The majority of farmers (68.75%) produced a medium amount of milk, between 4.0 and 13.0 liters per day. View evidence ↗
- The most common land holding size was semi-medium (2.01 to 4.0 ha), held by 35.83% of respondents. View evidence ↗
- Most farm families (63.33%) maintained a medium herd size of 3 to 6 animals. View evidence ↗
What it means
- The authors conclude that the March-to-June fodder deficit is caused by low rainfall, lack of irrigation, poor seed quality, and the prevalence of rainfed farming. View evidence ↗
Visual summary
3 visualsIllustrations explain the paper; charts are replotted from the paper's own table values.
Causes of Seasonal Fodder Deficit
AI-generated conceptual illustration (pearl millet and sorghum fodder crops in a semi-arid Rajasthan landscape). It explains the idea and does not show study data.
View source evidence ↗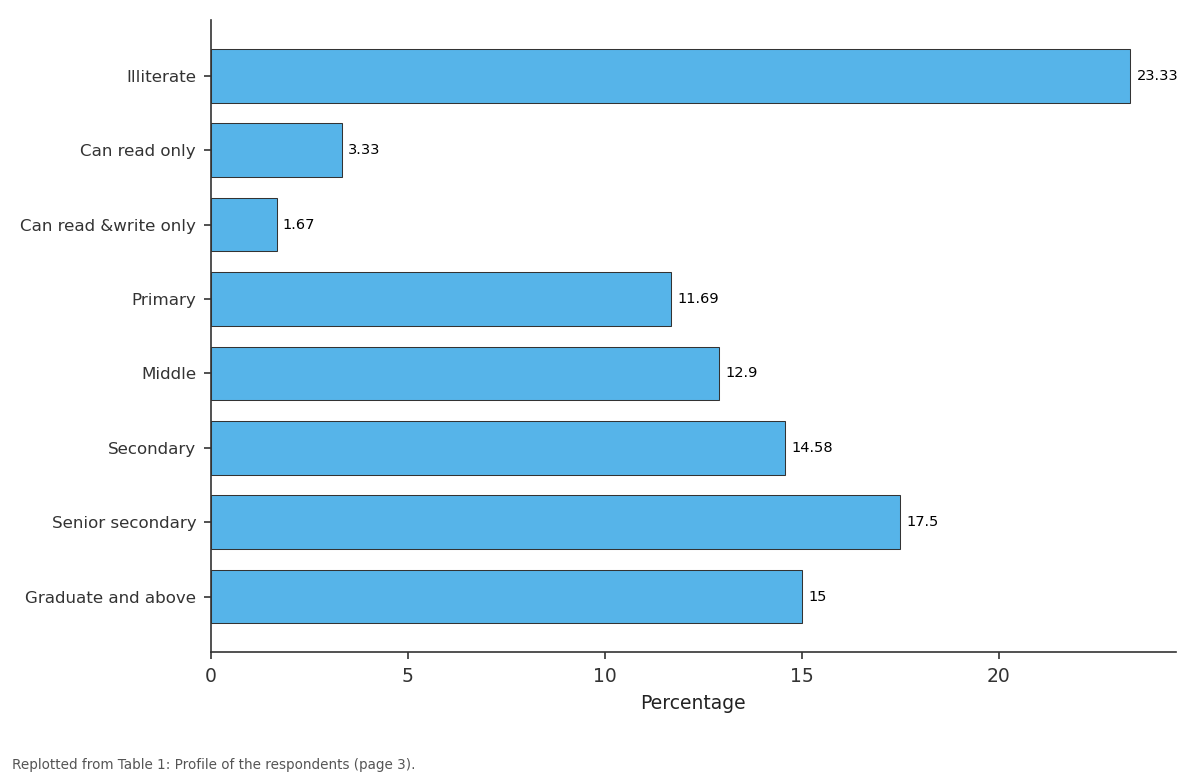
Percentage: Illiterate vs Can read only vs Can read &write only vs Primary vs Middle
Replotted from Table 1 (page 3) of the original paper. Every bar is the paper's own table value.
View source evidence ↗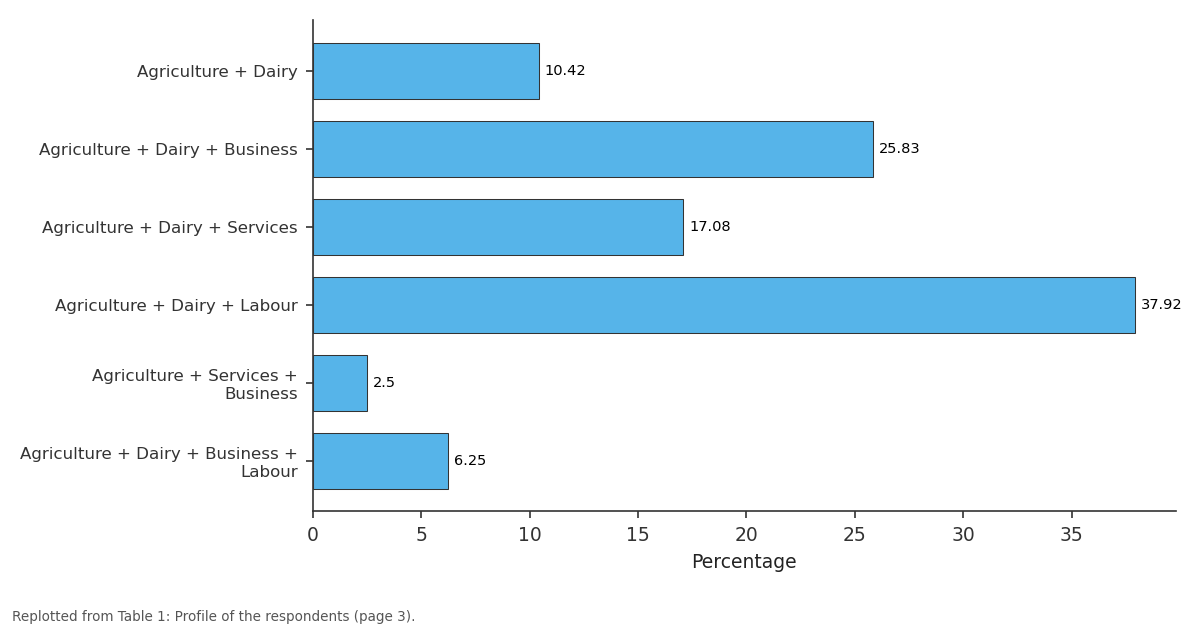
Percentage: Agriculture + Dairy vs Agriculture + Dairy +... vs Agriculture + Dairy +... vs Agriculture + Dairy +... vs Agriculture + Services...
Replotted from Table 1 (page 3) of the original paper. Every bar is the paper's own table value.
View source evidence ↗Figures & tables
From the original paper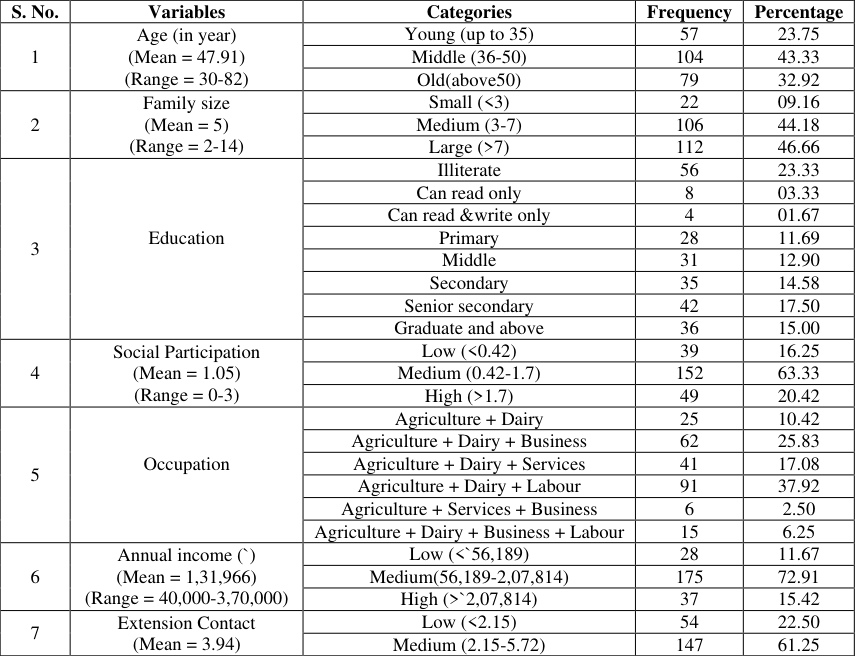 Table 1
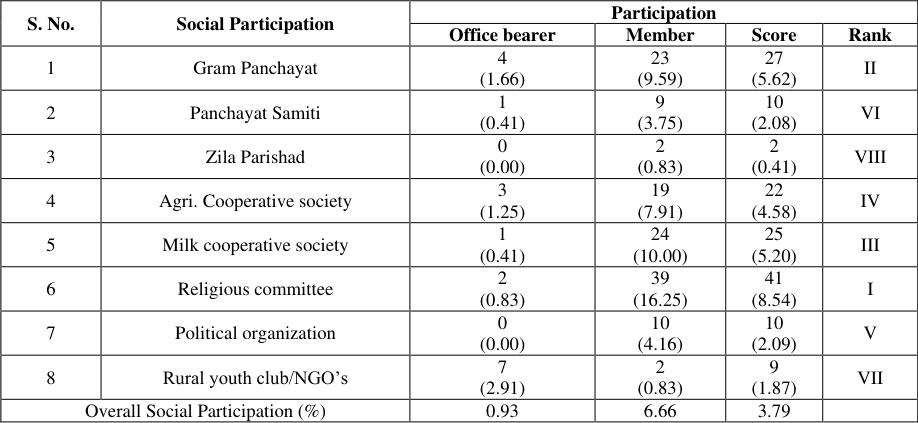 Table 2
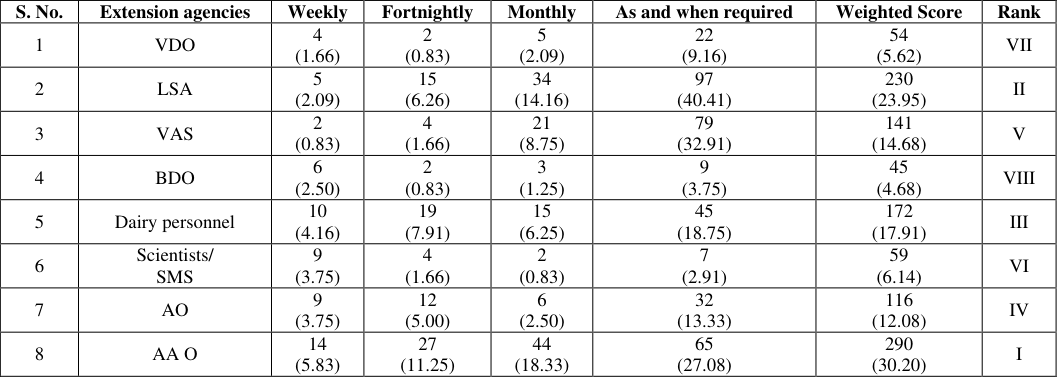 Table 3
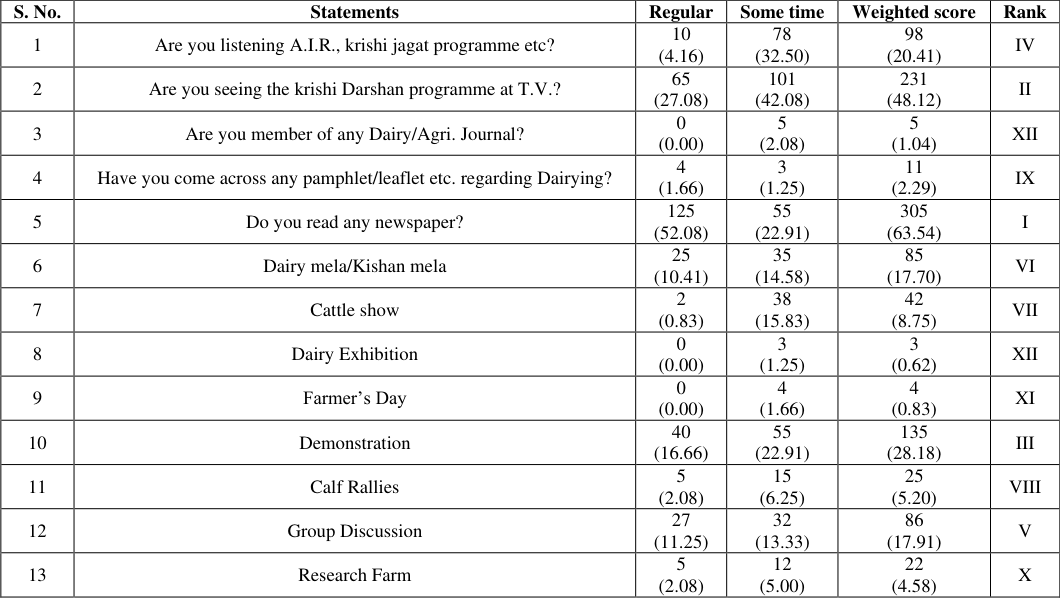 Table 4
Introduction
Dairying is an integral part of Indian agriculture and it holds a significant place in Indian economy. At the household level; dairying plays an important role in determining the economic condition of 70 million farm families (NSIC, 2022) [13] . The dairy enterprise provides insurance against crop failure and contributes directly towards increasing the crop production by making availability of draught power, organic manure and cash income on a regular and day-today basis. In addition, dairying is crucial in providing assured employment and nutrition to farm family. In the mixed farming systems of India; milk production is predominantly the domain of small holders. The early history of fodder growing and utilization pattern is lost in the unwritten pages of time, pre-historic man had no need for such crops, since he supported himself as well as his family-members by picking fruit, digging roots, fishing, hunting, etc. it was until he started taming animals that necessitated fodder cultivation. The animals which inhabited the forests and field were numerous and of diverse types. Some preyed upon other animals, but mostly they were herbivorous. They probably fed on grasses, legumes, trees, bush leaves and other green and succulent plants. The first animals to be domesticated were those which still inhabit in the field of farmers. As mankind increases in numbers and tamed more and more animals, it become necessary to consider how could be fed the essential for maintenance, growth and reproduction. Since these animals were mostly herbivorous type, the primary need was for grasses and fodder crops (Meena, 1999) [16] . Unfortunately, dairy farmers of our country are still not well aware of importance of cultivating fodder crops which provides better nutrition to the animals in maintenance of their health and production. Even the farmers having adequate land holding that can be utilized for cultivating fodder crops, besides the cultivation of food grain and vegetables crops, do not seem to be enthusiastic/inclined towards cultivation of fodder crops. This situation is not good for dairy farmers, who have to depend solely on their dairy animals for their own livelihood because unless and until the dairy animals are fed with green fodder, the milk yield as well as productivity per animal will not increase substantially. However, of late, due to the efforts of governmental programmers' as well as other concerned agencies, the dairy farmers slowly and slowly are being motivated to think in this direction. Hopefully, in the long run this can contribute a lot towards improving the milk production of our country. As we know, India has become the top milk producing country in the world. Yet, the milk production per animal is www.extensionjournal.com still very low. Quantitative and qualitative insufficiency of feeds and fodders is one of the reasons for low productivity of milk and other animal products. "Green fodder production is the most important single factor for the success of animal husbandry programmes and prospects of achieving the target set forth for the production of different animal products". This necessitates increasing the area under fodder from 4.2 to 8.3 percent of cropped area (Kalam, 2010) [9] . The quality of fodder at a particular period is assessed by level of milk production. It is said that when animals feed good quality fodder, milk production will be enhanced. Feed & fodder constitute about 60-70 percent cost of milk production (Singh, 2005) [33] . Fodder crisis in the Rajasthan has been debated long back as it is seen a widening gap between increasing demand and decreasing supply due to diminishing resources. Thus, there is need to devise the way & evolve strategies and solutions to prevent large scale resource depletion which, leads negative effects on the process aimed at achieving sustainable development. A portion of its fodder requirement is also met by lopping and cutting of trees from the agricultural fields and homestead areas. It was estimated that major consumption of crop residue and green fodder varies in different seasons. This feed resource, which consists mainly of grasses, legumes and cereal crop residues vary widely and are spread across the major agro-ecological zones of the Rajasthan. The role of these forage and fodder crops in farming systems of Rajasthan is particularly reflected in their contribution to soil fertility and the sustenance of the livestock subsector of the nation's economy. Unfortunately, extensive areas of the grazing lands are composed of indigenous species, which are of low yield and quality. Hence, there is need to develop or adopt strategies, or technologies that will assist species to cope with and even overcome most of the factors which mitigate against high productivity. In the wake of drought conditions, the cattle population of Rajasthan is severely affected, especially due to acute scarcity of fodder and water in the state. It is essential to care the animals as they are more droughts prone. To solve the problem of fodder scarcity due to frequent severe droughts, special measures like subsidies are being used by the state government to increase the sowing area and production of fodder to meet the requirements in future. Presently, fodder is being transported from neighboring less affected districts/states. Transport charges are being borne by the state government, so that, in spite of price hike, people get fodder at reasonable rates (http://www.krishi.raj.gov.,2022). Presently, the importance of fodder production is fully recognized, particularly in the areas having more number of crossbred cows and high yielding indigenous breeds of cows and buffaloes. Milk can be produced at a cheaper rate, if milch animal fed with green fodder. However, due to everincreasing human population and pressing needs of most of the small and marginal farmers for food, fiber and commercial crops, the area under fodder could not increase during the last 20 years. Hence, the need for the development of fodder cultivation can be meet partially through the introduction of improved varieties and appropriate fodder cultivation practices (Meena, 2002) [19] .
Developmental agencies should also ensure the supply of good quality seeds at reasonable prices to the farmers in time. Fodder plays a critical role in the crop, livestock, and manure and soil nutrient cycle in traditional farms in the Rajasthan. Collection of fodder is the first step that turns the wheel of the agricultural economy of the village community. This complex interrelationship between forests, grasslands, livestock and crops in farming systems has contributed to the sustainability of agriculture for generations. Many researchers in recent years have indicated the reasons as to why farmers reject technologies; most important among them is lack of farming systems perspective by policy makers, scientists and extension staff. Hence, it is advocated to make researches more relevant to farmers' actual needs and problem with the help of farming systems approach (Johnson and Kellogg, 1984) [8] . It is disheartening to know that about 70 percent of recommended fodder improved practices have not been adopted by the farmers (Singh et al., 1995) [29] . The required quantity of fodder can be met with partially through the introduction of improved and/or appropriate fodder production practices. Innovativeness and adoption of improved practices at farmers' level can be increased when; the possible factors restricting or accelerating the process are well known and predictable. Fodder production technologies generated by research institutes are now becoming available but the mechanism for transferring it to the illiterate and small farmers in an effective manner does not exist. Decision of the farmers to adopt the technologies depends on the number of factors such as social, economical, cultural, situational, etc. Besides, this unavailability of inputs is perceived by the farmers as one of major factor in adoption. It is realized that in order to introduce new fodder production technologies successfully, it is necessary that the person engaged in dairy/fodder development programme should himself or herself be considered as motivator and become an active disseminator of the technologies. Fodder utilization pattern also play an important role in milk production. Most of the farmers are not aware about the proper utilization of fodder. So, it is imperative to know that what existing utilization pattern are and how that can be improved for proper utilization of fodder to maintain or enhance milk production of dairy animals.
Materials and Methods
The present study was purposively conducted in Semi-arid Zone of Rajasthan. Out of the four districts of this region, two districts namely Dausa and Tonk were selected purposively considering livestock minimum and maximum density. Two tehsils were selected randomly from each identified district and from each selected tehsil; three villages were selected randomly for the present study. Twenty respondents from each selected village were selected by proportionate random sampling methods. Thus, 240 dairy farmers constituted the sample size for this study.
Results and Discussion
Results and Discussion
Profile of the Respondents
The profile of the respondents in the present study highlights their personal variables as these were assumed to influence the knowledge level of improved fodder production practices and its utilization pattern. The distribution of respondents based on selected variables is presented in Table-1.
Age (in years)
The physical as well as mental working capacity of a person is influenced by the age. The experience gained in agriculture/ livestock enterprise is commonly reflected through age. Age of respondents is important in decision making, knowledge acquisition and utilization in farming which in turns influence productivity and profitability of the farm. It is evident from Table-1 that majority of the respondents (43.33%) belonged to middle age group followed by 32.92 and 23.75 percent of the respondents belonged to the old and young age groups; respectively. The mean age of the farmers was 47.91 years. The range clearly indicated that there were respondents with age as low as 30 years and as high as 82 years. It could be concluded that majority of the respondents were of middle age as young population was either involved in acquiring education or seeking the white collar job. The older population is not physically able to carry out the farming business under this condition. The middle aged population were involved in the farming profession to earn livelihood for their families. The results are in line with the findings of Vasant (2008) [30] ; Gupta (2011) [7] ; and Verma (2012) [31] ; they found that majority of the respondents belonged to the middle age category.
Family Size
The findings in Table-1 revealed that on an average each family has five members. Nearly half of the farmers had large sized family having more than 7 members. The 9.16 and 44.18 percent farmers were having small less than 3 members per family and medium 3-7 members sized family, respectively. Results show that majority of the respondents had large family as in Rajasthan still joint family system is prevailing. The range of the family members varied from 2-14. There were instance wherein the family size was as large as 14. It was concluded that 46.66 percent of the farmers had large size family having (more than 7 members). The findings have corroborated the past researcher's observations namely; Meena (1997) [17] ; Uma rani (2002) [32] and Singh (2003) [33] .
Education
Education is one of the most important factors which can accelerate the growth of farm business. Result presented in Table -1 clearly indicate that 23.33 percent of the respondents were illiterate followed by 17.50 percent of the respondents educated up to senior secondary level and 15.00 percent of the respondents were graduate or acquired the education beyond graduation. About 14.58 percent, 11.69 and 12.90 percent of the respondents educated up to secondary, primary and middle levels; respectively. A very less number of farmers i.e., 3.33 percent and 1.67 percent were appeared in 'can read only' and 'can read and write' categories; respectively. This level of literacy could be due to poor financial conditions, lack of good educational facilities in the rural areas, lack of awareness among the farmers about the importance and need of education and also of unavoidable necessity in the family to help their parents in farming instead of continuing school due to financial problems. Most of the farmers who were poor might have not sent their children for higher studies because poor economic condition of family forces them to earn for the bread & butter of the family as most of the higher educational facilities were available far away from the villages which was also one of the reasons for school dropout after the middle school level. These observations are in line with the findings of Pandey (1996) [22] ; Meena (2002) [19] ; Garai (2007) [3] and Raut (2010) [24] that were in their respective studies reported similar trend i.e., higher percentages of respondents were either illiterate or less educated
Occupation
To have an idea about the livelihood options of the respondents' household, a schedule was developed and respondents were categorized on the basis of their main occupation viz. dairy, agriculture, service, business and labour. Results in the Table-1, revealed that 37.92 percent of farmers engaged in agriculture + dairy + labour, 25.83 percent in agriculture + dairy + business, 17.08 percent in agriculture + dairy + service, 10.42 percent in agriculture with dairy,6.25 percent in agriculture + dairy + business + labour, whereas, about 2.50percent of respondents were engaged in agriculture + services + business in the study area. It could be concluded that the major occupation for livelihood in the study area was agriculture + dairy. The major farming profession they followed was agriculture along with dairy.
The finding is in agreement with the results of Gour (2002) [5] ; Patel (2005) [21] ; Chand (2011); Gupta (2011) [7] ; Verma (2012) [31] , they affirmed that majority of the respondents engaged in agriculture along with dairy.
Annual Income (Rs.) It has been observed that majority (72.91%) of the respondents were under medium annual income (Rs.56, 189-2, 07,814) category followed by (Rs.>2, 07,814) high and low (Rs. <56,189) income comprising of 15.42 percent and 11.67 percent of the farmers; respectively. In the study area, the mean of annual income was Rs.1, 31,966 with range of Rs.40000-3, 70,000. The probable reason for this might be due to the fact that the majority of the respondents were having medium herd size and land holding thereby they were unable to generate more income. Another reason may be the low productivity of crops due to prevalence of rain fed farming. The above finding is in line with the results of Prakash (2005) [20] ; Garai (2007) [3] ; Lokhande (2009) [12] ; Rani (2010) [23] and Singh (2013) [28] who found that majority of the respondents had medium level of annual income.
Extension Contact
Majority of the respondents (61.25%) belonged to medium category of extension contact, whereas, 22.50 and 16.25 percent of them had low and high level of extension contact; respectively. The mean score of extension contact was 3.94 with the range of 1 to 9 (Table-1). It was observed that government functionaries were less contacted as a source of information. This might be due to the less credibility attached by the farmers to them, un-cooperative attitude of the government personnel and lack of awareness among the farmers. This finding is consistent with previous researchers' findings, who reported that majority of the respondents were found in medium level of extension contact (Garai, 2007; Gaikwad, 2010 & Singh, 2013) [3,4,28] .
Figure in parenthesis indicates percentage
From Table-3 it can be observed that Assistant Agriculture Officer (ranked first) were used as a source of information from whom the farmers tried to clear their doubts and get the information about fodder production practices. This was also probably due to the fact that Assistant Agriculture Officer regularly visited the village as compared to others. This was followed by LSA (II), Dairy personnel (III), AO (IV), VAS (V), Scientists/SMS (VI), VDO (VII) and BDO (VIII). It employed that livestock assistant was the most contacted person as for as dairy farming was concerned. It might be due to the fact that easy accessibly of them to the farmers as they were residing in the villages.
Mass Media Exposures
The distribution of the farmers according to their mass media exposure is given in Table -1 which shows that most of the (47.50%) of respondents had a low level of mass media exposure, whereas, 40.41 percent respondents belonged to the medium mass media exposure category followed by 12.09 percent belonged to the high mass media exposure category. The mean score of mass media exposure was found to be 3.40 with range of 0-8. It can be concluded that respondents were having low level of mass media exposure as various mass media like newspapers, magazines, etc. focusing on agricultural programmes caters the need of the respondents who were literate. Further, government's line departments are not emphasizing on www.extensionjournal.com fodder development programmes. The finding is in line with the findings of Verma (2012) [31] . A glance at
Milk Production (in liters)
The Table-1, revealed that majority (68.75%) of the farmers fell in medium category of milk production, (producing 4.0 to 13.0 liters per day) followed by 16.68 and 14.57 percent of them belonged to low (producing less than 4.0 liters per day) and high (producing more than 13 liters per day) categories of milk production; respectively. On an average each household produced around 8.70 liters of milk per day ranging between 3-24 lit./day/household. It could be concluded that majority of the farmers (68.75%) were producing 4-13 liters of milk per day which was observed to be less to sustain their livelihood. It may be attributed to the low quality and quantity of the feed and fodder provided to the animals. The results of this study were in line with the findings of Sachan (2013) [25] ; Sah (2005) [26] , Meena (2000) [18] and Kumar et al. (2009) [11] .
Land is considered as one of the important socio-economic indicators in agricultural sector and rural development. Land is one of the important scarce resources and important factor, which has bearing on the cattle and buffalo rearing, since lands provide good resource base. The land size and volume of milk production is directly related with the gross income of the farmers. Regarding the land holding, it could be observed from Table -1 that the 35.83 percent of the respondents were having semi-medium land holding (2.01 to 4.0 ha.) and 29.59 percent farmers had small land holdings (1.01-2.0). There were 16.25 percent of respondents, who were having medium land holdings (4.01 to 10.0 ha.). On the other hand, 8.33 percent respondents were having large land holdings (>10.0 ha.). There were no respondents in landless category. The average land holding size of the farmers of the study area was formed to be about 6.54 hectares with a range of 1-18 hectares which indicate that there is a large variation among the respondents in respect of land holding. Most of the farmers possessed and found operating small to semimedium land holdings. This might be due to the fragmentation of the land holdings. The above findings are in contrast to the findings of Raut (2010) [24] , Mande et al.
(2008) [15] who found that most of the respondents had medium size of land holding.
Herd Size
The production and productivity of milch animal varied and considerably depended on the type of animal breed maintained. Rearing of cattle has always remained as a www.extensionjournal.com symbol for honour in the farming community. The classification of respondents with respect to total herd size has been presented in Table-1. It was clearly enunciated that 63.33 percent of farm families maintained medium herd size (3 to 6 animals), whereas, the remaining 20.00 and 16.67 percent have small (up to 2 animals) and large (more than 6 animals) herd size; respectively. The average herd size was 4 animals but few farmers were rearing dairy animals up to 14 animals this indicated that there is a large variation among the respondents about herd size. This may be due to fact that farmers of study area were having small land size, moreover, pressures of food crops on the farmers to earn food for their livelihood and other domestic needs. More intensity of cropping is also not possible due to rainfed conditions.
Lean Period of Green Fodder
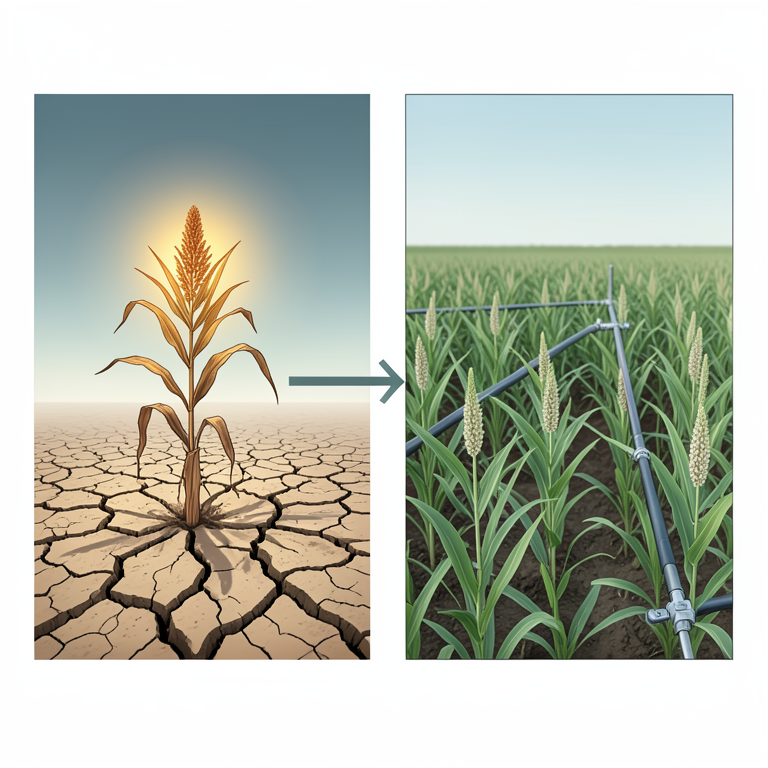
Result presented in Table-1 show that there were 71.66 percent of the respondents felt that period of green fodder deficit was from March to June, whereas, 19.16 percent respondents expressed that the September to February and 9.18 respondents felt July to October as lean period for the green fodder. Same results were also reported by the Kamala Kant (2014) [10] . It can be concluded that the deficit of green fodder for the period of March to June in the sample area is due to low rainfall, non-availability of irrigation facilities, lack of quality seed and most of the farmers are practicing rainfed farming.
Conclusion
Conclusion
Acknowledgement
AcknowledgementsThis research was conducted in National Dairy Research Institute, India. This research was supported by research grants from University Grant Commission, Ministry of Human Resources development, India and Indian Council of Agriculture Research, Ministry of Agricultural and Farmer Welfare, India. We gratefully thank our research team and respondents for their helps on
Figures and tables from the paper
| S. No. | Variables | Categories | Frequency | Percentage |
|---|---|---|---|---|
| 1 | Age (in year) (Mean = 47.91) (Range = 30-82) | Young (up to 35) | 57 | 23.75 |
| Middle (36-50) | 104 | 43.33 | ||
| Old(above50) | 79 | 32.92 | ||
| 2 | Family size (Mean = 5) (Range = 2-14) | Small (<3) | 22 | 09.16 |
| Medium (3-7) | 106 | 44.18 | ||
| Large (>7) | 112 | 46.66 | ||
| 3 | Education | Illiterate | 56 | 23.33 |
| Can read only | 8 | 03.33 | ||
| Can read &write only | 4 | 01.67 | ||
| Primary | 28 | 11.69 | ||
| Middle | 31 | 12.90 | ||
| Secondary | 35 | 14.58 | ||
| Senior secondary | 42 | 17.50 | ||
| Graduate and above | 36 | 15.00 | ||
| 4 | Social Participation (Mean = 1.05) (Range = 0-3) | Low (<0.42) | 39 | 16.25 |
| Medium (0.42-1.7) | 152 | 63.33 | ||
| High (>1.7) | 49 | 20.42 | ||
| 5 | Occupation | Agriculture + Dairy | 25 | 10.42 |
| Agriculture + Dairy + Business | 62 | 25.83 | ||
| Agriculture + Dairy + Services | 41 | 17.08 | ||
| Agriculture + Dairy + Labour | 91 | 37.92 | ||
| Agriculture + Services + Business | 6 | 2.50 | ||
| Agriculture + Dairy + Business + Labour | 15 | 6.25 | ||
| 6 | Annual income (`) (Mean = 1,31,966) (Range = 40,000-3,70,000) | Low (<`56,189) | 28 | 11.67 |
| Medium(56,189-2,07,814) | 175 | 72.91 | ||
| High (>`2,07,814) | 37 | 15.42 | ||
| 7 | Extension Contact (Mean = 3.94) | Low (<2.15) | 54 | 22.50 |
| Medium (2.15-5.72) | 147 | 61.25 |
Table text extracted from the original PDF; superscript letters are shown inline. The original table image is below.
View original table image
| S. No. | Social Participation | Participation | — | — | — |
|---|---|---|---|---|---|
| Office bearer | Member | Score | Rank | ||
| 1 | Gram Panchayat | 4 (1.66) | 23 (9.59) | 27 (5.62) | II |
| 2 | Panchayat Samiti | 1 (0.41) | 9 (3.75) | 10 (2.08) | VI |
| 3 | Zila Parishad | 0 (0.00) | 2 (0.83) | 2 (0.41) | VIII |
| 4 | Agri. Cooperative society | 3 (1.25) | 19 (7.91) | 22 (4.58) | IV |
| 5 | Milk cooperative society | 1 (0.41) | 24 (10.00) | 25 (5.20) | III |
| 6 | Religious committee | 2 (0.83) | 39 (16.25) | 41 (8.54) | I |
| 7 | Political organization | 0 (0.00) | 10 (4.16) | 10 (2.09) | V |
| 8 | Rural youth club/NGO’s | 7 (2.91) | 2 (0.83) | 9 (1.87) | VII |
| Overall Social Participation (%) | 0.93 | 6.66 | 3.79 |
Table text extracted from the original PDF; superscript letters are shown inline. The original table image is below.
View original table image
| S. No. | Extension agencies | Weekly | Fortnightly | Monthly | As and when required | Weighted Score | Rank |
|---|---|---|---|---|---|---|---|
| 1 | VDO | 4 (1.66) | 2 (0.83) | 5 (2.09) | 22 (9.16) | 54 (5.62) | VII |
| 2 | LSA | 5 (2.09) | 15 (6.26) | 34 (14.16) | 97 (40.41) | 230 (23.95) | II |
| 3 | VAS | 2 (0.83) | 4 (1.66) | 21 (8.75) | 79 (32.91) | 141 (14.68) | V |
| 4 | BDO | 6 (2.50) | 2 (0.83) | 3 (1.25) | 9 (3.75) | 45 (4.68) | VIII |
| 5 | Dairy personnel | 10 (4.16) | 19 (7.91) | 15 (6.25) | 45 (18.75) | 172 (17.91) | III |
| 6 | Scientists/ SMS | 9 (3.75) | 4 (1.66) | 2 (0.83) | 7 (2.91) | 59 (6.14) | VI |
| 7 | AO | 9 (3.75) | 12 (5.00) | 6 (2.50) | 32 (13.33) | 116 (12.08) | IV |
| 8 | AA O | 14 (5.83) | 27 (11.25) | 44 (18.33) | 65 (27.08) | 290 (30.20) | I |
Table text extracted from the original PDF; superscript letters are shown inline. The original table image is below.
View original table image
| S. No. | Statements | Regular | Some time | Weighted score | Rank |
|---|---|---|---|---|---|
| 1 | Are you listening A.I.R., krishi jagat programme etc? | 10 (4.16) | 78 (32.50) | 98 (20.41) | IV |
| 2 | Are you seeing the krishi Darshan programme at T.V.? | 65 (27.08) | 101 (42.08) | 231 (48.12) | II |
| 3 | Are you member of any Dairy/Agri. Journal? | 0 (0.00) | 5 (2.08) | 5 (1.04) | XII |
| 4 | Have you come across any pamphlet/leaflet etc. regarding Dairying? | 4 (1.66) | 3 (1.25) | 11 (2.29) | IX |
| 5 | Do you read any newspaper? | 125 (52.08) | 55 (22.91) | 305 (63.54) | I |
| 6 | Dairy mela/Kishan mela | 25 (10.41) | 35 (14.58) | 85 (17.70) | VI |
| 7 | Cattle show | 2 (0.83) | 38 (15.83) | 42 (8.75) | VII |
| 8 | Dairy Exhibition | 0 (0.00) | 3 (1.25) | 3 (0.62) | XII |
| 9 | Farmer’s Day | 0 (0.00) | 4 (1.66) | 4 (0.83) | XI |
| 10 | Demonstration | 40 (16.66) | 55 (22.91) | 135 (28.18) | III |
| 11 | Calf Rallies | 5 (2.08) | 15 (6.25) | 25 (5.20) | VIII |
| 12 | Group Discussion | 27 (11.25) | 32 (13.33) | 86 (17.91) | V |
| 13 | Research Farm | 5 (2.08) | 12 (5.00) | 22 (4.58) | X |
Table text extracted from the original PDF; superscript letters are shown inline. The original table image is below.
View original table image
References
11 in the original paper- Gupta RK, Kaushal T, Pathania MS. A study on the status of fodder balance in Himachal Pradesh. Oecologia Montana. 1998;37(2):39-42.
- Kumar BG, Senthil R, Venkatesh P, Raja R, Jayakumar V, Jeyakumar S. Socio-economic impact assessment of livelihood security in agriculture, animal husbandry and aquaculture on the tsunami-hit lands of Andaman. Agricultural Economics Research Review. 2009;22(4):283-294.
- National Small Industries Corporation. Project profiles: DAIRY FARMING. Available from: http://www.nsic.co.in/schemes/documents/project profiles/DAIRY percent 20FARMING.pdf. Accessed 2022.
- National Small Industries Corporation. Project profiles: DAIRY FARMING. Available from: http://www.nsic.co.in/schemes/documents/project profiles/DAIRY percent 20FARMING.pdf. Accessed 2013.
- Mande JV, Rajput RD, Thombare BM. Knowledge of cattle owners about improved cattle rearing practices. J www.extensionjournal.com Dairying Foods Home Sci. 2008;27(1):38-42.
- Meena BS, Malik BS. Farmers' Knowledge and extent of adoption regarding improved fodder cultivation practices. Dairying Food Home Sci. 1999;18(1):64-66.
- Meena BS, Malik BS. Constraints experienced by the farmers in growing fodder crops. Dairying Food Home Sci. 2000;18(2):1-4.
- Singh M, Dwivedi RN, Meena BS, Sharma P, Pandey S, Sharma RK, Upadhyay P. Performance of year round fodder production under on farm situation. Range Manag Agrofor. 2007;28(2):202-203.
- Karnal, Haryana: NDRI; 2013.
- Umarani K. Technological needs of women in dairying. Manage Ext Rev. 2002;3(1):117-122.
- Singh J. Collaborative networks as determinants of knowledge diffusion patterns. Management science. 2005 May;51(5):756-770.
Social Participation
It could be seen from the Table-1 that the majority (63.33%) of the farmers had medium level of social participation followed by 20.42 percent of farmers had high level of participation in social activities and only 16.25 percent of them had low level of social participation. The mean of social participation was 1.05 with range of 0-3. Singh (2005) [33] found that majority of the farmers were having low level of social participation. The finding differs due to socio-economic differences. level of social participation, however, their distribution as per as different organization is concerned it was found to be the similar. Further, their participation in religious activities was found to be more and this might be due to the social values and custom which employs that the population of the study area is more religious. Moreover, the respondents of the study area were their assist bearer or members at three levels of www.extensionjournal.com Panchayat Rajasthan.