
Research article · 2024 · Full text
International Journal of Agriculture Extension and Social DevelopmentEvaluating the global competitiveness of Namibia grape industry insights strategies for growth
Volume 7(5) · Pages 249–261 · DOI: 10.33545/26180723.2024.v7.i5d.638 ↗
Research areasGlobal Trade and Competitiveness
Abstract
Author-writtenThe Namibian table grape industry, a burgeoning sector within the agricultural economy, is recognized for its rapid growth and substantial contribution to employment and foreign exchange earnings. Despite its upward trajectory, the industry's global competitive landscape has remained underexplored, marking a significant research gap. This paper aims to dissect the competitive dynamics of the Namibian grape industry, offering insights into its global standing and potential for growth. Employing a mixed-method approach, the study employed the normalized revealed comparative advantage (NRCA) methodology to analyse trade data from the International Trade Centre database from 2003 to 2022, coupled with insights from a comprehensive survey of industry executives based on Porter's Diamond Model. Research reveals that while Namibia holds a competitive position in the global grape market, it trails behind leading producers such as Chile, Peru, and South Africa, largely due to the nascent stage of its industry. A key finding is the industry's competitive advantage stemming from favorable climatic conditions that facilitate early grape ripening, access to top-tier infrastructure, and entry into lucrative markets. However, the high costs of establishing and maintaining essential vineyard infrastructure are significant barriers. The study's pivotal takeaway is the industry's untapped potential, contingent upon strategic interventions in local capacity building, market diversification, and enhanced industry collaboration. These findings underscore the imperative for targeted strategies to bolster the global competitiveness of Namibia's table grape industry, thereby fostering economic growth and sustainable development.
Summary
Source-checkedPlain-language reading of the full paper, prepared with AI and checked against the text. Each point links to the authors' own words.
Why it matters
- The Namibian table grape industry is a rapidly growing agricultural sector that significantly contributes to the country's employment and foreign exchange earnings. View evidence ↗
- The industry has seen massive growth, with export volumes increasing from 1,917 metric tons in 1997 to 33,336 tons by 2021, and earnings rising from NAD 59,971 million in 2003 to NAD 1,173,483 billion in 2022. View evidence ↗
- Namibia's arid climate allows grapes to ripen early, enabling the country to supply international markets during the Northern Hemisphere's off-season. View evidence ↗
The question
- The study aims to analyze the competitive dynamics and global standing of the Namibian grape industry to identify growth potential. View evidence ↗
What they did
- The researchers used a mixed-method approach, applying the normalized revealed comparative advantage (NRCA) to analyze International Trade Centre trade data from 2003 to 2022. View evidence ↗
- Primary data was gathered via the Grapes Industry Executive Survey (GIES) in July 2019, with a 67% response rate from 8 out of 12 grape production companies. View evidence ↗
- Industry executives ranked factors influencing competitiveness based on the framework of Porter's Diamond Model. View evidence ↗
What they found
- Analysis of NRCA figures indicates that Namibia maintained a competitive edge in the cultivation and trading of table grapes throughout the study period. View evidence ↗
- Despite its competitive position, Namibia's grape industry trails behind global leaders like Chile, Peru, and South Africa. View evidence ↗
- Of 73 identified factors influencing the industry, 51% were positive contributors to competitiveness, 31% were neutral, and 18% were impediments. View evidence ↗
- Political stability and predictability in Namibia were identified as the primary factors enhancing the industry's competitiveness. View evidence ↗
- Key constraints include high costs for vineyard infrastructure, reliance on imported inputs, corruption, and a lack of local research institutions. View evidence ↗
- Domestic marketing of fresh grapes is unviable due to Namibia's small population, high poverty rates, and lack of a local consumption culture. View evidence ↗
What it means
- The authors conclude that Namibia's climate, strategic market positioning, and policy support provide a strong foundation for future global competitiveness and growth. View evidence ↗
- The authors recommend fostering partnerships with local research institutions to develop tailored technologies and reduce dependence on imports. View evidence ↗
Visual summary
1 visualsIllustrations explain the paper; they do not show study data.
Industry Factor Distribution
AI-generated conceptual illustration (Namibian grape vines and clusters). It explains the idea and does not show study data.
View source evidence ↗Figures & tables
From the original paper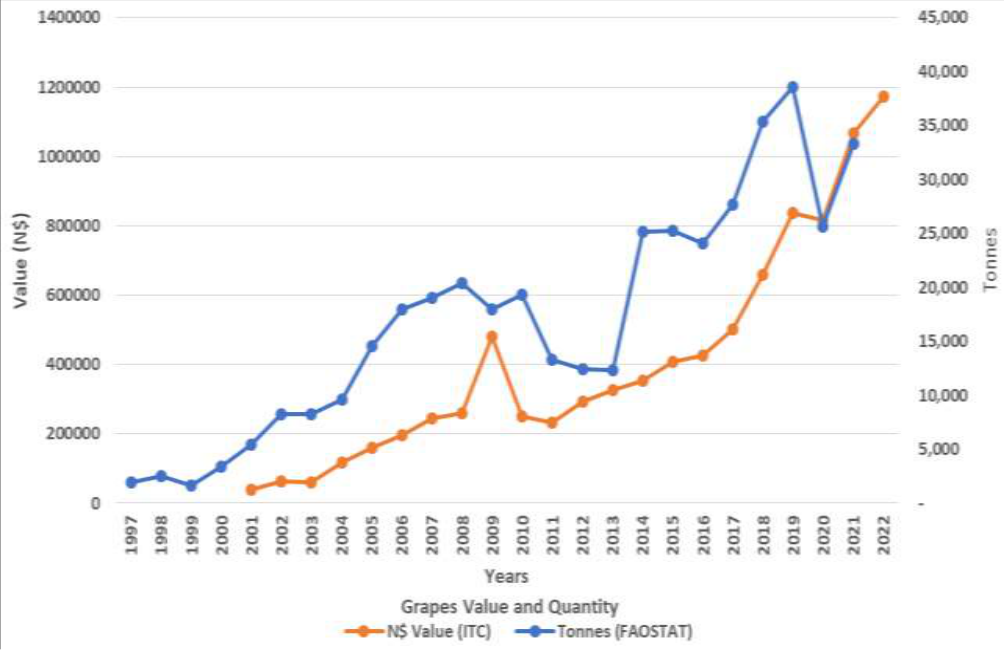 Figure 1
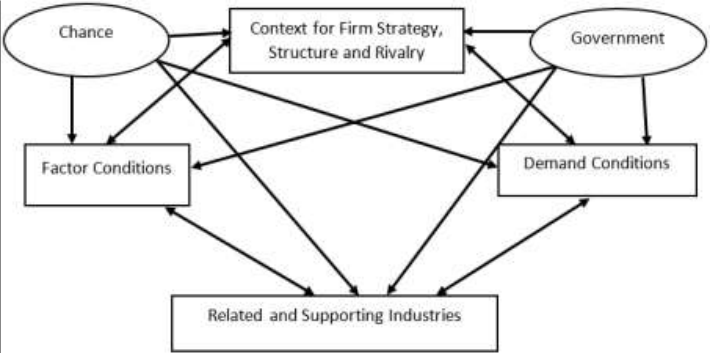 Figure 2
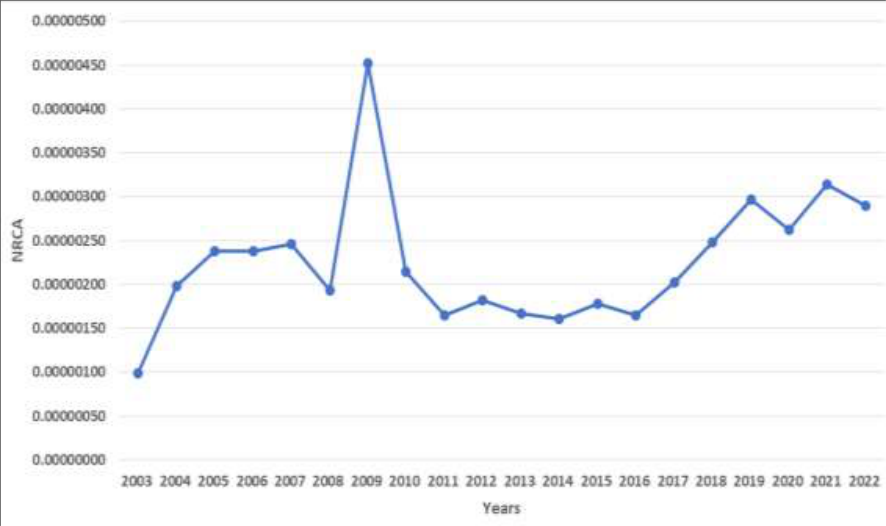 Figure 3
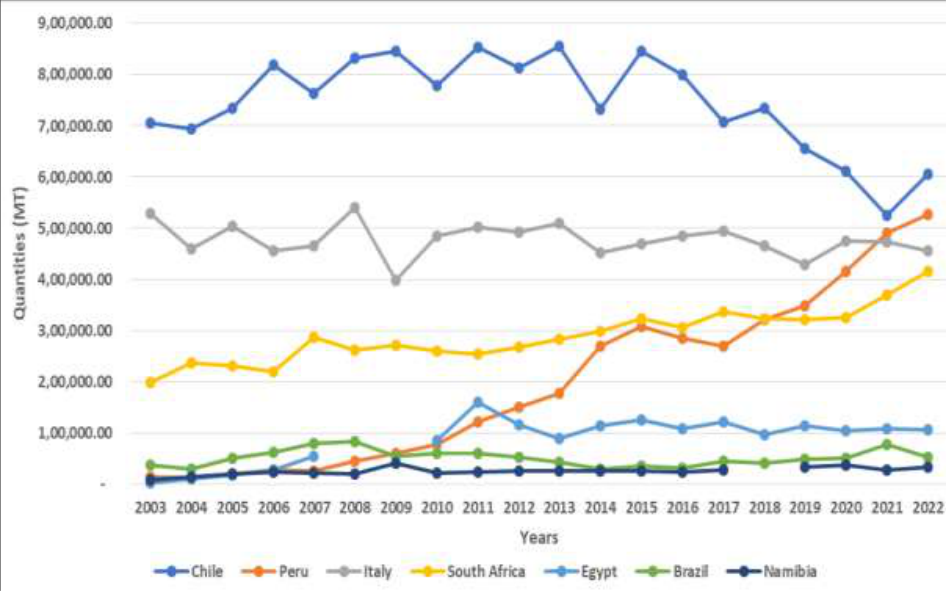 Figure 4
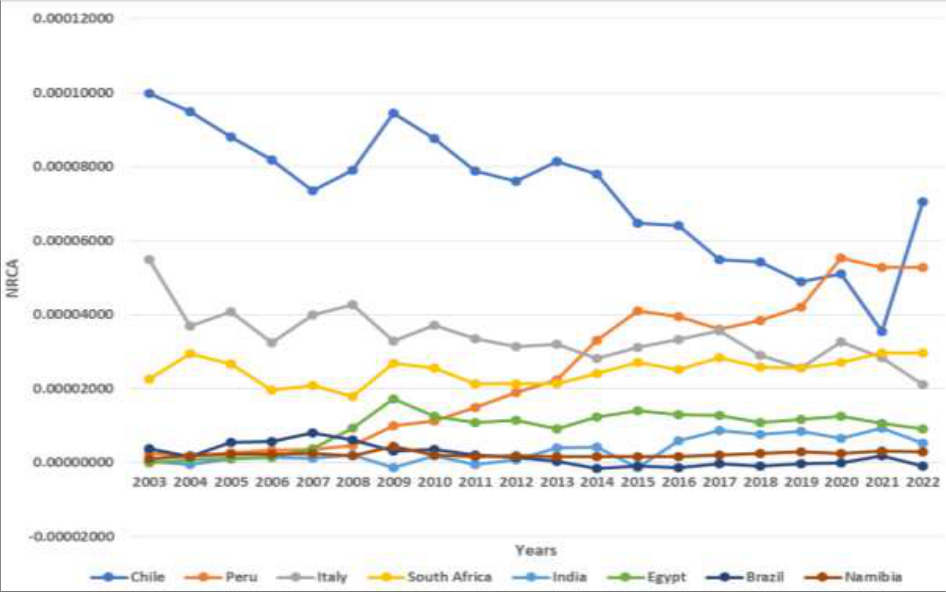 Figure 5
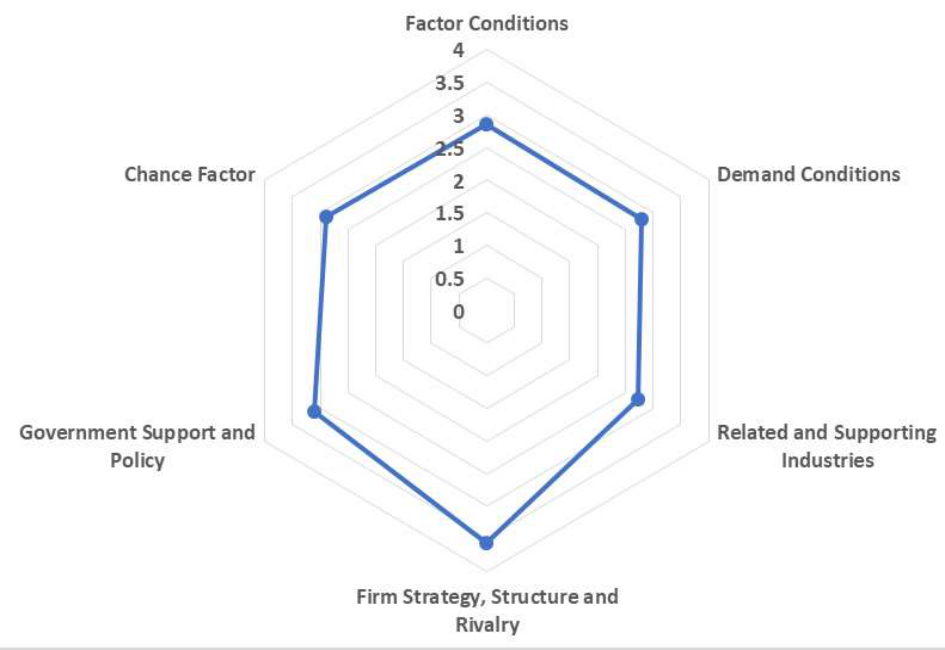 Figure 6
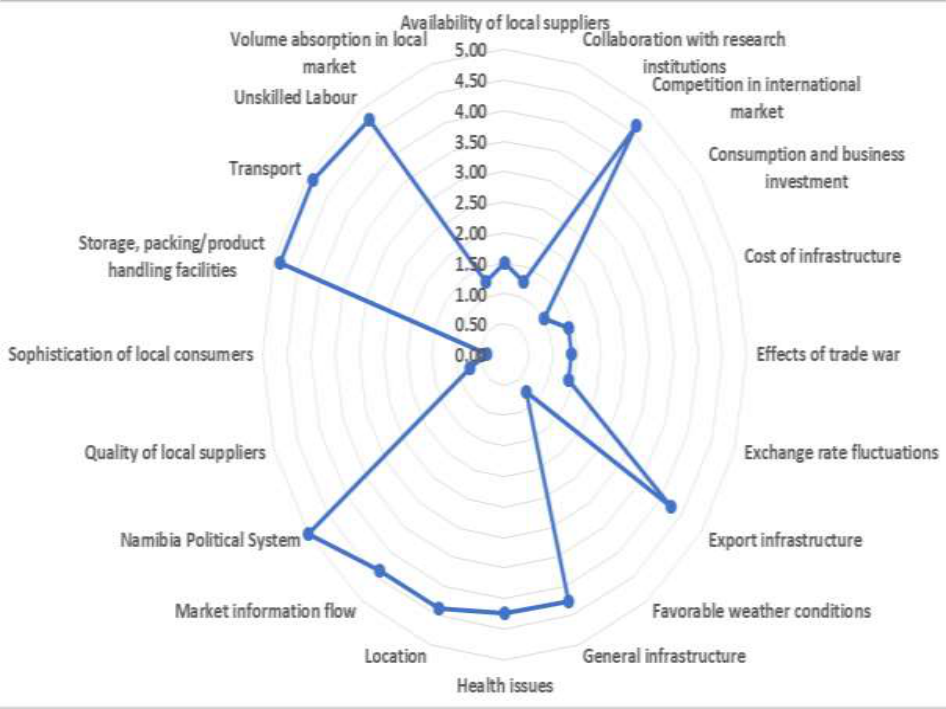 Figure 7
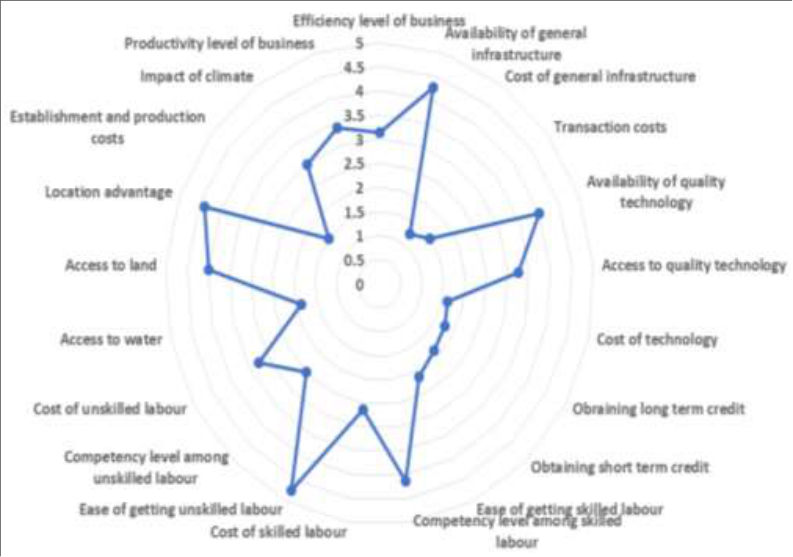 Figure 8
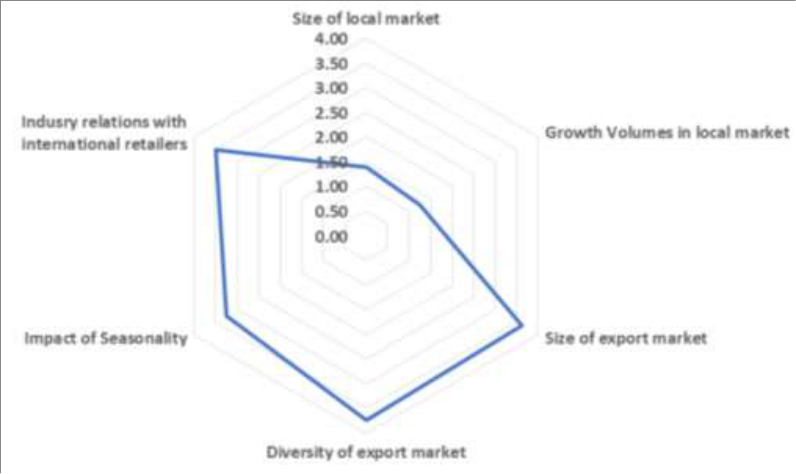 Figure 9
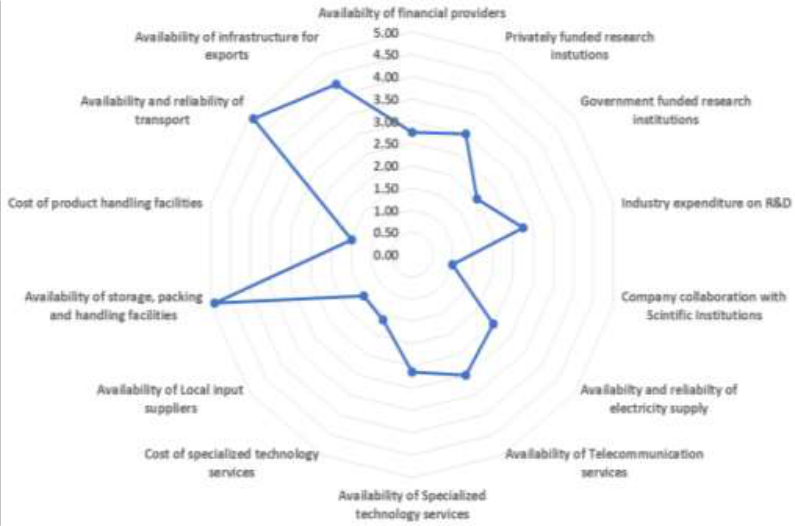 Figure 10
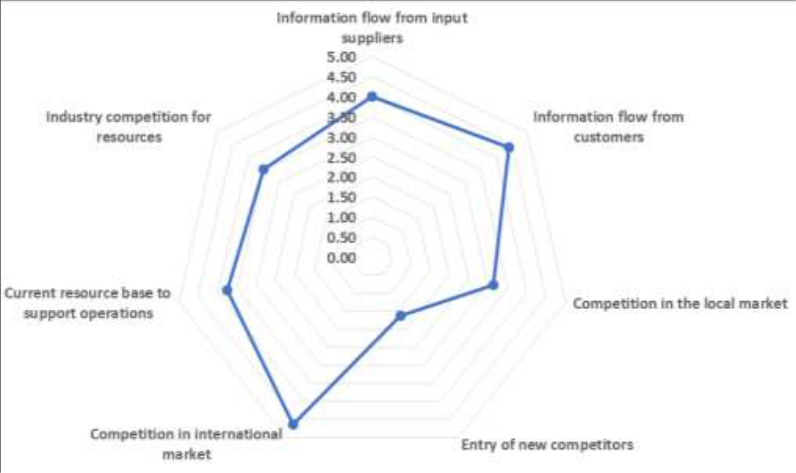 Figure 11
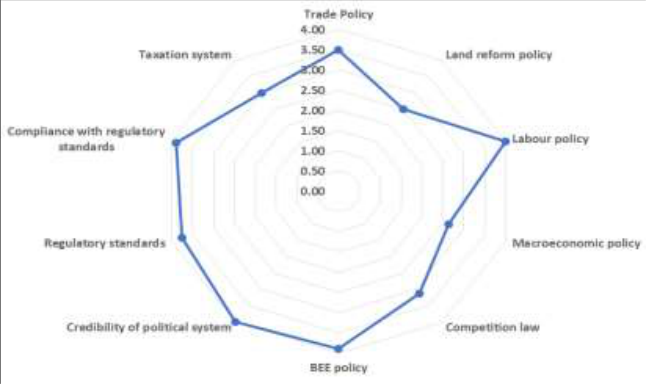 Figure 12
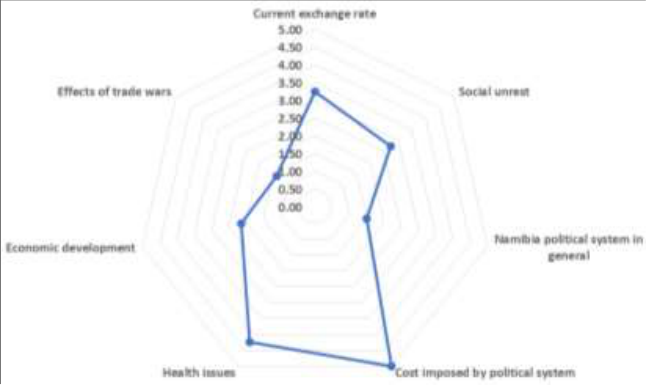 Figure 13
Introduction
Since its inception in 1988 along the verdant stretches of the Orange River, the Namibian table grape industry has emerged as a pivotal sector within the nation's agricultural economy, showcasing an impressive trajectory of growth and economic contribution. From an initial export volume of 1,917 metric tons in 1997, the industry's output expanded significantly to 33,336 tons by 2021, as highlighted by the Food and Agriculture Organization (FAO, 2023) [2] . This growth in production volume is mirrored by a notable increase in economic value, with grape export earnings rising from NAD 59,971 million in 2003 to NAD 1,173,483 billion in 2022, marking the industry's substantial role in enhancing Namibia's foreign exchange earnings (International Trade Centre, ITC, 2023) [3] . The industry's impact extends beyond economic metrics, contributing to the socioeconomic landscape through the creation of approximately 5,500 permanent and 6,000 casual jobs by 2015, thereby addressing employment needs within the country (Tjitombo, 2021) [14] . Globally, Namibia ranks as the 17th largest producer of table grapes, holding approximately 0.77% of the global trade value in 2022, a position that underscores the potential for growth and greater market share among dominant producers such as Chile, Peru, and South Africa (ITC, 2023) [3] . The industry's susceptibility to fluctuations in export markets, notably the downturn in 2020, was influenced by the COVID-19 pandemic, highlighting the need for adaptive strategies and resilience in navigating global market dynamics. The distinctive climatic advantages of Namibia provide a competitive edge for grape cultivation. The region's arid climate, characterized by minimal rainfall and hot, dry summers, is conducive to grape production, facilitating early ripening and enabling Namibian grapes to reach international markets during the Northern Hemisphere's off-season. This strategic positioning during November and December, when the grape supply is limited, offers a unique opportunity for Namibian grapes to penetrate markets with minimal competition, capitalizing on seasonal demand (Thomas, 2007; Tjitombo, 2021) [13,14] . Despite these advantages, the industry faces several challenges that necessitate strategic intervention. High capital investment is required for infrastructural development, and there is a heavy reliance on imported technology coupled with the complexities inherent in international trade. Addressing these challenges is crucial for enhancing the industry's competitiveness and sustainability. A comparative analysis of leading grapeproducing countries unveils strategies and practices that contribute to their success, including investments in www.extensionjournal.com advanced agricultural technologies, efficient logistics, and market expansion efforts. South Africa's integration of the table grape industry with its established wine sector also presents a model worth considering for potential synergistic growth in Namibia. To advance its position in the international market, the Namibian table grape industry must leverage its climatic and strategic advantages while tackling existing challenges. This involves embracing technological advancements to reduce import dependency, diversifying export markets to mitigate concentration risks, and improving infrastructural and logistical capabilities. Additionally, fostering public-private partnerships and securing government support for research and development can catalyze innovation and reinforce the industry's resilience against external shocks, paving the way for sustainable growth and enhanced global market presence. Figure 1 provides a visual representation of the performance of the Namibian Table grape industry over a span of 24 years, highlighting the interplay between the export value in Namibian dollars and the quantity of exports in tons. A consistent upward trend is observed in both metrics, suggesting a robust expansion of the industry. The sharp increase in both value and quantity after 2009 is particularly striking, indicating a period of significant growth that could be attributed to factors such as technological advancement, expansion into new markets, or favorable trade conditions. However, the graph also reveals instances of volatility, most notably the spike in export value in 2009, which is not mirrored in the quantity exported. This discrepancy could be the result of various external economic factors, including fluctuations in global prices, changes in currency valuation, or shifts in the export product mix toward higher-valued varieties. There is an apparent divergence between the growth rates of export value and quantity starting in approximately 2011, with the export value rising more rapidly. This could suggest an increase in the unit price of grapes, potentially due to enhanced quality, better market positioning, or a shift toward premium grape varieties that fetch higher prices on the international market. A correlation between the export value and quantity is evident, reinforcing the notion that increased production is likely contributing to the rise in overall export value. However, the cyclic nature of the quantity exported, possibly reflective of environmental or market demand cycles, points to the industry's sensitivity to external factors. The graph's reliance on data from ITC and FAOSTAT lends credibility to the depicted trends. Nonetheless, the discrepancies between value and quantity at certain intervals highlight the complexity of economic analysis and the need to consider a broad range of factors when interpreting such data. The graph's trajectory suggests positive economic outcomes for Namibia, with potential implications, including increased investment, job creation, and a focus on policy initiatives tailored to sustain the industry's growth. The depicted trends and anomalies offer a basis for further research into the factors driving these patterns, as well as for policy recommendations aimed at stabilizing and sustaining industry growth through market diversification and value chain development. In sum, the graph indicates a prosperous industry with opportunities for continued expansion while also suggesting areas for strategic development to reinforce Namibia's position in the global table grape market. 1.1 Adopted: Own Computation using ITC and FAOSTAT Data Grape cultivation in Namibia commenced in 1988 along the Orange River, mainly targeting the European market, which experiences a seasonal scarcity of this fruit during November and December, a period when Northern Hemisphere production is off-season (Thomas, 2007; Tjitombo, 2021) [13,14] . Initiated on a modest scale, the industry had expanded to cover approximately 2000 hectares of irrigated land by 2014, indicating significant growth in production capacity (Munyika et al., 2014) [6] . Numerous studies have delved into the economic aspects and profitability of Namibia's grape sector, yet its global competitive edge remains underexplored. This study aims to fill this gap by examining how sustainable farming practices can elevate the industry's international profile. It will explore the potential of these practices to enhance climate resilience, water efficiency, and reduce dependence on foreign technology, ultimately assessing their impact on the competitive positioning and sustainability of Namibia's table grape industry. The purpose of this study is to analyse the performance of the Namibian Table grape industry and identify the factors that contributed to such performance using trade data from 2003 to 2022.
Research Methodology 2.1 Study Area
Grape cultivation in Namibia was initiated in the Aussenkehr area within the Hardap Region in 1988, during which the plants took root along the Orange River. However, not until 1997 did grape production begin to scale up substantially (Thomas, 2007) [13] . The region is characterized by an arid climate with hot, dry summers, which is optimal for grape cultivation, and receives scant annual rainfall, typically less than 50 mm (Nangolo, 2021; Rosengarten, 2023) [7,12] . The geographic footprint of grape production has since broadened, extending into the Hardap District, which is bolstered by the Hardap irrigation scheme located approximately 600 kilometers from the Orange River. Additionally, grape cultivation activities have been reported in the vicinity of the Naute Irrigation Scheme, close to Keetmanshoop, albeit on a smaller scale (Thomas, 2007) [13] .
Data collection
To analyse the competitive performance of the Namibian table grape industry, this study utilized trade data from the International Trade Centre spanning from 2003 to 2022 (ITC, 2023) [3] . These time-series data provided a quantitative foundation for assessing trends and growth patterns over the specified period. To supplement the quantitative data and identify factors contributing to industry competitiveness, primary data were collected through the Grapes Industry Executive Survey (GIES). Conducted in July 2019, just before the global outbreak of COVID-19, the GIES sought to capture industry leaders' insights regarding competitive factors based on Porter's Diamond Model. A total of 12 grape production companies were included, 8 of whom provided responses, for a response rate of 67%. It is important to note that the findings from this survey predate the impact of the COVID-19 pandemic and, as such, do not reflect any subsequent changes or challenges posed by the global health crisis.
Data analysis 2.3.1 Measuring Competitive Performance
Balassa (1965) [1] Revealed Comparative Advantage (RCA) is popularly used to measure trade competitiveness. The RCA is represented as follows:
(1) where X represents exports; k denotes all commodities other than commodity j; and n denotes all countries other than country i. An RCA greater than 1 indicates that the country has a comparative advantage in the commodity under consideration, indicating a strong export sector and revealing high export competitiveness. This index is defined as the ratio of a country's share of a certain product in the world market to the same country's share of the world exports of all other commodities. However, the RCA index suffers from scale and structural effects in which the size of the economy and economic transition characteristics makes it difficult to make temporal and spatial comparisons (Pitts et al., 1995) [8] . Yu et al. (2009) [16] developed the normalized revealed comparative advantage (NRCA) index, which allows for spatial and temporal comparisons of countries and industries' competitiveness. The distinctive properties of NRCA include that it is scale neutral and that the index is asymmetrically distributed (Yu et al., 2009) [16] . The NRCA can be written as: (2) where X ij represents the total exports of commodity j for country i, X j represents the total world export of commodity j, X i represents the total exports of country i, and X w represents total global exports. A NRCA index > 0 indicates a comparative advantage, while a NRCA < 0 indicates a comparative disadvantage. The values of NRCA show the magnitude of advantage or disadvantage. The NRCA index shows how a country's exports of a commodity deviate from its average trade performance for all commodities.
Identifying the Determinants of Competitive Performance
The NRCA shows how an industry performed over time but gives no indication of which factors are responsible for that performance. The GIES data were analysed to determine which factors enhanced or constrained the observed performance. Experts/executives were asked to rank various factors that influenced the competitive performance of their companies based on Porter's Diamond Model. Michael Porter (1990, 1998) [10][11] introduced the Diamond Model, which comprises six foundations for competitiveness that characterize the business environment in industries where companies operate. These factors, combined with companies' capabilities and resources, determine their competitiveness. These foundation factors, also known as determinants of competitiveness, are shown in Figure 2 below. www.extensionjournal.com The diamond model is used to assess the quality of the business environment in an industry. The model is premised on an assumption that sources for competitive advantage are found in the business environment in which businesses operate. There are four determinants of competitiveness, namely, factor conditions, demand conditions, the context for business strategy and rivalry, and related and supporting industries. The GIES asked executives in the Namibian grape industry to rank specific factors relating to these determinants based on availability, accessibility, quality, and costs associated with these determinants.
Results and Discussion
Results and Discussion
Competitive Performance of the Namibian Table Grape Industry
One of the objectives of this study was to evaluate the competitive standing of the table grape sector in Namibia. To achieve this goal, trade data sourced from the International Trade Centre were analysed to gauge industry performance. As illustrated in Figure 3, the analysis reveals that Namibia holds a competitive edge in both the cultivation and trading of table grapes during the examined period, as evidenced by favorable NRCA figures. Figure 4 shows the export volumes for seven countries, namely, Chile, Peru, Italy, and South Africa, which are recognized as leading global exporters of table grapes. Along with South Africa, Egypt is also highlighted as a significant African exporter within the top 20 global exporters. Brazil's inclusion is due to its export volumes being comparable to those of Namibia. [9,15] . The competitive advantage of the grape sector is strongly influenced by factors such as improvements in infrastructure and technology, the presence of water resources, the availability of fertile land, and reforms in agricultural policy (Mtshiselwa, 2020) [5] . Lashkari et al. (2022) [4] emphasized that Peru enjoys favorable conditions that enhance the production of large quantities and excellent quality table grapes. This is due to the favorable business environment, permissive land ownership policies, relatively low labor costs, and advantageous trade agreements established in the early 2000s. Chile's table grape sector, which has a competitive approach, encounters obstacles such as limited water availability, intense competition from other agricultural products, and the consequences of climate change (Verdugo-Vásquez et al., 2023) [15] . www.extensionjournal.com Data Source: International Trade Centre.
Data Source: International Trade Centre
Data Source: International Trade Centre
Determinants of Competitive Performance
During the survey of executives in the Namibian table grape sector, 12 businesses operating in this industry were found. Of these, executives from 8 grape companies participated in the survey, representing a response rate of 67%. The poll was specifically created to involve high-level executives inside the company who have direct and regular involvement in the intricacies of the table grape market. The executives or experts assessed different aspects affecting the sector using a Likert scale ranging from 1 to 5. A score of 3 suggested neutrality, 5 indicated strongly favorable benefits, and 1 indicated severely negative impacts. The evaluation framework was based on Porter's Diamond Model, which specifically examines the fundamental factors that contribute to competitiveness. An analysis was conducted on the competitiveness of Namibia's grape sector using Porter's Diamond Model, which identifies six key factors that determine competitive advantage: Conditions pertaining to the factors of production. Factors pertaining to demand and market conditions. The influence of associated and ancillary industries-Approaches, organizations, and the characteristics of industry rivalry. The extent of governmental regulation and policy. The impact of unpredictable external variables An exhaustive investigation revealed that the strategic methodologies employed by enterprises, the structural dynamics within the industry, and competitive pressures play crucial roles in determining the competitive landscape of Namibia's table grape industry. Significantly, key factors that have contributed to the industry's competitiveness include the ability to enter the lucrative European market, the existence of high-quality storage and processing facilities, and the presence of advanced transportation networks such as roads and ports for efficient grape transportation. In this study, 73 factors influencing the Namibian Table grape industry were identified and categorized into six distinct groups. Analysis revealed that 51% of these factors positively contributed to enhancing the industry's competitive edge, while 31% were deemed neutral and had no significant impact either way. The remaining 18% were impediments to the industry's competitive performance. This distribution of factors indicates a generally favourable business environment for the table grape sector in Namibia, conducive to the competitiveness of the enterprises within this industry. Furthermore, Figure 7 presents an overview of the 20 most critical factors, evenly dividing between the 10 factors that most significantly bolster the industry's competitiveness and the 10 factors that pose the greatest challenges. www.extensionjournal.com This study highlights Namibian political stability and predictability as the foremost factors enhancing the competitiveness of the grape industry, suggesting a conducive policy environment. Additional factors boosting industry competitiveness include the presence of adequate storage and packaging facilities crucial for meeting international export standards, reliable transportation infrastructure ensuring timely and efficient grape exports, and the availability of unskilled labor, with individuals from various regions seeking employment within the industry. Moreover, the industry benefits from competitive international market dynamics that encourage investment in productivity and quality; effective communication channels with customers; the geographical suitability of the region for grape cultivation due to its semiarid climate; and the high quality of infrastructure essential for exports, such as ports, without imposing significant costs on businesses. Conversely, the analysis identifies the absence of a local consumer base for table grapes, given their primary designation for export markets, as a major constraint. Other challenges include the reliance on imported inputs, which elevates costs; the impact of corruption on business expenses; limited opportunities for collaboration with research institutions due to their scarcity; restricted local market growth attributed to the small population and low domestic demand for table grapes; and the high costs associated with establishing and maintaining vineyard infrastructure. This includes irrigation and quality control systems, which are crucial given the delicate nature of grape production. Additionally, the lack of local expertise for maintenance and repairs, the adverse effects of trade wars on market competition, fluctuations in exchange rates affecting profitability, and the scarcity of local suppliers for essential inputs further challenge the industry's competitiveness.
Source: Industry Executive Survey
Source: Industry Executive Survey
Factor Condition Determinant
As shown in Figure 8, the study revealed that the location of grape production, availability of general infrastructure for export, and ease of obtaining unskilled labor are the most important factors influencing the competitiveness of the Namibian table grape industry. Other enhancing factors relate to the availability of general infrastructure, such as roads, ports, water, and electricity. Since joblessness is a major socioeconomic factor in Namibia, it is easy for grape companies to find laborers as unemployed people from all over the country flock to the grape production area in search of jobs. Furthermore, grape plantations are located in areas with suitable weather conditions, ample water for irrigation, and tracts of land for growth and expansion. Namibian grapes ripen a month earlier than their competitors owing to favorable environmental conditions favoring early ripening of grapes in Namibia, giving grape producers a distinctive advantage in the market. The area is also strategically located with good road networks and seaports for export. However, the costs of infrastructure were found to constrain the competitiveness of the industry. Storage and handling facilities, irrigation systems, and technology are all but some unavoidable costs considering that grapes require adequate water for growth and that grapefruits are sensitive and hence require proper handling to preserve quality before shipping. However, these facilities come with very high costs, both establishment and running costs, constraining the competitiveness of the industry. Access to water was also cited as one of the constraining factors, as the water level in the Orange River has been observed to be diminishing in recent years. This is due to diversion in the catchment areas with lakes/dams on the South Africa side of the border narrowing the catchment area for the river. However, the recent completion of the Necktar dam on the Namibia side will go a long way to array the fear of potential water shortages in the grape production area.
Source: Industry Executive Survey
Source: Industry Executive Survey
Demand Condition Determinant
Figure 8 presents the evaluation by industry executives of the determinants of demand conditions and their impact on the competitiveness of the Namibian grape industry. The extensive size and diversity of the international market, along with positive relationships with international retailers, significantly contributed to enhancing the competitiveness of Namibia's grape industry. Conversely, the limited size and growth potential of the local market were identified as factors that diminish the industry's competitiveness. Namibian grapes have the advantage of reaching international markets, particularly in Europe, a month earlier than their competitors. This timing aligns with a period when fresh grapes are out of season in the Northern Hemisphere to unfavorable weather conditions, presenting Namibia with a unique opportunity to cater to the European demand for fresh grapes with minimal competition, even from other Southern Hemisphere countries such as Chile and Peru. Furthermore, the strong rapport between Namibian grape farmers and international retailers facilitates the exchange of valuable insights into customer preferences and demands, further bolstering the industry's competitive edge. However, the study also highlights certain constraints within the local market. Namibia's relatively small population size, coupled with high poverty rates and the absence of a local grape consumption culture, renders domestic marketing of fresh grapes unviable. Fresh grapes are often perceived as luxury items beyond the affordable reach of the average consumer in Namibia, leading to a general reluctance to purchase them. This perception has steered the Namibian grape industry to focus predominantly on exports, targeting international markets where demand and willingness to pay for fresh grapes are significantly greater.
Source: Industry Executive Survey
Source: Industry Executive Survey
Related and Supporting Industrial Determinants
Figure 10 highlights that the availability and reliability of transportation, in addition to the presence of adequate storage, packing, and handling facilities, as well as the necessary export infrastructure, significantly boosts the competitiveness of the table grape industry. Given the export-driven nature of the industry, adhering to the EU's import standards is crucial, necessitating high-quality storage and handling facilities to maintain grape quality, considering their susceptibility to damage. The industry's reputation for having some of the lowest levels of grape parasites globally enhances consumer trust in product quality. The efficient transport and logistics chain extending from production sites to Cape Town Hub, from where grapes are dispatched to EU markets, has received positive feedback from industry executives, given the absence of delays or product rejections. Conversely, the industry faces challenges due to the scarcity of local suppliers for essential inputs, limited collaboration with research institutions for scientific advancements, and the high costs associated with storage and handling facilities. The dependency on imported production inputs, subject to import duties and potential delays, escalates operational costs. The lack of specialized research and development institutions within Namibia forces reliance on in-house research or external institutions, often based in South Africa, which may not fully address Namibia's unique conditions. Industry leaders express concern that the absence of local research capabilities or world-class institutions hampers the industry's growth potential, risking stagnation. Furthermore, while storage and handling facilities are indispensable for meeting international market standards, their associated costs impose significant financial burdens on grape companies, constraining the industry's capacity to expand production without parallel enhancements in these facilities. www.extensionjournal.com
Source: Industry Executive Survey
Source: Industry Executive Survey
Firm Strategy, Structure and Rivalry Determinant
Firm strategy, industry structure and competition were found to be the most favorable determinants in the grape industry. Within this, competition in the international market and good relationships with foreign buyers and retailers were rated very favorably by industry executives, as shown in Figure 11. Namibia grapes reach the market a month before competitors do, allowing Namibian grape farmers to sell a substantial volume of grapes with little to no competition. Furthermore, there are favorable relationships between grape farmers and international retailers and suppliers of necessary input to the industry, which provides useful feedback for customer needs and preferences as well as a timely supply of input for production. In terms of constraints, grape production is an expensive undertaking, and this creates a strong barrier for new enterprises in the industry and for incumbents to expand production; thus, the industry remains small, limiting the potential for the industry to exploit economies of scale. Grape production represents the only major agricultural activity in Aussenkher where large plantations of grapes are found; therefore, there is not much competition for resources such as land, water and labour. However, grape plantations in Namibia compete with other agricultural activities on the South African side of the border, most notably for water, as the river is shared between the two countries.
Source: Industry Executive Survey
Source: Industry Executive Survey
Government Support and Policy Determinants
There is a positive outlook for the industry policy environment, as shown in Figure 12. The analysis shows that the taxation system, land reform policy, and macroeconomic policy are some of the few constraining policies for the grape industry. Most notably, the stability and predictability of the policy environment is found to encourage investment in the grape industry. The regulatory environment helps the industry maintain high quality and safety standards, as regulatory institutions such as AMTA and the Agronomic Board enforce these standards through regular inspections and provide technical assistance to ensure compliance by the industry. The land reform policy was singled out as one of the constraining factors, as land is very expensive in Namibia and constrains new entrants and incumbent companies from expanding production volume and exploiting economies of scale.
Source: Industry Executive Survey
Source: Industry Executive Survey
Chance Factor Determinant
Figure 13 illustrates the role of chance factors, which are external and beyond the control of industry and individual firms. The political environment in Namibia has been identified as supportive and conducive to investment in the grape industry, not presenting significant financial burdens to producers. Additionally, the industry benefits from a lack of significant threats from diseases or pest outbreaks, contributing positively to its profitability and reputation. At the time of the survey, the prevailing exchange rates were also advantageous, allowing grape producers to achieve premium prices in the market. However, the production of fresh grapes is notably vulnerable to adverse weather conditions, necessitating substantial investment to mitigate the impact of such climatic challenges and maintain the quality of grapes destined for the export market. These necessary investments introduce additional costs to the industry, potentially constraining its growth capabilities. Furthermore, the impact of trade wars has been detrimental, causing market shifts and heightened competition in the global arena. Such geopolitical tensions and trade conflicts have led to fluctuations in exchange rates, adversely affecting the industry's profitability due to the resulting financial uncertainties.
Source: Industry Executive Survey
Source: Industry Executive Survey
Conclusions
The Namibian table grape industry has emerged as a vibrant and important contributor to the agricultural sector, as it is poised to elevate Namibia's standing in the international arena. Despite trailing behind giants such as Chile, Peru, and South Africa, the industry is on an upwards trajectory, driven by strategic access to European markets and top-tier infrastructure that enhance its competitive edge. Namibia's unique climate accelerates grape ripening, granting it a distinct advantage by meeting market demand ahead of its competitors. The availability of water for irrigation and the expansion of land offer avenues for growth, while a supportive policy environment fosters a favorable investment climate. However, the path to scaling new heights is tempered by financial hurdles related to establishing state-of-the-art storage and handling facilities, in addition to the high costs associated with vineyards and irrigation infrastructure. These challenges, notwithstanding, the industry's advantageous climatic conditions, strategic positioning, and policy support, lay a robust foundation for its trajectory toward enhanced global competitiveness and sustained growth.
Recommendations 5.1 Enhance Local Research and Development
Foster partnerships between industry and local research institutions to innovate and adapt technologies suitable for Namibia's unique conditions, reducing reliance on imported solutions.
Investment in Infrastructure
Funding for critical infrastructure projects, particularly in water management, storage, and transportation facilities, should be secured to support sustainable industry growth and reduce operational costs.
Diversify Export Markets
Explore new markets beyond Europe to mitigate the risks associated with market concentration and seasonal demand fluctuations, potentially targeting emerging markets with a growing demand for fresh produce.
Strengthening industry collaboration
The collaboration among stakeholders, including producers, government bodies, and research institutions, should be promoted to share knowledge, optimize resources, and collectively address industry challenges.
Leverage Government Support
The government entities should advocate for supportive policies, particularly regarding land reform, water access, and investment incentives, to facilitate industry expansion and attract new entrants.
Build Local Capacity
Training and development programs should be implemented to enhance local expertise in grape production, technology maintenance, and quality control, reducing the industry's dependency on foreign labor and expertise.
Market Development and Branding
A strong brand for Namibian table grapes was developed, emphasizing their unique qualities and early market availability, to enhance market recognition and demand.
Figures and tables from the paper
References
14 in the original paper- Balassa B. Trade Liberalization and Revealed Comparative Advantage. Manchester School. 1965;33:99-123.
- Lashkari A, Irannezhad M, Liu J, Schulthess U. Cascading socio environmental sustainability risks of agricultural export miracle in Peru. Environmental Sustainability. 2022;5(2):255-259. https://doi.org/10.1007/s42398-022-00233-w
- Mtshiselwa ZL. Trends and determinants of competitiveness in the South African table grape industry [Internet]; c2020 [cited 2024 May 24]. Available from: https://scholar.sun.ac.za
- Munyika S, Kongo V, Kimwaga R. River health assessment using macroinvertebrates and water quality parameters: A case of the Orange River in Namibia. Physics and Chemistry of the Earth. 2014;76-78:140148. https://doi.org/10.1016/j.pce.2015.01.001
- Nangolo JT. Land Use And Land Cover Changes And The Water Quality Of The Orange River At Aussenkehr, Namibia [Internet]; c2021 [cited 2024 May 24]. Available from: https://repository.unam.edu.na/handle/11070/2987
- Pitts E, Viaene J, Trail B, Gellynck X. Measuring Food Industry Competitiveness. Discussion Paper number 7. In: Structural Change in the European Food Industries - A Concerted Action Project with the EU AAIR Programme. 1995;(7).
- Pizarro E, Galleguillos M, Barría P, Callejas R. Irrigation management or climate change ? Which is more important to cope with water shortage in the production of table grape in a Mediterranean context. Agricultural Water Management. 2022;263. https://doi.org/10.1016/j.agwat.2022.107467
- Porter ME. The Competitive Advantage of Nations. Havard Business Review. 1990;68(2):73-93.
- Porter ME. The Competitive Advantage of Nations: With a New Introduction. 2nd ed. Macmillan Press Ltd; 1998.
- Rosengarten A. The Lower !Garib/Orange River. Pasts and Presents of a Southern African Border Region. In: Lenggenhager L, Akawa M, Miescher G, Nghitevelekwa R, Sinthumule NI. editors. Transcript Verlag. 2023. https://doi.org/10.14361/9783839466391
- Thomas B. The development of the horticultural industry in Namibia: an assessment of the determinants of the global market competitiveness of table grape production [Internet]. 2007 [cited 2024 May 24]. Available from: http://scholar.sun.ac.za/handle/10019.1/18707
- Tjitombo G. Farm Workers' Resistance to Exploitation: A Case Study of the Workers at Aussenkehr Karas Region, Namibia [Internet]. 2021 [cited 2024 May 24]. Available from: chromeextension://efaidnbmnnnibpcajpcglclefindmkaj/https://r epository.unam.edu.na/bitstream/handle/11070/3152/tjit ombo_2021.pdf?sequence=1
- Verdugo-Vásquez N, Orrego R, Gutiérrez-Gamboa G, Reyes M, Zurita Silva A, Balbontín C, Gaete N, Salazar-Parra C. Trends and climatic variability in the Chilean viticultural production zones: three decades of climatic data (1985-2015). OENO One. 2023;57(1):345-362. https://doi.org/10.20870/oenoone.2023.57.1.7151
- Yu R, Cai J, Leung PS. The normalized revealed comparative advantage index. Annals of Regional Science. 2009;43(1):267-282. https://doi.org/10.1007/s00168-008-0213-3