
Research article · 2024 · Full text
International Journal of Agriculture Extension and Social DevelopmentAn economic analysis of onion production in Nalanda district of Bihar, India
Volume 7(5) · Pages 331–334 · DOI: 10.33545/26180723.2024.v7.i5e.626 ↗
Research areasAgricultural Economics and Practices
Abstract
Author-writtenThe aim of the current study was to determine the cost of cultivation, various expenses, and the benefit-cost ratio associated with production of onion across five farm size categories: marginal, small, semi-medium, medium, and large. The study was conducted in the Harnaut block of the Nalanda district of Bihar, which was specifically chosen due to its high yield and large number of onion farmers (ninety farmers were chosen from six villages within the block). The price of growing onions differed depending on the size group. Cost of cultivation was highest in large farm size farmers (Rupees 97210), while marginal-sized farmers incurred the lowest (Rs. 94550). For small, semi-medium, and medium-sized farmers, the expense was Rs. 96318, Rs. 95961.2 and 96156 per hectare respectively. Cost benefit ratio was highest in large size farms 1: 2.22 followed by semi-medium size farms 1: 2.20, medium size farms 1:2.19 and lowest in marginal and small farm size which was 1: 2.14 respectively. The total yield was highest in large size of farm groups which was 240 Qtl. per hectare and lowest in marginal size of farm groups which was 225 Qtl. per hectare.
Summary
Source-checkedPlain-language reading of the full paper, prepared with AI and checked against the text. Each point links to the authors' own words.
Why it matters
- Onions are among the most important vegetables for commercial farming and consumption globally. View evidence ↗
- India is the world's leading producer of onions, with a total production of 26,738 metric tonnes in 2022-2023. View evidence ↗
- In the state of Bihar, onion production reached 1,375,000 tonnes during the 2021-2022 period. View evidence ↗
The question
- The study aimed to analyze cultivation costs, expenses, and the benefit-cost ratio for onion production across five different farm size categories. View evidence ↗
What they did
- The total cost of cultivation was calculated by summing expenses for land preparation, farm management, fertilizers, manures, weeding, irrigation, plant protection, and harvesting. View evidence ↗
What they found
- The highest cost of cultivation occurred in large farms (Rs. 97,210), while marginal farms had the lowest cost (Rs. 94,550). View evidence ↗
- Onion yield increased with farm size, ranging from 225 Qtl/ha in marginal farms to 240 Qtl/ha in large farms. View evidence ↗
- Large farms achieved the highest gross returns at Rs. 216,000/ha, compared to Rs. 202,500/ha for marginal farms. View evidence ↗
- Net returns per hectare were highest for large farms (Rs. 118,790/ha) and lowest for marginal farms (Rs. 107,950/ha). View evidence ↗
- The benefit-cost ratio was most favorable for large farms (1:2.22) and least favorable for marginal and small farms (1:2.14). View evidence ↗
- Hired human labor costs were highest in large farms (Rs. 20,750/ha) and lowest in marginal farms (Rs. 15,750/ha). View evidence ↗
What it means
- The authors conclude that while productivity and area increase production, the actual acreage dedicated to onions is more heavily influenced by market prices and rainfall than by productivity gains. View evidence ↗
- The authors state that production costs vary by farm size, noting that per hectare costs are highest on small farms and lowest on large farms. View evidence ↗
Visual summary
2 visualsIllustrations explain the paper; charts are replotted from the paper's own table values.
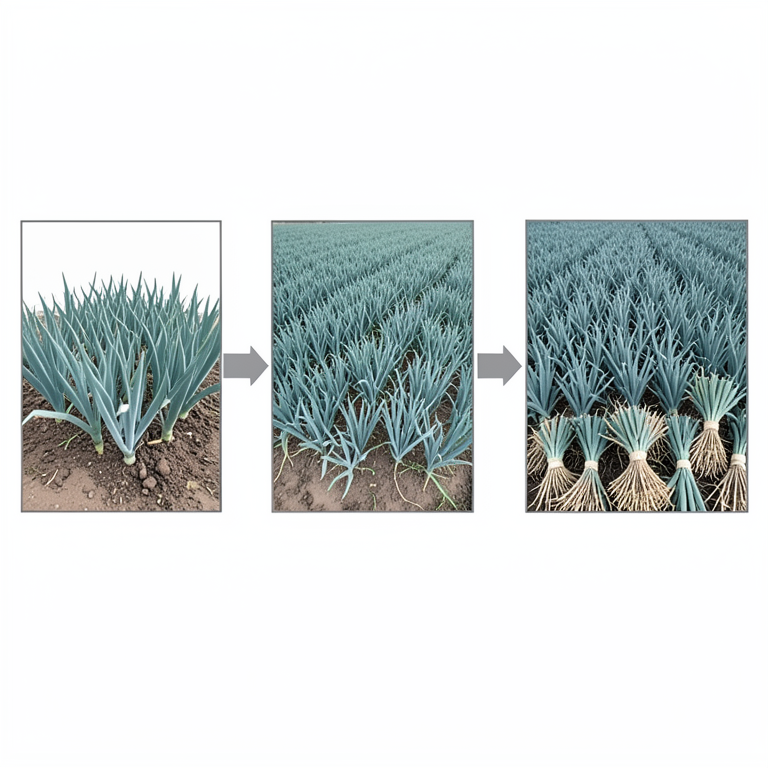
Farm Size vs. Economic Performance
AI-generated conceptual illustration (onion plants in agricultural fields). It explains the idea and does not show study data.
View source evidence ↗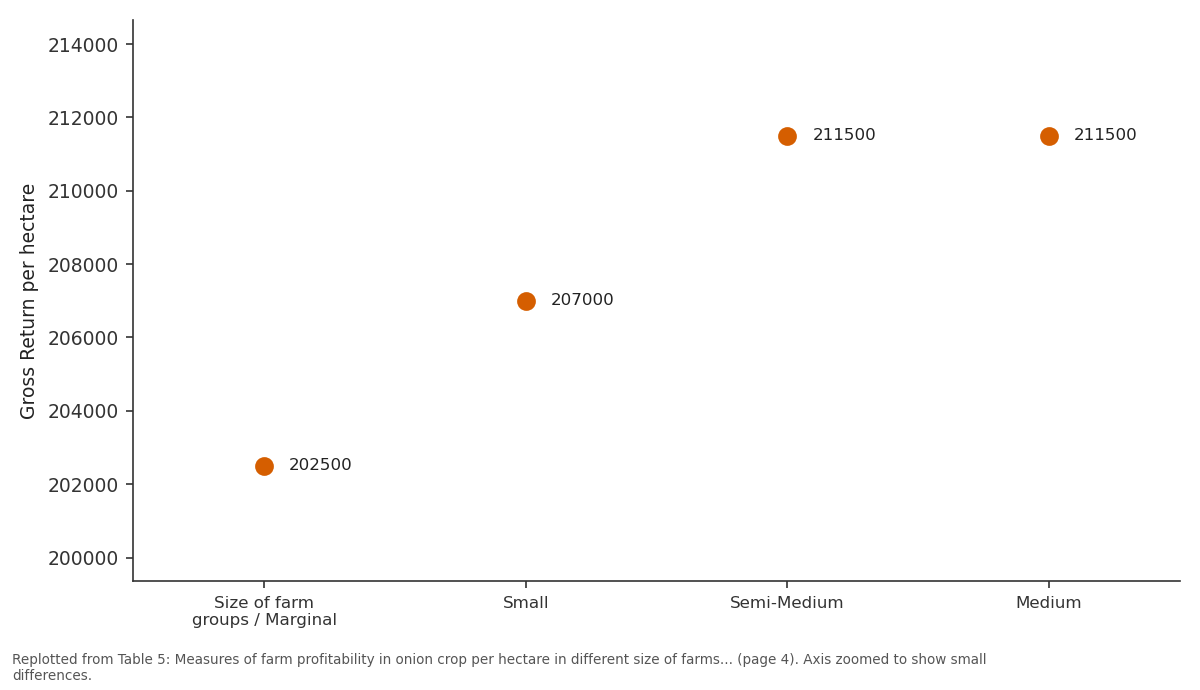
Gross Return per hectare: Size of farm groups /... vs Small vs Semi-Medium vs Medium
Replotted from Table 5 (page 4) of the original paper. Every bar is the paper's own table value.
View source evidence ↗Figures & tables
From the original paper Table 1
 Table 2
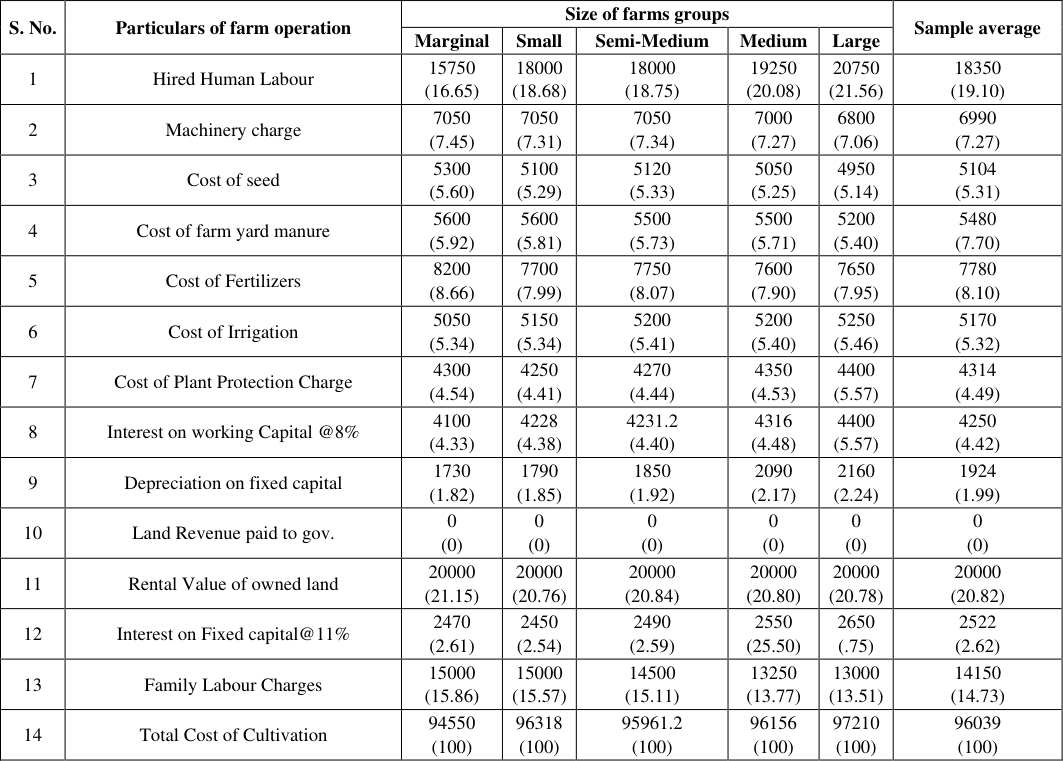 Table 3
 Table 4
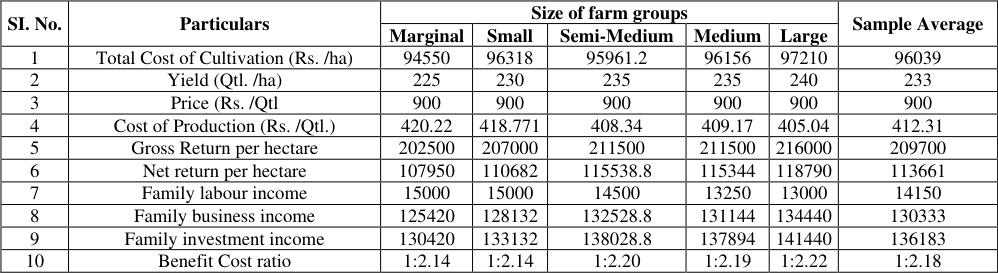 Table 5
Introduction
One of the most significant vegetables farmed and consumed commercially is the onion (Allium cepa L.). Since at least 4000 BC, it has been grown and consumed practically everywhere in the world. It originated in the region that is now part of Afghanistan, Kazakhstan, Uzbekistan, Western Tianshan, North and West India, and Western Asia. It first spread to other regions of the world in the region surrounding the Mediterranean Sea. Dehydrated onions can be used as spices; they are available as flakes and powder. In addition, onions are a great source of phosphate, calcium, carbohydrates, proteins, and vitamins B and C. They are also used to manufacture oil and pectin. Numerous illnesses and ailments can be treated with onions. The most common ones are dropsy, heart disease liver, cirrhosis, diabetes, tuberculosis and heart attacks (Kumar et al.,2016) [3] . India is largest producer of onion in the world. The total onion production in 2022-2023 was 26738 metric tonnes. (FAO stats 2024) The onion production in Bihar was 1375000 tonnes in (2021-2022) (NBH).
Materials and Methods
In this study, the respondents, villages, blocks, and districts were chosen using a multistage sampling procedure. Using a random sampling technique, 90 onion producers from the six villages in the Harnaut block of the Nalanda district were chosen. The farmers were divided into five groups based on the size of their land holdings. First were marginal producers, whose holding size was less than one hectare; second were small growers, whose holding size was between one and two hectares; and third were semi-medium growers, whose holding size was between two and four hectares. Large growers with land holding sizes greater than 10 hectares were in the fifth group, while medium growers with land holding sizes between 4 and 10 hectares were in the fourth. An organized and field-tested interview schedule was employed to gather information from onion growers about several facets of the production of onions. The socioeconomic characteristics of growers and the activities related to onion production were included in the survey data. The economic analysis employed benefit cost to calculate onion farmers' profitability. The entire cost of growing onions was computed, including the costs of preparing the land, running the farm, applying fertilizers and manures, weeding, irrigation, protecting the plants, and harvesting. Secondary data were gathered by looking through a variety of published and unpublished sources, including books, reports, and journals. The sum of the total fixed and total variable costs is the overall cost of cultivation. The gross return is computed by multiplying the price that farmers get by the entire yield of crops per hectare. The entire cost of cultivation was deducted from the gross return to assess the net return received by onion growers. The benefit-cost ratio was computed by dividing the return on investment by the total cost to determine the return on each rupee. Gross return / total cultivation costs equal to the benefit-cost ratio. www.extensionjournal.com
Result and Discussion
Result and Discussion
Detail description of the cultivated land holdings in different sizes of farms.
The table 1 revealed that the number of onion growers in different farm size groups were marginal (31), small (19), semi-medium (16), medium (16) and large (8) respectively. Altogether 90 farmers were selected for study. Average size of the cultivated holding per hectare for marginal size farms was 0.55 hectare followed by 1.25 hectare for small size farms, 3.15 hectare for semi-medium size farms, 6.75 ha for medium size farms group and for large size of farms groups was 10.30 which constituted on sample average of 4.4 ha respectively.
| S. No. | Particulars | Size of Farms Group | — | — | — | — | Sample Average |
|---|---|---|---|---|---|---|---|
| Marginal | Small | Semi-Medium | Medium | Large | |||
| 1 | Size of Farms group (no.) | 31 | 19 | 16 | 16 | 8 | 90 |
| 2 | Average land holding(ha) | 0.55 | 1.25 | 3.15 | 6.75 | 10.3 | 4.4 |
Table text extracted from the original PDF; superscript letters are shown inline. The original table image is below.
View original table image
Conclusion
The study conducted in the Nalanda district of Bihar provides valuable insights into the economic aspects of onion production. The increase in onion production is primarily due to higher productivity and a larger area dedicated to the crop. However, the acreage of onions is more influenced by factors such as rainfall and market prices than by productivity improvements. The cropping pattern is dominated by onions, followed by groundnut, sugarcane, and paddy. Resource usage in onion cultivation varies across different farm sizes. The cost of onion production also differs according to the size of the farm, with the highest per hectare cultivation costs on small farms and the lowest on large farms. Major cost components include land rental, hired labour, fertilizers, manures, and seeds, with overall cultivation costs varying among different groups of onion growers.
Acknowledgement
AcknowledgementI extend my heartfelt thanks to my advisor Dr. Mukesh Maurya for his continuous support and expert guidance throughout the research process.
Figures and tables from the paper
| S. No. | Age Categories | Marginal | small | Semi-Medium | Medium | Large | Total |
|---|---|---|---|---|---|---|---|
| 1 | 18-35 | 8 | 3 | 2 | 3 | 1 | 17 |
| 2 | 36-60 years | 20 | 10 | 9 | 9 | 5 | 53 |
| 3 | 61 years and above | 3 | 6 | 5 | 4 | 2 | 20 |
| Total | 31 | 19 | 16 | 16 | 8 | 90 |
Table text extracted from the original PDF; superscript letters are shown inline. The original table image is below.
View original table image
| S. No. | Particulars of farm operation | Size of farms groups | — | — | — | — | Sample average |
|---|---|---|---|---|---|---|---|
| Marginal | Small | Semi-Medium | Medium | Large | |||
| 1 | Hired Human Labour | 15750 (16.65) | 18000 (18.68) | 18000 (18.75) | 19250 (20.08) | 20750 (21.56) | 18350 (19.10) |
| 2 | Machinery charge | 7050 (7.45) | 7050 (7.31) | 7050 (7.34) | 7000 (7.27) | 6800 (7.06) | 6990 (7.27) |
| 3 | Cost of seed | 5300 (5.60) | 5100 (5.29) | 5120 (5.33) | 5050 (5.25) | 4950 (5.14) | 5104 (5.31) |
| 4 | Cost of farm yard manure | 5600 (5.92) | 5600 (5.81) | 5500 (5.73) | 5500 (5.71) | 5200 (5.40) | 5480 (7.70) |
| 5 | Cost of Fertilizers | 8200 (8.66) | 7700 (7.99) | 7750 (8.07) | 7600 (7.90) | 7650 (7.95) | 7780 (8.10) |
| 6 | Cost of Irrigation | 5050 (5.34) | 5150 (5.34) | 5200 (5.41) | 5200 (5.40) | 5250 (5.46) | 5170 (5.32) |
| 7 | Cost of Plant Protection Charge | 4300 (4.54) | 4250 (4.41) | 4270 (4.44) | 4350 (4.53) | 4400 (5.57) | 4314 (4.49) |
| 8 | Interest on working Capital @8% | 4100 (4.33) | 4228 (4.38) | 4231.2 (4.40) | 4316 (4.48) | 4400 (5.57) | 4250 (4.42) |
| 9 | Depreciation on fixed capital | 1730 (1.82) | 1790 (1.85) | 1850 (1.92) | 2090 (2.17) | 2160 (2.24) | 1924 (1.99) |
| 10 | Land Revenue paid to gov. | 0 (0) | 0 (0) | 0 (0) | 0 (0) | 0 (0) | 0 (0) |
| 11 | Rental Value of owned land | 20000 (21.15) | 20000 (20.76) | 20000 (20.84) | 20000 (20.80) | 20000 (20.78) | 20000 (20.82) |
| 12 | Interest on Fixed capital@11% | 2470 (2.61) | 2450 (2.54) | 2490 (2.59) | 2550 (25.50) | 2650 (.75) | 2522 (2.62) |
| 13 | Family Labour Charges | 15000 (15.86) | 15000 (15.57) | 14500 (15.11) | 13250 (13.77) | 13000 (13.51) | 14150 (14.73) |
| 14 | Total Cost of Cultivation | 94550 (100) | 96318 (100) | 95961.2 (100) | 96156 (100) | 97210 (100) | 96039 (100) |
Table text extracted from the original PDF; superscript letters are shown inline. The original table image is below.
View original table image
| S. No. | Cost Concepts | Size of Farm groups | — | — | — | — | Sample Average |
|---|---|---|---|---|---|---|---|
| Marginal | Small | Semi-Medium | Medium | Large | |||
| 1 | Cost A1 | 57080 | 58868 | 58971.2 | 60356 | 61560 | 59367 |
| 2 | Cost A2 | 77080 | 78868 | 78971.2 | 80356 | 81560 | 79367 |
| 3 | Cost B | 79550 | 81318 | 81461.2 | 82906 | 84210 | 81889 |
| 4 | Cost C | 94550 | 96318 | 95961.2 | 96156 | 97210 | 96039 |
Table text extracted from the original PDF; superscript letters are shown inline. The original table image is below.
View original table image
| SI. No. | Particulars | Size of farm groups | — | — | — | — | Sample Average |
|---|---|---|---|---|---|---|---|
| Marginal | Small | Semi-Medium | Medium | Large | |||
| 1 | Total Cost of Cultivation (Rs. /ha) | 94550 | 96318 | 95961.2 | 96156 | 97210 | 96039 |
| 2 | Yield (Qtl. /ha) | 225 | 230 | 235 | 235 | 240 | 233 |
| 3 | Price (Rs. /Qtl | 900 | 900 | 900 | 900 | 900 | 900 |
| 4 | Cost of Production (Rs. /Qtl.) | 420.22 | 418.771 | 408.34 | 409.17 | 405.04 | 412.31 |
| 5 | Gross Return per hectare | 202500 | 207000 | 211500 | 211500 | 216000 | 209700 |
| 6 | Net return per hectare | 107950 | 110682 | 115538.8 | 115344 | 118790 | 113661 |
| 7 | Family labour income | 15000 | 15000 | 14500 | 13250 | 13000 | 14150 |
| 8 | Family business income | 125420 | 128132 | 132528.8 | 131144 | 134440 | 130333 |
| 9 | Family investment income | 130420 | 133132 | 138028.8 | 137894 | 141440 | 136183 |
| 10 | Benefit Cost ratio | 1:2.14 | 1:2.14 | 1:2.20 | 1:2.19 | 1:2.22 | 1:2.18 |
Table text extracted from the original PDF; superscript letters are shown inline. The original table image is below.
View original table image
References
3 in the original paper- Munasu V, Ramchandra. An economic analysis of production of onion (Allium cepa) in Mahabubnagar district of Telangana. Int J Innov Sci Res Technol. 2020;ISSN No. 2456-2165.
- Usha et al. Economic analysis, marketing and storage of onion cultivation in district Bhiwani, Haryana. Annals of Agri-Bio Res. 2023;28(1):152-158.
- Kumar R, Bishnoi DK, Rathi A, Prakash S. Marketing and price behaviours of onion in Haryana. Indian J Econ Develop. 2016;12:07-11.
Cited by 2
From OpenAlex, OpenCitations and reference lists read by Scinovex
- Cost economic analysis of sugarcane cultivation in Kanpur Nagar district of Uttar Pradesh
Kamini Sachan, Ashish Srivastava, Aditya Pratap Singh · International Journal of Agriculture Extension and Social Development · 2026
The present study was conducted to examine the economics of sugarcane cultivation in Kanpur Nagar district of Uttar Pradesh during the agricultural year 2025–2026. A purposive-cum-multistage random sampling technique was employed for the selection of respondents, and a total of 100 sugarcane growers were selected from Patrai block. The selected farmers were categorized into marginal, small, and medium farm groups. Primary data were collected through personal interviews with the help of a pre-structured schedule, while secondary data were obtained from official records, journals, and published
- Economic analysis of sugarcane production in Sitapur district of Uttar Pradesh
LK Srivastava, Mukesh Kumar Maurya · International Journal of Agriculture Extension and Social Development · 2025
Sugarcane cultivation constituted a vital part of the agricultural economy in Uttar Pradesh, contributing significantly to rural livelihoods and farmer incomes.The study titled " Economic Analysis of Sugarcane Production in Sitapur District of Uttar Pradesh" examined the economic dimensions of sugarcane farming in Mahmudabad block.For the study, five percent of sugarcane cultivating potential villages were randomly selected from the selected block, and ten percent of the total respondent population were taken as sample randomly.The analysis revealed that marginal farms incurred the highest cos