
Research article · 2024 · Full text
International Journal of Advanced Biochemistry ResearchStudy on the performance of chickpea (Cicer arietinum L.) germplasm for seed yield and component traits under irrigated condition
Volume 8(5) · Pages 626–631 · DOI: 10.33545/26174693.2024.v8.i5h.1146 ↗
Research areasAgricultural pest management studiesGenetic and Environmental Crop StudiesAgronomic Practices and Intercropping Systems
Abstract
Author-writtenChickpea (Cicer arietinum L.) is a legume crop from the family Leguminosae (Fabaceae). Enhancing yield stands as the primary goal for crop breeders engaged in improvement programs. Understanding the relationship between yield and its component traits can aid in boosting chickpea yield. This study involved 25 genotypes cultivated in a Randomized Block Design with three replications during the Rabi season of 2023-24. The genotypes underwent evaluation to determine genetic variability, heritability, genetic advance, correlations, and direct and indirect effects among yield and its components. Correlation analyses revealed significant positive correlations between seed yield per plant and biological yield, number of secondary branches per plant, and number of pods per plant. Path analysis indicated that biological seed yield per plant had the highest positive direct effect on seed yield per plant, suggesting its importance as a trait for improving chickpea yield.
Summary
Source-checkedPlain-language reading of the full paper, prepared with AI and checked against the text. Each point links to the authors' own words.
Why it matters
- Chickpea is a legume crop, and the primary objective for breeders working on its improvement is to increase its yield. View evidence ↗
- Chickpeas are highly nutritious, containing essential minerals, vitamins, and vital amino acids. View evidence ↗
- Chickpea productivity is threatened by environmental stressors such as drought and heat, as well as biotic factors like Fusarium wilt and pest infestations. View evidence ↗
What they did
- The researchers evaluated 25 chickpea genotypes sourced from IIPR, Kanpur and Rama University. View evidence ↗
- The experiment used a randomized block design with two replications at Rama University's Agriculture Research Farm in Uttar Pradesh, with plants spaced at 30 x 15 cm. View evidence ↗
- Twelve yield-attributing traits were measured, including plant height, biological yield, and seed yield per plant. View evidence ↗
What they found
- Analysis of variance showed significant differences across all examined traits, indicating substantial variability for breeding. View evidence ↗
- The highest phenotypic and genotypic coefficients of variation (PCV and GCV) were found for biological yield per plant, followed by pod number and 100-seed weight. View evidence ↗
- High broad-sense heritability was observed for most traits, including plant height, biological yield, and seed yield per plant. View evidence ↗
- Higher genetic advance was recorded for biological yield per plant, pod number, and 100-seed weight. View evidence ↗
- Seed yield per plant was highly and positively correlated with biological yield, the number of pods per plant, and the number of secondary branches per plant. View evidence ↗
- A significant negative correlation was found between seed yield per plant and the harvest index. View evidence ↗
- Path analysis showed that days to 50% flowering had the highest positive direct effect on seed yield per plant. View evidence ↗
- Harvest index, biological yield per plant, primary branch number, and seeds per pod showed significant negative direct effects on seed yield per plant. View evidence ↗
What it means
- The authors conclude that biological yield, pod number, 100-seed weight, and seed yield per plant are governed by additive gene action, making them beneficial traits for selection. View evidence ↗
- The authors recommend selecting biological yield and other positively correlated traits to develop higher-yielding chickpea plant types. View evidence ↗
Visual summary
3 visualsIllustrations explain the paper; charts are replotted from the paper's own table values.
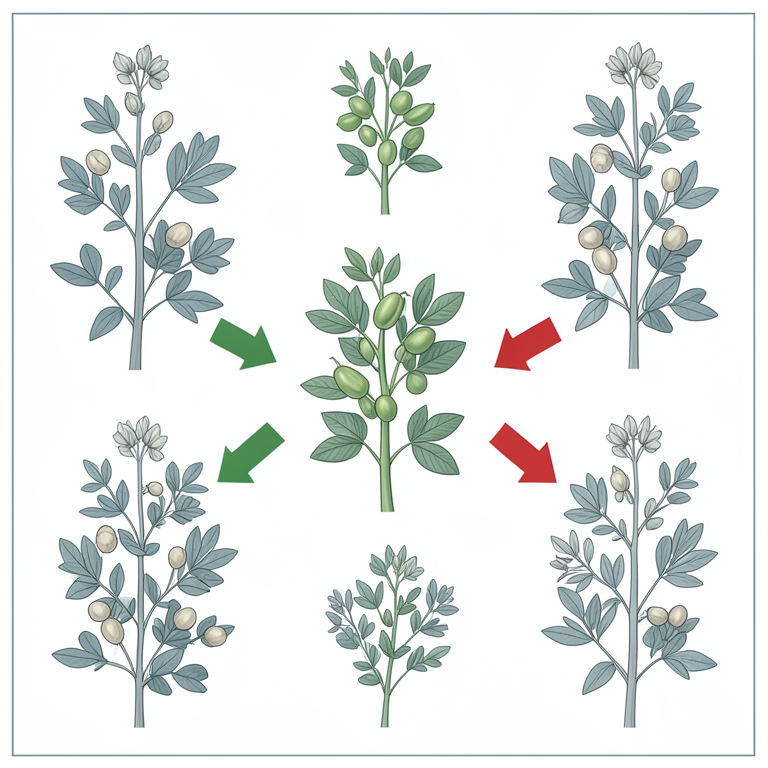
Correlation Network of Yield Traits
AI-generated conceptual illustration (chickpea plants (Cicer arietinum L.)). It explains the idea and does not show study data.
View source evidence ↗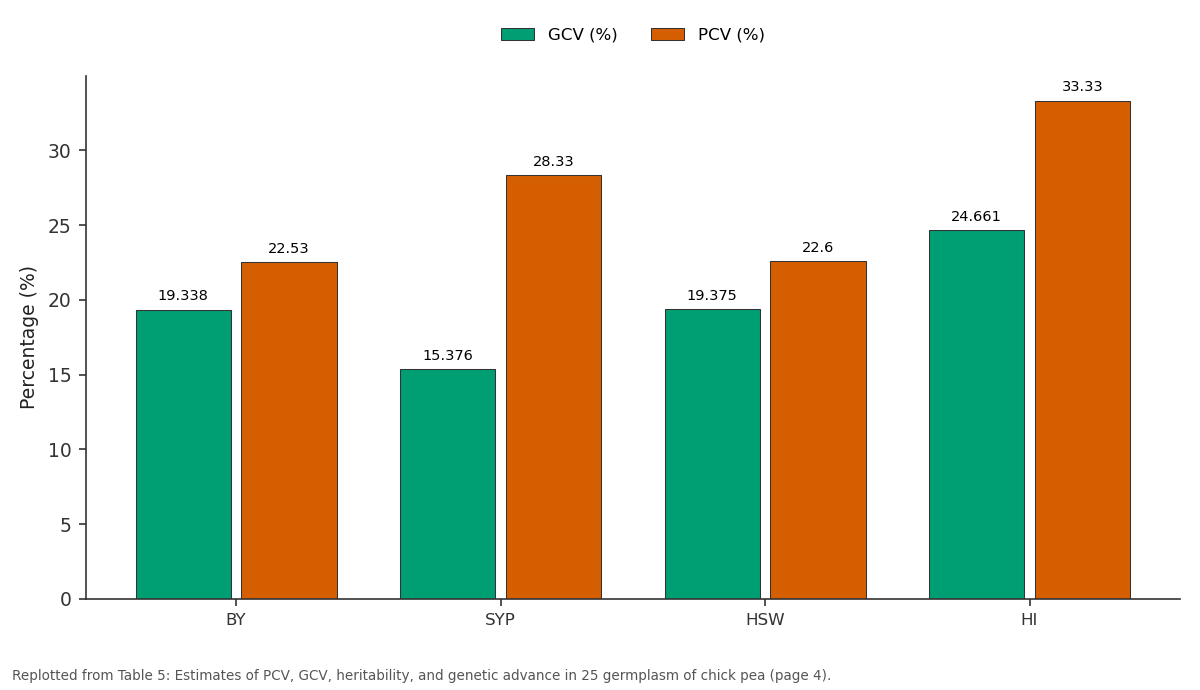
GCV (%) and PCV (%): BY vs SYP vs HSW vs HI
Replotted from Table 5 (page 4) of the original paper. Every bar is the paper's own table value.
View source evidence ↗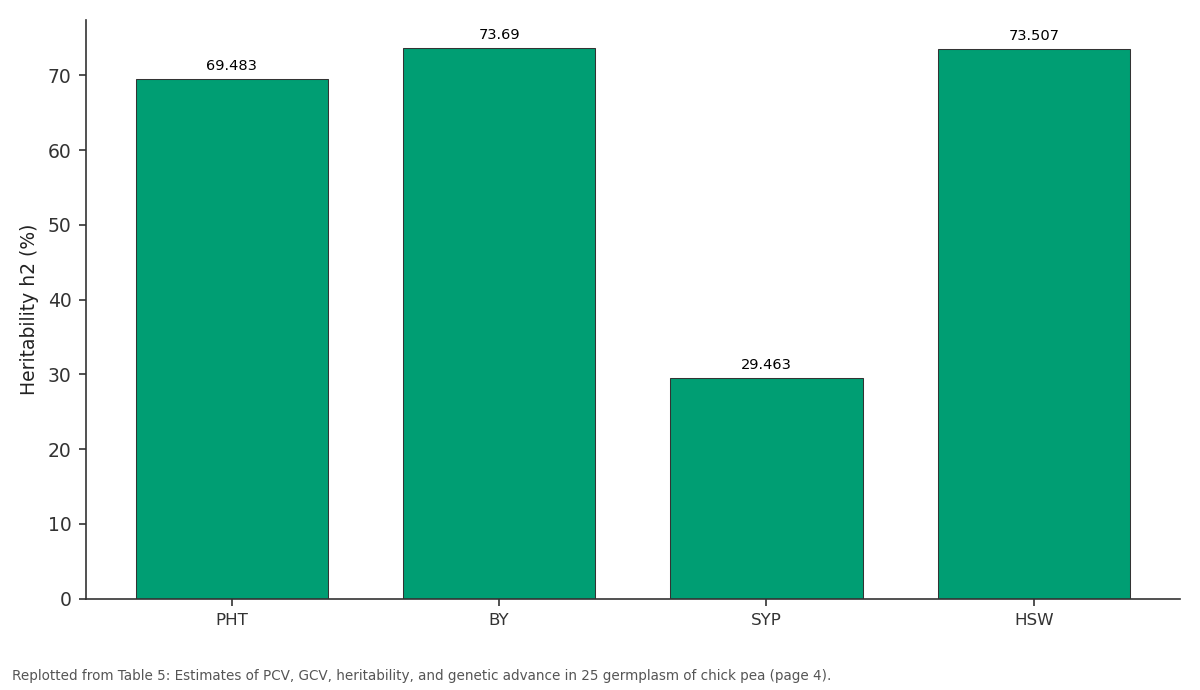
h2 (%): PHT vs BY vs SYP vs HSW
Replotted from Table 5 (page 4) of the original paper. Every bar is the paper's own table value.
View source evidence ↗Figures & tables
From the original paper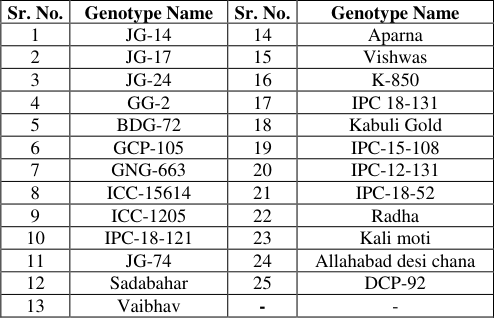 Table 1
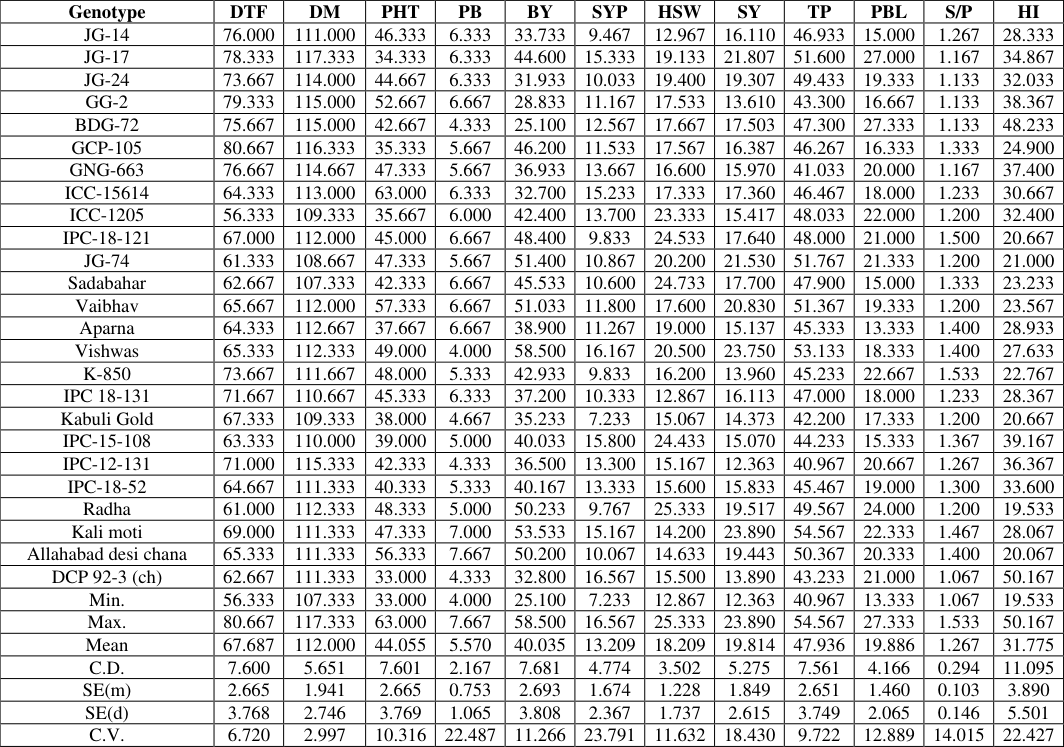 Table 2
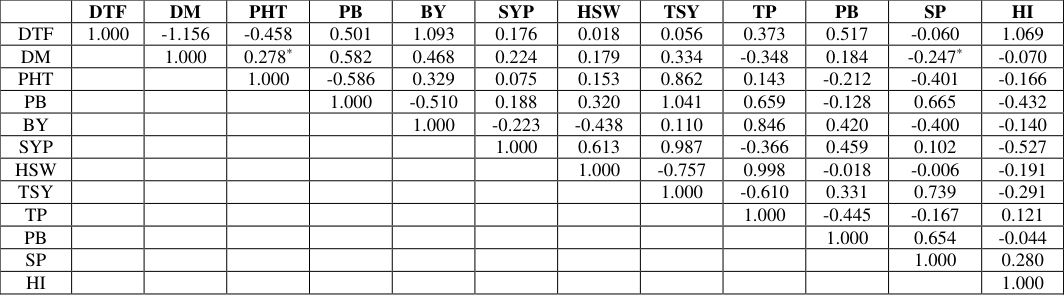 Table 3
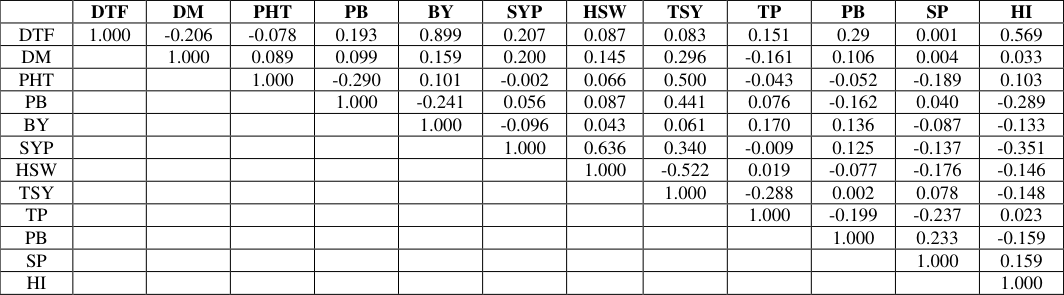 Table 4
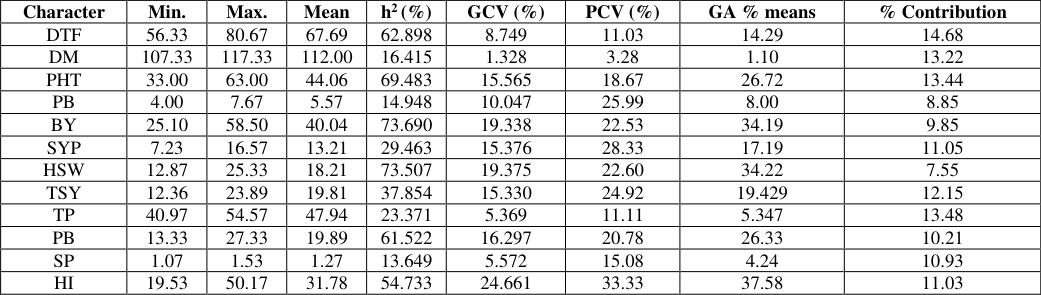 Table 5
Introduction
Chickpea (Cicer arietinum L.) is a type of legume crop that primarily grows in temperate regions and is native to Southeastern Turkey. It's an annual plant with a genome size of 738 Mb and a chromosomal count of 2n = 2x = 16 (Varshney et al., 2013) [48] . Chickpeas can be broadly categorized into two types based on their seed morphology: desi, characterized by small seeds with a brown coat, and Kabuli, which have larger seeds with a cream or beigecolored coat (Solanki et al., 2019) [37] . These legumes are highly nutritious, boasting significant levels of vitamins (Gupta et al., 2021) [21] , essential minerals like calcium, magnesium, phosphorus, and potassium, and vital amino acids such as lysine, methionine, threonine, valine, and leucine, as well as ß-carotene (Jukanti et al., 2012; Thudi et al., 2014) [18, 43] . However, the productivity of chickpeas can be adversely affected by various environmental factors like drought, heat, excessive salt, and cold, as well as biotic factors including Ascochyta blight, Fusarium wilt, and Helicoverpa infestations (Asati et [2,38,39] . The effectiveness of crop development programs greatly relies on careful selection, which in turn is influenced by the presence and frequency of genetic traits within the population of a specific crop species. Environmental conditions play a significant role in seed productivity, which is a complex trait influenced by multiple genes. Understanding the major characteristics and their interrelationships is crucial for establishing selection criteria to enhance existing genotypes. Path coefficient analysis helps in assessing the direct and indirect effects of traits on each other. Phenotypic coefficients evaluate the impact of the environment on the genotype, while genotypic coefficients of variation estimate heritable variability. Therefore, factors such as heritability, selection intensity, and genetic gain are essential for effective selection. A directional model based on seed yield and its components is used in correlation analysis to examine the relationship between different parameters. With this context in mind, the current study aimed to estimate the total genotypic variability. The objective of this study is to assess the heritability of specific agronomic parameters and to analyze correlations and path analysis among important traits for selecting criteria aimed at enhancing yield in chickpeas under normal sown conditions. The investigation aimed to assess the genetic variability, correlations, and path analysis of 25 chickpea genotypes (Table 1). These genotypes were sourced from IIPR, Kanpur and Faculty of Agricultural Sciences and Allied Industries, Rama University Mandhana, Kanpur. The experiment was conducted at the Agriculture Research Farm, Department of Agriculture, Rama University, Kanpu, Uttar Pradesh, using a randomized block design with two replications. Each genotype was planted in four rows, each 3 meters in length, with a row-to-row and plant-to-plant distance of 30 x 15 cm, respectively. Data were collected on twelve yield attributing traits, including days to 50% flowering, days to maturity, plant height, numbers of primary and secondary branches per plant, pod-bearing length, numbers of pods per plant, numbers of seeds per pod, harvest index, biological yield per plant, and seed yield per plant and seed yield/ha. Five plants from each replication were randomly chosen for recording observations for all traits. The genotypic (GCV) and phenotypic coefficient of variation (PCV) were calculated according to the formula provided by Burton (1952) [10] , while heritability in the broad sense (h^2) was determined as suggested by Burton and De (1953) [11] , and genetic advance was computed using the method described by Johnson et al. (1955) [17] . Correlation coefficients were calculated to assess the degree of relationship between each character and yield, as well as among the variables contributing to yield. The correlation between genotype and phenotype was calculated using the formula provided by Weber and Moorthy (1952) [50] and modified by Miller et al. (1958) [25] . Path coefficient analysis, which helps determine the direct and indirect impacts of various characters on yield, was conducted using the method adopted by Dewey and Lu (1959) [4] .
| Sr. No. | Genotype Name | Sr. No. | Genotype Name |
|---|---|---|---|
| 1 | JG-14 | 14 | Aparna |
| 2 | JG-17 | 15 | Vishwas |
| 3 | JG-24 | 16 | K-850 |
| 4 | GG-2 | 17 | IPC 18-131 |
| 5 | BDG-72 | 18 | Kabuli Gold |
| 6 | GCP-105 | 19 | IPC-15-108 |
| 7 | GNG-663 | 20 | IPC-12-131 |
| 8 | ICC-15614 | 21 | IPC-18-52 |
| 9 | ICC-1205 | 22 | Radha |
| 10 | IPC-18-121 | 23 | Kali moti |
| 11 | JG-74 | 24 | Allahabad desi chana |
| 12 | Sadabahar | 25 | DCP-92 |
| 13 | Vaibhav | - | - |
Table text extracted from the original PDF; superscript letters are shown inline. The original table image is below.
View original table image
Results and Discussion
Results and Discussion
Genetic variability studies
The analysis of variance revealed significant differences for all the traits examined, including days to 50% flowering, days to maturity, plant height, numbers of primary and secondary branches per plant, numbers of pods per plant, numbers of seeds per pod, 100-seed weight, harvest index, biological yield per plant, and seed yield per plant (Table 2). This considerable variability offers promising opportunities for enhancing desired traits in chickpea breeding programs.
| Genotype | DTF | DM | PHT | PB | BY | SYP | HSW | SY | TP | PBL | S/P | HI |
|---|---|---|---|---|---|---|---|---|---|---|---|---|
| JG-14 | 76.000 | 111.000 | 46.333 | 6.333 | 33.733 | 9.467 | 12.967 | 16.110 | 46.933 | 15.000 | 1.267 | 28.333 |
| JG-17 | 78.333 | 117.333 | 34.333 | 6.333 | 44.600 | 15.333 | 19.133 | 21.807 | 51.600 | 27.000 | 1.167 | 34.867 |
| JG-24 | 73.667 | 114.000 | 44.667 | 6.333 | 31.933 | 10.033 | 19.400 | 19.307 | 49.433 | 19.333 | 1.133 | 32.033 |
| GG-2 | 79.333 | 115.000 | 52.667 | 6.667 | 28.833 | 11.167 | 17.533 | 13.610 | 43.300 | 16.667 | 1.133 | 38.367 |
| BDG-72 | 75.667 | 115.000 | 42.667 | 4.333 | 25.100 | 12.567 | 17.667 | 17.503 | 47.300 | 27.333 | 1.133 | 48.233 |
| GCP-105 | 80.667 | 116.333 | 35.333 | 5.667 | 46.200 | 11.533 | 17.567 | 16.387 | 46.267 | 16.333 | 1.333 | 24.900 |
| GNG-663 | 76.667 | 114.667 | 47.333 | 5.667 | 36.933 | 13.667 | 16.600 | 15.970 | 41.033 | 20.000 | 1.167 | 37.400 |
| ICC-15614 | 64.333 | 113.000 | 63.000 | 6.333 | 32.700 | 15.233 | 17.333 | 17.360 | 46.467 | 18.000 | 1.233 | 30.667 |
| ICC-1205 | 56.333 | 109.333 | 35.667 | 6.000 | 42.400 | 13.700 | 23.333 | 15.417 | 48.033 | 22.000 | 1.200 | 32.400 |
| IPC-18-121 | 67.000 | 112.000 | 45.000 | 6.667 | 48.400 | 9.833 | 24.533 | 17.640 | 48.000 | 21.000 | 1.500 | 20.667 |
| JG-74 | 61.333 | 108.667 | 47.333 | 5.667 | 51.400 | 10.867 | 20.200 | 21.530 | 51.767 | 21.333 | 1.200 | 21.000 |
| Sadabahar | 62.667 | 107.333 | 42.333 | 6.667 | 45.533 | 10.600 | 24.733 | 17.700 | 47.900 | 15.000 | 1.333 | 23.233 |
| Vaibhav | 65.667 | 112.000 | 57.333 | 6.667 | 51.033 | 11.800 | 17.600 | 20.830 | 51.367 | 19.333 | 1.200 | 23.567 |
| Aparna | 64.333 | 112.667 | 37.667 | 6.667 | 38.900 | 11.267 | 19.000 | 15.137 | 45.333 | 13.333 | 1.400 | 28.933 |
| Vishwas | 65.333 | 112.333 | 49.000 | 4.000 | 58.500 | 16.167 | 20.500 | 23.750 | 53.133 | 18.333 | 1.400 | 27.633 |
| K-850 | 73.667 | 111.667 | 48.000 | 5.333 | 42.933 | 9.833 | 16.200 | 13.960 | 45.233 | 22.667 | 1.533 | 22.767 |
| IPC 18-131 | 71.667 | 110.667 | 45.333 | 6.333 | 37.200 | 10.333 | 12.867 | 16.113 | 47.000 | 18.000 | 1.233 | 28.367 |
| Kabuli Gold | 67.333 | 109.333 | 38.000 | 4.667 | 35.233 | 7.233 | 15.067 | 14.373 | 42.200 | 17.333 | 1.200 | 20.667 |
| IPC-15-108 | 63.333 | 110.000 | 39.000 | 5.000 | 40.033 | 15.800 | 24.433 | 15.070 | 44.233 | 15.333 | 1.367 | 39.167 |
| IPC-12-131 | 71.000 | 115.333 | 42.333 | 4.333 | 36.500 | 13.300 | 15.167 | 12.363 | 40.967 | 20.667 | 1.267 | 36.367 |
| IPC-18-52 | 64.667 | 111.333 | 40.333 | 5.333 | 40.167 | 13.333 | 15.600 | 15.833 | 45.467 | 19.000 | 1.300 | 33.600 |
| Radha | 61.000 | 112.333 | 48.333 | 5.000 | 50.233 | 9.767 | 25.333 | 19.517 | 49.567 | 24.000 | 1.200 | 19.533 |
| Kali moti | 69.000 | 111.333 | 47.333 | 7.000 | 53.533 | 15.167 | 14.200 | 23.890 | 54.567 | 22.333 | 1.467 | 28.067 |
| Allahabad desi chana | 65.333 | 111.333 | 56.333 | 7.667 | 50.200 | 10.067 | 14.633 | 19.443 | 50.367 | 20.333 | 1.400 | 20.067 |
| DCP 92-3 (ch) | 62.667 | 111.333 | 33.000 | 4.333 | 32.800 | 16.567 | 15.500 | 13.890 | 43.233 | 21.000 | 1.067 | 50.167 |
| Min. | 56.333 | 107.333 | 33.000 | 4.000 | 25.100 | 7.233 | 12.867 | 12.363 | 40.967 | 13.333 | 1.067 | 19.533 |
| Max. | 80.667 | 117.333 | 63.000 | 7.667 | 58.500 | 16.567 | 25.333 | 23.890 | 54.567 | 27.333 | 1.533 | 50.167 |
| Mean | 67.687 | 112.000 | 44.055 | 5.570 | 40.035 | 13.209 | 18.209 | 19.814 | 47.936 | 19.886 | 1.267 | 31.775 |
| C.D. | 7.600 | 5.651 | 7.601 | 2.167 | 7.681 | 4.774 | 3.502 | 5.275 | 7.561 | 4.166 | 0.294 | 11.095 |
| SE(m) | 2.665 | 1.941 | 2.665 | 0.753 | 2.693 | 1.674 | 1.228 | 1.849 | 2.651 | 1.460 | 0.103 | 3.890 |
| SE(d) | 3.768 | 2.746 | 3.769 | 1.065 | 3.808 | 2.367 | 1.737 | 2.615 | 3.749 | 2.065 | 0.146 | 5.501 |
| C.V. | 6.720 | 2.997 | 10.316 | 22.487 | 11.266 | 23.791 | 11.632 | 18.430 | 9.722 | 12.889 | 14.015 | 22.427 |
Table text extracted from the original PDF; superscript letters are shown inline. The original table image is below.
View original table image
Previous studies by Dehal et al. (2016) [5] and Kumar et al.
(2014) [20] have reported similar findings regarding genetic variability in chickpeas. Genetic parameters related to yield and its contributing traits are presented in Table 3. The results showed that the percentage of phenotypic coefficient of variation (PCV%) was higher than the genotypic coefficient of variation (GCV%) for all the traits studied. High PCV and GCV were observed for biological yield per plant, followed by numbers of pods per plant and 100-seed weight. Similarly, moderate estimates of PCV and GCV were recorded for numbers of seeds per pod, as well as numbers of primary and secondary branches per plant, harvest index, plant height, and seed yield per plant. In contrast, the lowest estimates of PCV and GCV were noted for days to 50% flowering and maturity. These findings are consistent with those of Yadav et al.
| — | DTF | DM | PHT | PB | BY | SYP | HSW | TSY | TP | PB | SP | HI |
|---|---|---|---|---|---|---|---|---|---|---|---|---|
| DTF | 1.000 | -1.156 | -0.458 | 0.501 | 1.093 | 0.176 | 0.018 | 0.056 | 0.373 | 0.517 | -0.060 | 1.069 |
| DM | 1.000 | 0.278* | 0.582 | 0.468 | 0.224 | 0.179 | 0.334 | -0.348 | 0.184 | -0.247* | -0.070 | |
| PHT | 1.000 | -0.586 | 0.329 | 0.075 | 0.153 | 0.862 | 0.143 | -0.212 | -0.401 | -0.166 | ||
| PB | 1.000 | -0.510 | 0.188 | 0.320 | 1.041 | 0.659 | -0.128 | 0.665 | -0.432 | |||
| BY | 1.000 | -0.223 | -0.438 | 0.110 | 0.846 | 0.420 | -0.400 | -0.140 | ||||
| SYP | 1.000 | 0.613 | 0.987 | -0.366 | 0.459 | 0.102 | -0.527 | |||||
| HSW | 1.000 | -0.757 | 0.998 | -0.018 | -0.006 | -0.191 | ||||||
| TSY | 1.000 | -0.610 | 0.331 | 0.739 | -0.291 | |||||||
| TP | 1.000 | -0.445 | -0.167 | 0.121 | ||||||||
| PB | 1.000 | 0.654 | -0.044 | |||||||||
| SP | 1.000 | 0.280 | ||||||||||
| HI | 1.000 |
Table text extracted from the original PDF; superscript letters are shown inline. The original table image is below.
View original table image
(2015), Kumar et al. (2018) [21] , and Kumar et al. (2020) [22] . Higher estimates of heritability in the broad sense were observed for traits such as plant height, numbers of pods per plant, biological yield per plant, days to maturity, 100-seed weight, numbers of primary and secondary branches per plant, harvest index, yield per plant, numbers of seeds per pod, and days to 50% flowering. These results are in line with previous studies by Malik et al. (2010) [23] , Babbar et al. (2012) [6] , Pandey et al. (2013) [32] , Monpara and Gaikwad (2014) [29] , Sowjanya et al. (2017) [42] , and Honnappa et al. (2018) [15] . Furthermore, higher genetic advance was documented for biological yield per plant, followed by numbers of pods per plant, 100-seed weight, numbers of primary and secondary branches per plant, harvest index, plant height, numbers of seeds per pod, and yield per plant. Moderate estimates of genetic advance as a percentage of means were recorded for days to maturity, while a lower estimate was observed for days to 50% flowering. These findings align with those of Solanki et al. (2019) [37] , Tsehaye et al. (2020) [44] , and Kumar et al. (2020) [22] .
Correlation coefficient analysis
Correlation coefficients serve as a method to identify the key traits that influence dependent characteristics, such as seed yield. They aid in developing selection criteria aimed at simultaneously improving multiple traits and overall economic production. The correlations among various traits are presented in Tables 4 and5.
A highly significant and positive genotypic correlation was observed between seed yield per plant and biological yield per plant, as well as with the numbers of secondary branches per plant and pods per plant. Conversely, a significant negative correlation was noted between seed yield per plant and harvest index. These findings closely resemble earlier studies conducted by Ali et al. (2011) [1] and Mushtaq et al.
(2013) [30] for the numbers of secondary branches per plant, and by Shukla and Babbar (2011) [36] and Tadesse et al.
(2016) [46] for the numbers of pods per plant. Similarly, significant positive phenotypic correlations were found between seed yield per plant and biological yield per plant, as well as with the numbers of secondary branches per plant. These results align with the research conducted by Shanmugam and Kalaimagal (2019) [34] and Kumar et al.
(2020) [22] . At the genotypic level, coefficient analysis revealed that days to 50% flowering exhibited the highest positive direct effect on seed yield per plant, followed by the numbers of secondary branches per plant, plant height, numbers of pods per plant, days to maturity, and 100-seed weight. Conversely, significant negative direct effects on seed yield per plant were observed for harvest index, biological yield per plant, numbers of primary branches per plant, and numbers of seeds per pod. These findings also indicated a direct positive effect on 100-seed weight. Previous studies by Babbar et al. (2012) [6] , Shrivastava et al. (2012) [35] , and Jain et al. (2022) [16] have reported similar findings regarding the positive direct effect of days to 50% flowering, numbers of secondary branches per plant, plant height, numbers of pods per plant,
Conclusion
In conclusion, higher genotypic coefficient of variation and heritability, along with genetic advance as a percentage of mean, were observed for biological yield per plant, numbers of pods per plant, 100-seed weight, and seed yield per plant. This indicates the prevalence of additive gene action, suggesting that selection based on these traits could be beneficial. Seed yield per plant showed a highly significant and positive association with biological yield, numbers of secondary branches per plant, and numbers of pods per plant. Path analysis revealed that biological yield per plant had a positive and direct effect on seed yield per plant. Therefore, selecting any of these traits may lead to an increase in the others, suggesting that these traits should be considered when developing plant types aimed at achieving higher yields. Thus, for yield enhancement, these traits may be directly selected.
Figures and tables from the paper
| — | DTF | DM | PHT | PB | BY | SYP | HSW | TSY | TP | PB | SP | HI |
|---|---|---|---|---|---|---|---|---|---|---|---|---|
| DTF | 1.000 | -0.206 | -0.078 | 0.193 | 0.899 | 0.207 | 0.087 | 0.083 | 0.151 | 0.29 | 0.001 | 0.569 |
| DM | 1.000 | 0.089 | 0.099 | 0.159 | 0.200 | 0.145 | 0.296 | -0.161 | 0.106 | 0.004 | 0.033 | |
| PHT | 1.000 | -0.290 | 0.101 | -0.002 | 0.066 | 0.500 | -0.043 | -0.052 | -0.189 | 0.103 | ||
| PB | 1.000 | -0.241 | 0.056 | 0.087 | 0.441 | 0.076 | -0.162 | 0.040 | -0.289 | |||
| BY | 1.000 | -0.096 | 0.043 | 0.061 | 0.170 | 0.136 | -0.087 | -0.133 | ||||
| SYP | 1.000 | 0.636 | 0.340 | -0.009 | 0.125 | -0.137 | -0.351 | |||||
| HSW | 1.000 | -0.522 | 0.019 | -0.077 | -0.176 | -0.146 | ||||||
| TSY | 1.000 | -0.288 | 0.002 | 0.078 | -0.148 | |||||||
| TP | 1.000 | -0.199 | -0.237 | 0.023 | ||||||||
| PB | 1.000 | 0.233 | -0.159 | |||||||||
| SP | 1.000 | 0.159 | ||||||||||
| HI | 1.000 |
Table text extracted from the original PDF; superscript letters are shown inline. The original table image is below.
View original table image
| Character | Min. | Max. | Mean | h2 (%) | GCV (%) | PCV (%) | GA % means | % Contribution |
|---|---|---|---|---|---|---|---|---|
| DTF | 56.33 | 80.67 | 67.69 | 62.898 | 8.749 | 11.03 | 14.29 | 14.68 |
| DM | 107.33 | 117.33 | 112.00 | 16.415 | 1.328 | 3.28 | 1.10 | 13.22 |
| PHT | 33.00 | 63.00 | 44.06 | 69.483 | 15.565 | 18.67 | 26.72 | 13.44 |
| PB | 4.00 | 7.67 | 5.57 | 14.948 | 10.047 | 25.99 | 8.00 | 8.85 |
| BY | 25.10 | 58.50 | 40.04 | 73.690 | 19.338 | 22.53 | 34.19 | 9.85 |
| SYP | 7.23 | 16.57 | 13.21 | 29.463 | 15.376 | 28.33 | 17.19 | 11.05 |
| HSW | 12.87 | 25.33 | 18.21 | 73.507 | 19.375 | 22.60 | 34.22 | 7.55 |
| TSY | 12.36 | 23.89 | 19.81 | 37.854 | 15.330 | 24.92 | 19.429 | 12.15 |
| TP | 40.97 | 54.57 | 47.94 | 23.371 | 5.369 | 11.11 | 5.347 | 13.48 |
| PB | 13.33 | 27.33 | 19.89 | 61.522 | 16.297 | 20.78 | 26.33 | 10.21 |
| SP | 1.07 | 1.53 | 1.27 | 13.649 | 5.572 | 15.08 | 4.24 | 10.93 |
| HI | 19.53 | 50.17 | 31.78 | 54.733 | 24.661 | 33.33 | 37.58 | 11.03 |
Table text extracted from the original PDF; superscript letters are shown inline. The original table image is below.
View original table image
References
56 in the original paper- Ali Q, Tahir MH, Sadaqat HA, Arshad S, Farooq J, Ahsan M. Genetic variability and correlation analysis for quantitative traits in chickpea genotypes (Cicer arietinum L.). Afr J Bacteriol Res. 2011;3(1):6-9.
- Asati R, Tripathi MK, Tiwari S, Yadav RK, Tripathi N. Molecular breeding and drought tolerance in chickpea. Life. 2022;12:1846.
- Asati R, Yadav RK. Genetic variability in F2 generation of rice (Oryza sativa L.). Int J Curr Microbiol Appl Sci. 2020;11:2548-2554.
- Dewey DR, Lu KHA. Correlation and path coefficient analysis of components in crested wheatgrass seed production. Agron J. 1959;51:515-518.
- Dehal IN, Rama Kalia, Bhupendar Kumar. Genetic estimates and path coefficient analysis in chickpea (Cicer arietinum L.) under normal and late-sown environments. Legume Res. 2016;39(4):510-516.
- Babbar A, Prakash V, Tiwari P, Iquebal MA. Genetic variability for chickpea (Cicer arietinum L.) under latesown season. Legume Res. 2012;35(1):1-7.
- Bhawar PC, Tiwari S, Tripathi MK, Tomar RS, Sikarwar RS. Screening of groundnut germplasm for foliar fungal diseases and population structure analysis using gene-based SSR markers. Curr J Appl Sci Technol. 2020;39(2):75-84.
- Barfa D, Tripathi MK, Kandalkar VS, Gupta JC, Kumar G. Heterosis and combining ability analysis for seed yield in Indian mustard (Brassica Juncea (L.) Czern & Coss.). Ecol Environ Conserv. 2017;23:75-83.
- Baghel R, Sharma AK, Tiwari S, Tripathi MK, Tripathi N. Genetic diversity analysis of Indian mustard (Brassica spp.) germplasm lines using SSR molecular markers. Int J Curr Microbiol Appl Sci. 2020;9(12):137-143.
- Burton GW. Quantitative inheritance in grasses. Proc 6th Int Grassland Congr. 1952;1:127-183.
- Burton GW, DeVane E. Estimating heritability in tall fescue from replicated clonal material. Agron J. 1953;45:475-481.
- Choudhary ML, Tripathi MK, Tiwari S, Pandya RK, Gupta N, Tripathi N. Screening of pearl millet (Pennisetum glaucum (L.) R. Br.) germplasm lines for drought tolerance based on morpho-physiological traits and SSR markers. Curr J Appl Sci Technol. 2021;40(5):46-63.
- Dawane JK, Jahagirdar JE, Shedge PJ. Correlation studies and path coefficient analysis in chickpea (Cicer arietinum L.). Int J Curr Microbiol Appl Sci. 2020;9(10):1266-1272.
- Gupta N, Tiwari S, Tripathi MK, Bhagyawant SS. Antinutritional and protein-based profiling of diverse desi and wild chickpea accessions. Curr J Appl Sci Technol. 2021;40(6):7-18.
- Honnappa DM, Mannur I, Shankergoud JM, Nidagundi S, Muniswamy, Hosamani M. Genetic variability and heritability study for quantitative traits in advance generation (F5) of cross between green seeded desi (GKB-10) and white kabuli (MNK-1) chickpea genotypes (Cicer arietinum L.). Int J Curr Microbiol Sci. 2018;7(12):727-734.
- Jain N, Babbar A, Kumawat S, Yadav RK, Asati R. Correlation and path coefficient analysis in the promising advance chickpea lines. Pharma Innovation. 2022;11(5):2124-2128.
- Johnson HW, Robinson HF, Comstock RE. Estimates of genetic and environmental variability in wheat. Agron J. 1955;47:314-318.
- Jukanti AK, Gaur PM, Gowda CLL, Chibbar RN. Chickpea: Nutritional properties and its benefits. Br J Nutr. 2012;108(Suppl 1):S11-S26.
- Khan M, Qureshi S. Path coefficient and correlation analysis studies on variation induced by gamma irradiation in M1 generation of chickpea (Cicer arietinum L.). Online J Biol Sci. 2001;3:108-110.
- Kumar R, Pandey SK, Babbar A, Mishra DK. Genetic variability, character association and path coefficient analysis in chickpea grown under heat stress conditions. Electron J Plant Breed. 2014;5:812-819.
- Kumar A, Agrawal T, Kumar S, Kumar A, Kumar RR, Kumar M. Identification and evaluation of heat tolerant chickpea genotypes for enhancing its productivity in Rice Fallow area of Bihar and mitigating impacts of climate change. J Pharmacogn Phytochem. 2018;1:1105-1113.
- Kumar A, Kumar M, Chand P, Singh SK, Kumar P, Gangwar LK. Studies on genetic variability and interrelationship among yield and related traits of parents and F1 population in Chickpea (Cicer arietinum L.). J Pharmacogn Phytochem. 2020;9(3):1434-1438.
- Malik SR, Bakhsh A, Asif MA, Iqbal UM, Iqbal SM. Assessment of genetic variability and interrelationship among some agronomic traits in chickpea. Int J Agric Biol. 2010;12(1):81-85.
- Makwana K, Tiwari S, Tripathi MK, Sharma AK, Pandya RK, Singh AK. Morphological characterization and DNA finger printing of pearl millet [Pennisetum glaucum (L.)] germplasms. Range Manag Agrofor. 2021;42(2):205-211.
- Miller PA, Williams JE, Robinson HF, Comstock RE. Estimates of variance and covariance in upland cotton and their implications in selection. Agron J. 1958;50:126-131.
- Mishra N, Tripathi MK, Tiwari S, Tripathi N, Trivedi HK. Morphological and molecular screening of soybean genotypes against yellow mosaic virus disease. Legume Res. 2020. DOI: 10.18805/LR-4240.
- Mishra N, Tripathi MK, Tiwari S, Tripathi N, Gupta N, Sharma A. Evaluation of diversity among soybean genotypes via yield attributing traits and SSR molecular markers. Curr J Appl Sci Technol. 2021;40(21):9-24.
- Merrill] genotypes in respect to drought. Legume Res. 2021. DOI:10.18805/LR-4550.
- Monpara BA, Gaikwad SR. Combining high seed number and weight to improve seed yield potential of chickpea in India. Afr Crop Sci J. 2014;22(1):1-8.
- Mushtaq MA, Bajwa MM, Saleem M. Estimation of genetic variability and path analysis of grain yield and its components in chickpea (Cicer arietinum L.). Int J Sci Eng Res. 2013;4(1):2229-5518.
- Nath N, Tarkeswar S, Mishra G. Analysis of correlation and path coefficient for grain yield and its attributing traits in chickpea (Cicer arietinum L.) under timely sown conditions. Biol Forum Int J. 2022;14(2):926-929.
- Pandey A, Gupta S, Kumar A, Thongbam PD, Pattanayak A. Genetic divergence, path coefficient and cluster analysis of chickpea (Cicer arietinum L.) cultivars, in the mid-altitudes of Meghalaya. Indian J Agric Sci. 2013;83(12):1300-1304.
- Rajpoot NS, Tripathi MK, Tiwari S, Tomar RS, Kandalkar VS. Characterization of Indian mustard germplasm on the basis of morphological traits and SSR markers. Curr J Appl Sci Technol. 2020;39(48):300-311.
- Shanmugam M, Kalaimagal T. Genetic variability, correlation and path coefficient analysis in chickpea (Cicer arietinum L.) for yield and its component traits. Int J Curr Microbiol Appl Sci. 2019;8(5):1801-1808.
- Shrivastava A, Babbar A, Shrivastava SP, Shukla SS. Variability studies in some genotypes of chickpea (Cicer arietinum L.) under rice fallow. J Food Legumes. 2012;25(1):70-72.
- Shukla N, Babbar A. Association analysis of morphophonological traits on yield in chickpea lines evaluated in normal and heat stress environments. J.N.K.V.V. Res J. 2011;45(1):52-57.
- Solanki RS, Biswal M, Kumawat S, Babbar A. Characterization of indigenous and exotic chickpea lines for qualitative traits. Int J Chem Stud. 2019;7(4):1018-1023.
- Sahu VK, Tiwari S, Tripathi MK, Gupta N, Tomar RS, Yasin M. Morpho-physiological and biochemical traits analysis for Fusarium wilt disease using gene-based markers in desi and Kabuli genotypes of chickpea (Cicer arietinum L.). Indian J Genet. 2020;80:16.
- Sahu VK, Tiwari S, Gupta N, Tripathi MK, Yasin M. Evaluation of physiological and biochemical contents in desi and Kabuli chickpea. Legume Res. 2020. DOI:10.18805/LR-4265
- Singh JL, Prasad C, Madakemohekar AH, Bornare SS. Genetic variability and character association in diverse genotypes of barley (Hordeum vulgare L.) The Bioscan (Suppl on Genetics and Plant Breeding). 2014;9(2):759761.
- Singh SP. Genetic variability and response to selection in chickpea. (Cicer arietinum L.). Int J Plant Sci. 2006;1(2):232-233.
- Sowjanya BA, Lavanya GR, Kumar A. Genetic variability and correlation analysis in chickpea. Res Environ Life Sci. 2017;10(5):429-431.
- Thudi M, Gaur PM, Krishnamurthy L, Mir RR. Genomics-assisted breeding for drought tolerance in chickpea. Funct Plant Biol. 2014;41(11):1178-1190.
- Tsehaye A, Fikre, Bantayhu M. Genetic variability and association analysis of desi type chickpea (Cicer arietinum L.) advanced lines under potential environment in North Gondar, Ethiopia. Cogent Food & Agriculture. 2020;6(1):180-193.
- Tripathi MK, Tomar SS, Tiwari VK, Awasthi D, Gupta JC. Heterosis in Indian mustard [Brassica juncea (L.) Czern and Coss]. Progress in Research. 2015;10:33763379.
- Tadesse M, Fikre A, Eshete M, Girma N, Korbu L, Mohamed R, Bekele D. Correlation and Path Coefficient Analysis for Various Quantitative Traits in Desi Chickpea Genotypes under Rainfed Conditions in Ethiopia: Canadian Center of Science and Education Journal of Agricultural Science. 2016;8(12):112-116.
- Tripathi N, Tripathi MK, Tiwari S, Payasi DK. Molecular breeding to overcome biotic stresses in soybean: update. Plants (Basel). 2022;11(15):1967.
- Varshney RK, Song C, Saxena RK, Azam S, Yu S. Draft genome sequence of chickpea (Cicer arietinum) provides a resource for trait improvement. Nat Biotechnol. 2013;31:240-246.
- Verma K, Tripathi MK, Tiwari S, Tripathi N. Analysis of genetic diversity among Brassica juncea genotypes using morpho-physiological and SSR markers. Int J Curr Microbiol Appl Sci. 2014;10(01):1108-1117.
- Weber CR, Moorthy BR. Heritable and non-heritable relationship and variability of oil content and agronomic characteristics in the F generation of soybean crosses. J Agron. 1952;44:202-209.
- Wright S. Correlation and causation. J Agric Res. 1921;20:557-587.
- Yadav PK, Tiwari S, Kushwah A, Tripathi MK, Gupta N, Tomar RS. Morpho-physiological characterization of bread wheat genotypes and their molecular validation for rust resistance genes Sr2, Sr31 and Lr24. Proc Indian Natl Sci Acad. 2021;87:534-545.
- Yadav PK, Singh AK, Tripathi MK, Tiwari S, Rathore J. Morpho-physiological characterization of maize (Zea mays L.) genotypes against drought. Biol Forum Int J. 2022;14(2):0975-1130.
- Yadav PK, Singh AK, Tripathi MK, Tiwari S, Yadav SK, Tripathi N. Morpho-Physiological and molecular characterization of maize (Zea mays L.) genotypes for drought tolerance. Eur J Appl Sci. 2022;10(6):65-87.
- Yadav LN, Tripathi MK, Sikarwar RS, Mishra AK. Heterosis in sesame. Sesame & Safflower Newsletter. 2005;20:6-10.
- Yadav P, Tripathi DK, Khan KK, Yadav AK. Determination of genetic variation and heritability estimates for morphological and yield traits in chickpea (Cicer arietinum L.) under late sown conditions. Indian J Agric Sci. 2015;85(7):157-162.
Cited by 1
From OpenAlex, OpenCitations and reference lists read by Scinovex
- Quantitative trait association and genetic diversity analysis in chickpea (Cicer arietinum L.) genotypes
Sumit Padol, Akash Barela, Shama Parveen, Vedant Sachan, Pramod Kumar Yadav, Sumit Ambore · International Journal of Advanced Biochemistry Research · 2026
Chickpea is grown on a large scale in India but the productivity is very low as compared to other chickpea-growing countries. Because, in India, the crop is affected by many biotic and abiotic stresses and also has a narrow genetic base in germplasm lines, which are the prerequisite of any breeding program for developing high-yield varieties. Understanding the genetic associations between yield components is crucial for developing superior chickpea cultivars. This study evaluated 53 chickpea genotypes for nine morpho-agronomic traits to identify key selection criteria through correlation and c