
Research article · 2024 · Full text
International Journal of Agriculture Extension and Social DevelopmentAn economic analysis of carrot production in Bulandshahr district of Uttar Pradesh, India
Volume 7(5) · Pages 133–136 · DOI: 10.33545/26180723.2024.v7.i5b.610 ↗
Research areasAgricultural Economics and Practices
Abstract
Author-writtenThe present study was conducted to know the cost of cultivation, different costs and benefit-cost ratio incurred in carrot production in different farm size groups that is marginal, small, medium and large. The research was undertaken in Sikandrabad block of Bulandshahr district of Uttar Pradesh, which was selected purposively on the basis of high production and high number of carrot growers in Sikandrabad block from which 110 growers selected from 7 villages of Sikandrabad block. The cost of cultivation of carrot varied among the size groups. The cost of cultivation incurred in carrot production per hectare was highest in large size growers Rupees 150079.63 and lowest for marginal size growers was Rs. 142277.62. Cost incurred for small and medium size growers was Rs. 144496.84 and 147814.17 per hectare respectively. The cost concepts on different size of farm group per hectare, cost A1 was highest for large size of farms Rs. 115371.03 per hectare followed by medium size farms Rs. 108898.24, small size farms Rs. 103536.13, marginal size farms Rs. 102779.54 per hectare respectively. Cost A2 was highest in large size farms Rs. 137371.03 per hectare and lowest for marginal size farm Rs. 124779.54. Cost B was highest in large size of farm groups Rs. 140677.11 per hectare and lowest in marginal size farms Rs. 127465.47 per hectare. Cost benefit ratio was highest in large size farms 1: 1.81 followed by medium size farms 1: 1.71, small size farms 1:1.69 and lowest in marginal farm size 1: 1.66 respectively. The total yield was highest in large size of farm groups which was 60.5 tonne per hectare and lowest in marginal size of farm groups which was 52.6 tonne per hectare.
Summary
Source-checkedPlain-language reading of the full paper, prepared with AI and checked against the text. Each point links to the authors' own words.
Why it matters
- Carrots are considered an important vegetable because they provide high yields per unit of area and are an increasingly significant food source for humans. View evidence ↗
- Bulandshahr is the leading carrot-producing district in Uttar Pradesh, producing 0.008 million tonnes across 1.37 thousand hectares. View evidence ↗
The question
- The study aimed to determine the cost of cultivation, various cost components, and the benefit-cost ratio for carrot production across four farm size groups: marginal, small, medium, and large. View evidence ↗
What they did
- The research was conducted in the Sikandrabad block of Bulandshahr district, Uttar Pradesh, involving 110 growers selected from 7 villages. View evidence ↗
- Growers were categorized by land holding size: marginal (<1 ha), small (1-2 ha), medium (2-10 ha), and large (>10 ha). View evidence ↗
- The cost of cultivation was calculated by summing land preparation, farm operations, fertilizers, manures, weeding, irrigation, plant protection, and harvesting costs. View evidence ↗
What they found
- The cost of cultivation per hectare was highest for large growers (Rs. 150,079.63) and lowest for marginal growers (Rs. 142,277.62). View evidence ↗
- Total yield per hectare was highest for large farm groups (60.5 tonnes) and lowest for marginal farm groups (52.6 tonnes). View evidence ↗
- The benefit-cost ratio was most favorable for large farms (1:1.81) and least favorable for marginal farms (1:1.66). View evidence ↗
What it means
- The authors concluded that large-scale carrot growers derived more benefit than small, marginal, or medium-scale growers. View evidence ↗
Visual summary
2 visualsIllustrations explain the paper; charts are replotted from the paper's own table values.
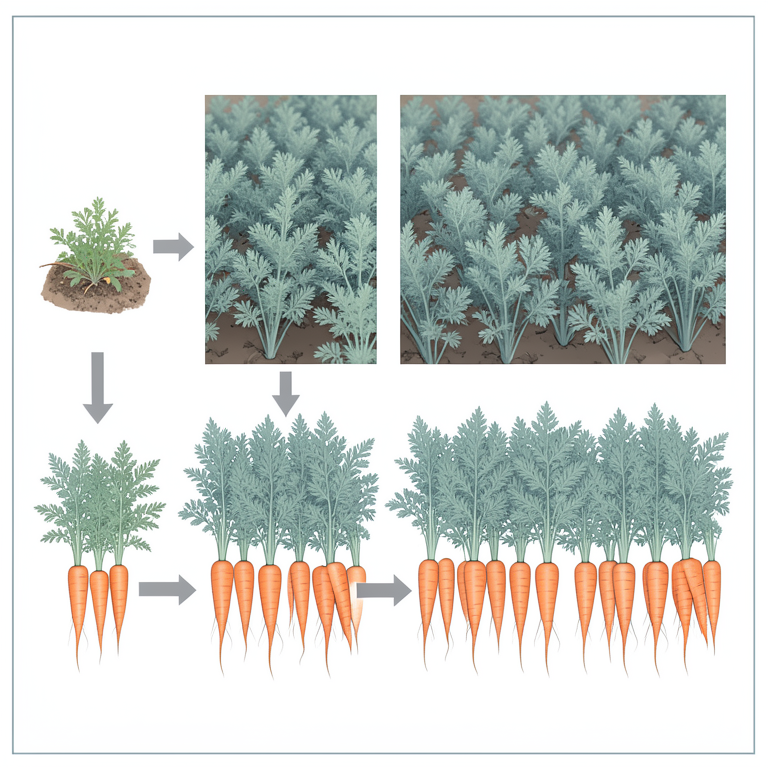
Economic Comparison by Farm Size
AI-generated conceptual illustration (carrot plants in agricultural fields). It explains the idea and does not show study data.
View source evidence ↗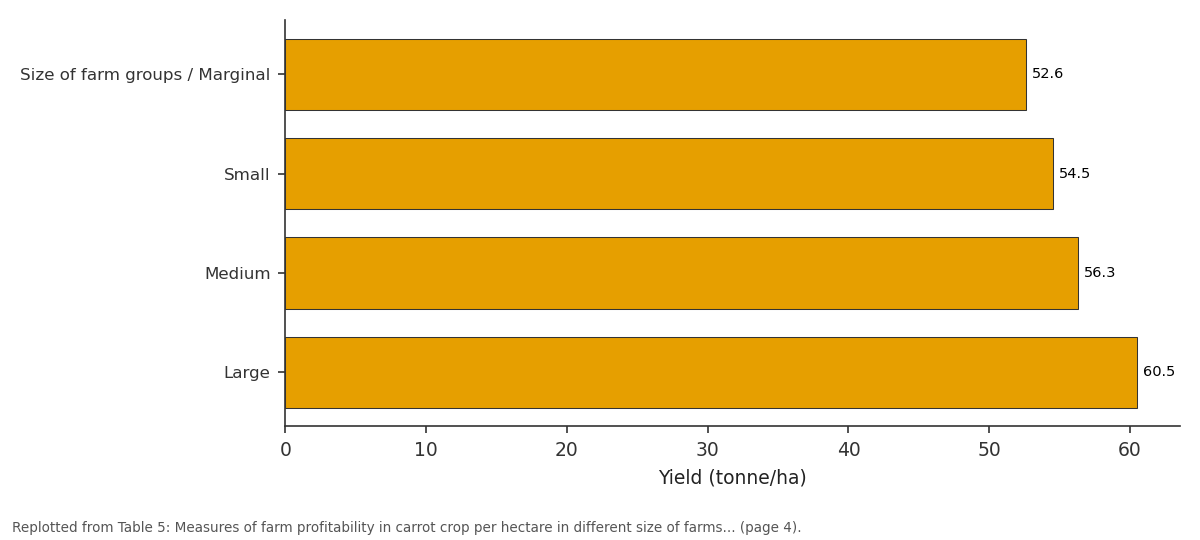
Yield (tonne/ha): Size of farm groups /... vs Small vs Medium vs Large
Replotted from Table 5 (page 4) of the original paper. Every bar is the paper's own table value.
View source evidence ↗Figures & tables
From the original paper Table 1
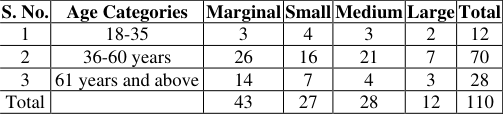 Table 2
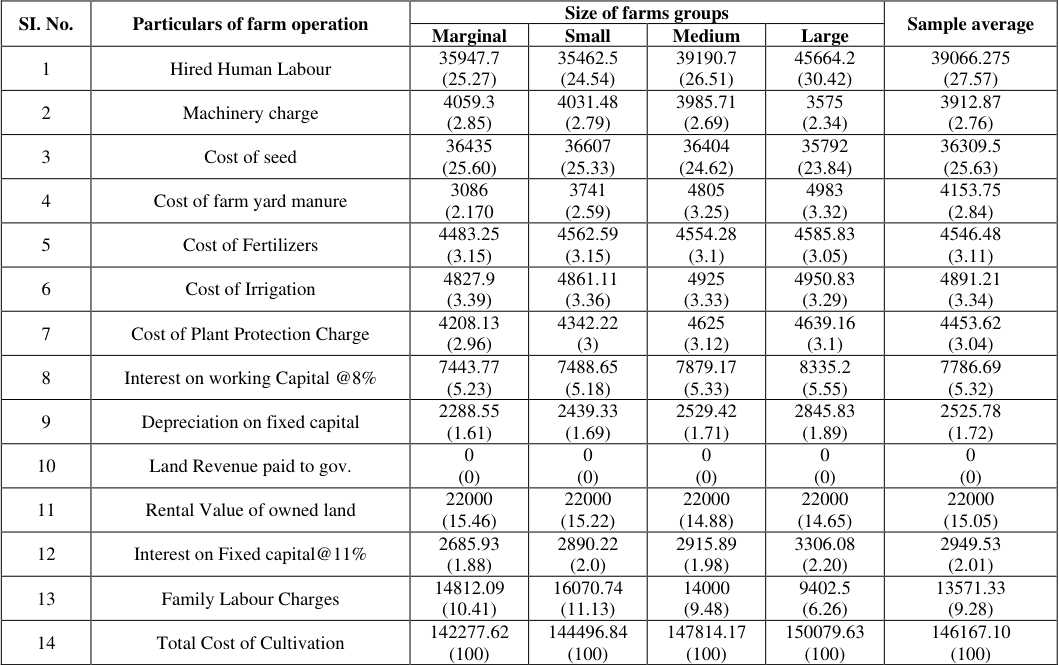 Table 3
 Table 4
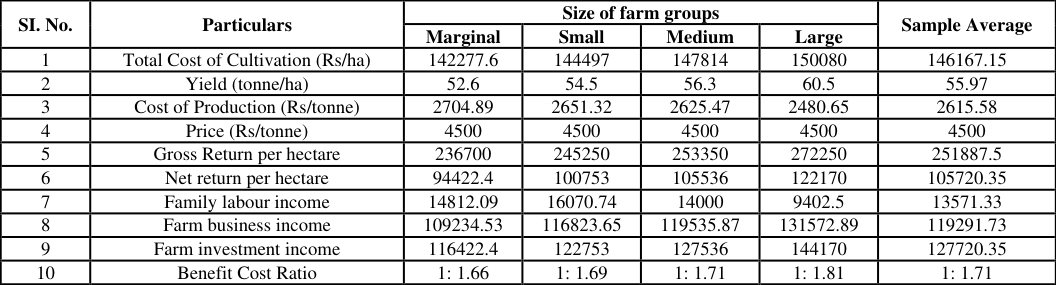 Table 5
Introduction
Carrot (Dacus carota) is a crucial root vegetable grown all over the global in spring, summer season and autumn in temperate place and during wintry weather in tropical and sub-tropical regions. It is a dicotyledonous herbaceous crop, under the family Umbelliferae, which is grown as annual crop for its root. Fresh carrots are firm and crisp, with clean and unblemished skin. Vibrant-orange color shows excessive carotene content material, smaller sorts are the maximum soft (Britannica, T., 2020) [3] . Carrot roots are used as a vegetable for soups, stews, curries and pies, grated roots are used as salad, smooth roots as pickles and Gajar Halwa. the roots as circle and cuts can be dried out. Carrot juice is a wealthy supply of beta carotene that is a herbal pigment that is utilized by body to make nutrition A and it has good amount of fibres (Manglani, 2019) [7] . Due to its high yield per unit area and growing significance as a food source for humans, carrot is an important vegetable. Its orange-yellow colour makes food look prettier on a plate and increases its carotene content, which is a precursor to vitamin A. it is rich in nutrients, including fiber, protein, carbohydrates, vitamin A, potassium, and sodium (Ahmad et al., 2005) [2] . China ranks first in Carrot production in the world. The area under carrot in India was 119 thousand hectares and its production was 0.213 million tonnes. India ranks 14 in carrot production. (Agriculture statistics at glance 2021-2022) [1] . The carrot production in Uttar Pradesh was 178.97 thousand tonnes which covers 6.88 thousand hectares. Among the districts, the leading carrot producing district is Bulandshahr which produces 0.008 million tonnes covering 1.37 thousand hectares followed by Agra which produces 0.0043 million tonnes and covering 0.7 thousand hectares (department of horticulture and food processing. Uttar Pradesh 2022-2023)
Materials and Methods
For this study, multi stage sampling technique was used for the selection of district, block, villages and respondents. A total 110 carrot growers were selected by using a random sampling technique from 7 villages of Sikandrabad block of www.extensionjournal.com Bulandshahr district. The growers were categorised in four different categories according to their land holding size. 1 st category was marginal growers who have land holding size less than 1 hectare, 2 nd category was small growers who have land holding size between 1-to-2-hectare, 3 rd category was medium growers who have land holding size between 2 to 10 hectare and 4 th category was large growers who have land holding size more than 10 hectare. A well-structured and field pre tested interviewing schedule was used for the collection of details related to carrot growers on various aspects of carrot production. In survey data information included was socio-economic profiles of growers, activities involved in carrot production. For economic analysis, benefit cost was used to estimate profitability of carrot farmers. Cost of carrot cultivation was calculated by incorporating all costs such as land preparation costs, different farm operation cost, fertilizers and manures costs, weeding cost, irrigation cost, plant protection cost, harvesting cost, while the secondary data were collected by reviewing various published and unpublished sources as related journal, books and reports The total cost cultivation calculated by adding total fixed cost and total variable cost.
The Gross return calculated by multiplying total yield produce per hectare and price received by farmers. The Net return received by carrot growers was estimated by subtracting total cost of cultivation from the gross return (Olawale Otitoju et al., 2022) [8] . Benefit-Cost ratio was calculated to estimate the return on per rupee investment through the division of revenues to the total cost. Benefit-Cost ratio = gross return/ total cost of cultivation.
Results and Discussion
Results and Discussion
Detail description of the cultivated land holdings in different sizes of farms
The table 1 revealed that the number of carrot growers in different farm size groups were marginal (43), small (27), medium (28) and large (12) respectively. Altogether 110 farms group were selected for study. Average size of the cultivated holding per hectare for marginal size farms was 0.61 hectare followed by 1.51 hectare for small size farms and 6.73 ha for medium size farms group and for large size of farms groups was 12.75 which constituted on sample average of 5.4 ha respectively.
| SI. No. | Particulars | Size of Farms Group | — | — | — | Sample Average |
|---|---|---|---|---|---|---|
| Marginal | Small | Medium | Large | |||
| 1 | Size of Farms group (in no. | 43 | 27 | 28 | 12 | 27.5 |
| 2 | Average land holding(ha) | 0.61 | 1.51 | 6.73 | 12.75 | 5.4 |
Table text extracted from the original PDF; superscript letters are shown inline. The original table image is below.
View original table image
Distribution of respondents based on their age
The composition of respondents based on their age is indicated in table no. 2: 70 respondents belong to age category of 36-60 years which was highest followed by age category 61 years and above (28 respondents) and age category 18-35 has less no. of respondents which was 12.
Conclusion
The study conducted in the Bulandshahr district of Uttar Pradesh provides valuable insights into the economic aspects of carrot production. The majority of carrot growers are aged between 36 to 60 years. Carrot production in the area has witnessed growth attributed to increased productivity and expanded cultivation area. Large farm size carrot growers were more benefited as compared to other farm size groups (small, marginal and medium).
Acknowledgement
AcknowledgementI extend my heartfelt thanks to my advisor Dr. Mukesh Maurya for his continuous support and expert guidance throughout the research process.
Figures and tables from the paper
| S. No. | Age Categories | Marginal | Small | Medium | Large | Total |
|---|---|---|---|---|---|---|
| 1 | 18-35 | 3 | 4 | 3 | 2 | 12 |
| 2 | 36-60 years | 26 | 16 | 21 | 7 | 70 |
| 3 | 61 years and above | 14 | 7 | 4 | 3 | 28 |
| Total | 43 | 27 | 28 | 12 | 110 |
Table text extracted from the original PDF; superscript letters are shown inline. The original table image is below.
View original table image
| SI. No. | Cost Concepts | Size of Farm groups | — | — | — | Sample Average |
|---|---|---|---|---|---|---|
| Marginal | Small | Medium | Large | |||
| 1 | Cost A1 | 102779.54 | 103536.13 | 108898.24 | 115371.03 | 107646.23 |
| 2 | Cost A2 | 124779.54 | 125536.13 | 130889.24 | 137371.03 | 129643.99 |
| 3 | Cost B | 127465.47 | 128426.35 | 133814.13 | 140677.11 | 132595.76 |
| 4 | Cost C | 142277.6 | 144496.8 | 142277.6 | 150079.6 | 146167.05 |
Table text extracted from the original PDF; superscript letters are shown inline. The original table image is below.
View original table image
| SI. No. | Particulars | Size of farm groups | — | — | — | Sample Average |
|---|---|---|---|---|---|---|
| Marginal | Small | Medium | Large | |||
| 1 | Total Cost of Cultivation (Rs/ha) | 142277.6 | 144497 | 147814 | 150080 | 146167.15 |
| 2 | Yield (tonne/ha) | 52.6 | 54.5 | 56.3 | 60.5 | 55.97 |
| 3 | Cost of Production (Rs/tonne) | 2704.89 | 2651.32 | 2625.47 | 2480.65 | 2615.58 |
| 4 | Price (Rs/tonne) | 4500 | 4500 | 4500 | 4500 | 4500 |
| 5 | Gross Return per hectare | 236700 | 245250 | 253350 | 272250 | 251887.5 |
| 6 | Net return per hectare | 94422.4 | 100753 | 105536 | 122170 | 105720.35 |
| 7 | Family labour income | 14812.09 | 16070.74 | 14000 | 9402.5 | 13571.33 |
| 8 | Farm business income | 109234.53 | 116823.65 | 119535.87 | 131572.89 | 119291.73 |
| 9 | Farm investment income | 116422.4 | 122753 | 127536 | 144170 | 127720.35 |
| 10 | Benefit Cost Ratio | 1: 1.66 | 1: 1.69 | 1: 1.71 | 1: 1.81 | 1: 1.71 |
Table text extracted from the original PDF; superscript letters are shown inline. The original table image is below.
View original table image
References
6 in the original paper- Agricultural statistics at a glance 2021-2022. Economics and statistics division, department of Agriculture and farmer welfare, ministry of agriculture & farmers welfare Available at: https://desagri.gov.in/
- Ahmad B, Hassan S, Bakhsh K. Factors affecting yield and profitability of carrot in two districts of Punjab. International Journal of Agriculture & Biology, 2005:7(5):794-798.
- Britannica T. Encyclopaedia Britannica. [Online] Available at: www.britannica.com/plant/carrot (Accessed 18 May 2021); c2020.
- Department of horticulture and food processing, Uttar Pradesh; c2022-2023, Available at: https://uphorticulture.gov.in/
- Manglani S. NDTV FOOD. [Online]; c2019. Available at: www.food.ndtv.com (Accessed 18 May 2021)
- Otitoju O, Adondua MA, Emmanuel OP, Grace OT. Risk assessment of pesticide residues in some samples of carrots (Daucus carota). Int. J. Adv. Biochem. Res. 2022;6(2):42-48. DOI: 10.33545/26174693.2022.v6.i2a.133
Cited by 1
From OpenAlex, OpenCitations and reference lists read by Scinovex
- Cost economic analysis of sugarcane cultivation in Kanpur Nagar district of Uttar Pradesh
Kamini Sachan, Ashish Srivastava, Aditya Pratap Singh · International Journal of Agriculture Extension and Social Development · 2026
The present study was conducted to examine the economics of sugarcane cultivation in Kanpur Nagar district of Uttar Pradesh during the agricultural year 2025–2026. A purposive-cum-multistage random sampling technique was employed for the selection of respondents, and a total of 100 sugarcane growers were selected from Patrai block. The selected farmers were categorized into marginal, small, and medium farm groups. Primary data were collected through personal interviews with the help of a pre-structured schedule, while secondary data were obtained from official records, journals, and published