
Research article · 2024 · Full text
International Journal of Agriculture Extension and Social DevelopmentAnalysis of marketing cost, price spread and marketing efficiency of carrot in Bulandshahr district of U.P
Volume 7(5) · Pages 129–132 · DOI: 10.33545/26180723.2024.v7.i5b.609 ↗
Research areasAgricultural Economics and Practices
Abstract
Author-writtenA study of carrot marketing was conducted in Bulandshahr district of Uttar Pradesh and has been presented in the form of tabular analysis. To choose marketing functionaries such as primary and secondary market, a multi-stage stratified sampling approach was used. The market functionaries’ study was taken into consideration in order to gather information on total marketing costs, marketing margins, price spread, marketing efficiency and producer share in consumer rupees as well as to find various marketing channels used in marketing of carrots. All these marketing aspects were computed using this data. Producer to consumer, producer-wholesaler-retailer-consumer and producer-pre harvest contractor/commission agent-wholesaler-retailer-consumer were the three marketing channels that were involved in the marketing of carrots. Channel III was used by highest number of growers and channel I was more profitable for farmers.
Summary
Source-checkedPlain-language reading of the full paper, prepared with AI and checked against the text. Each point links to the authors' own words.
Why it matters
- Carrots are nutritionally significant as they provide high levels of dietary fiber, vitamins, minerals, and carotenoids. View evidence ↗
- Bulandshahr is a major carrot-producing region in Uttar Pradesh, producing 0.080 million tonnes across 13,700 hectares. View evidence ↗
The question
- The study aimed to identify carrot marketing channels and analyze associated costs, margins, price spreads, marketing efficiency, and the producer's share of the consumer's rupee. View evidence ↗
What they did
- The researchers used random sampling to select 110 farmers from seven villages within the Sikandrabad block of Bulandshahr district. View evidence ↗
- Market functionaries were randomly selected at a rate of 10% from the Naveen Sabzi mandi in Bulandshahr and the Azadpur Sabzi mandi in New Delhi. View evidence ↗
- Marketing efficiency was measured using the modified measure of marketing efficiency (MME) based on Acharya's 2011 approach. View evidence ↗
What they found
- The most common marketing route was Channel III (Producer-pre harvest contractor/commission agent-wholesaler-retailer-consumer), used by 81.9% of growers. View evidence ↗
- In Channel I (direct producer to consumer), the total marketing cost was 1,870 Rupees per tonne. View evidence ↗
- Total marketing costs per tonne were highest in Channel II (4,577 Rupees), followed by Channel III (4,348 Rupees) and Channel I (1,870 Rupees). View evidence ↗
- The price spread was highest in Channel II at 5,746 Rupees per tonne, compared to 5,500 Rupees in Channel III and 1,870 Rupees in Channel I. View evidence ↗
- Marketing efficiency was significantly higher in Channel I (3.81) than in Channel III (0.81) or Channel II (0.74). View evidence ↗
- The producer's share of the consumer's rupee was highest in Channel I (79.23%), while it was much lower in Channel III (45%) and Channel II (42.90%). View evidence ↗
What it means
- The authors conclude that direct sales to consumers (Channel I) are the most profitable for growers, providing the highest producer share and efficiency. View evidence ↗
- The authors note that growers frequently use Channel III because they lack the marketing skills necessary to secure better prices independently. View evidence ↗
Visual summary
3 visualsIllustrations explain the paper; charts are replotted from the paper's own table values.
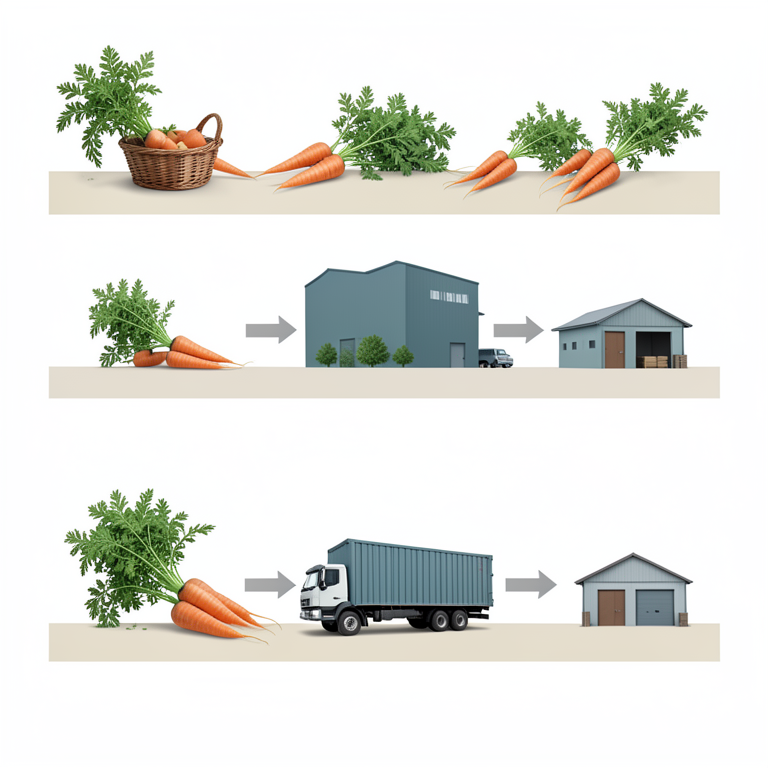
Carrot Marketing Channels
AI-generated conceptual illustration (carrots in a rural agricultural market setting). It explains the idea and does not show study data.
View source evidence ↗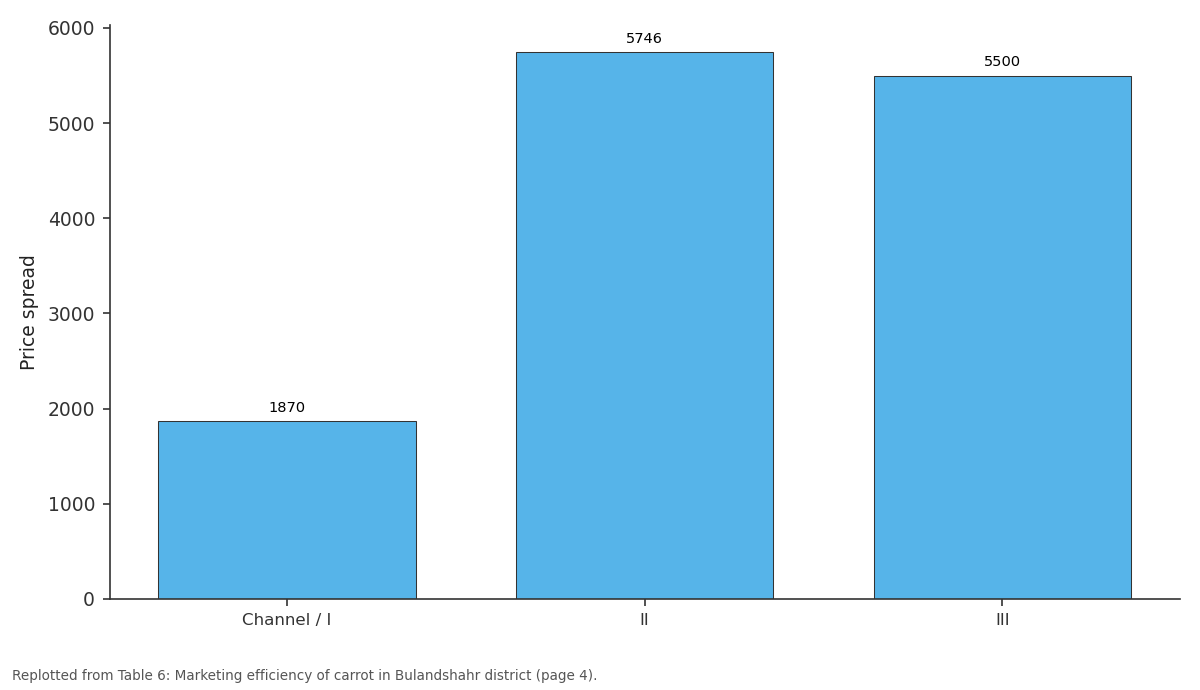
Price spread: Channel / I vs II vs III
Replotted from Table 6 (page 4) of the original paper. Every bar is the paper's own table value.
View source evidence ↗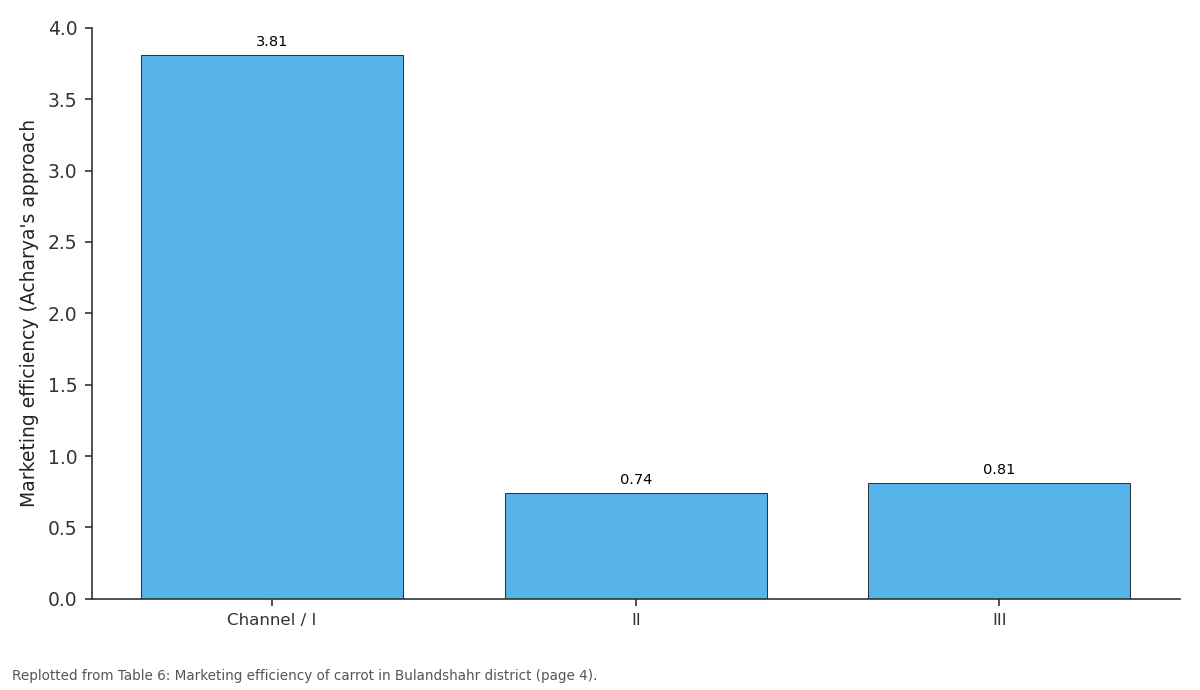
Marketing efficiency (Acharya's approach: Channel / I vs II vs III
Replotted from Table 6 (page 4) of the original paper. Every bar is the paper's own table value.
View source evidence ↗Figures & tables
From the original paper Table 1
 Table 2
 Table 3
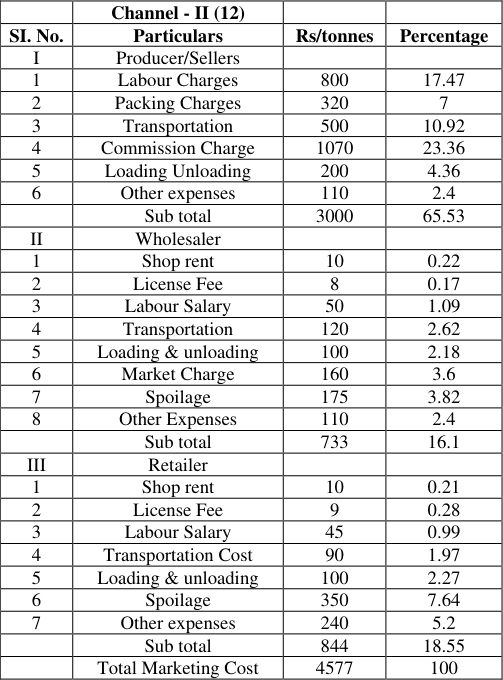 Table 4
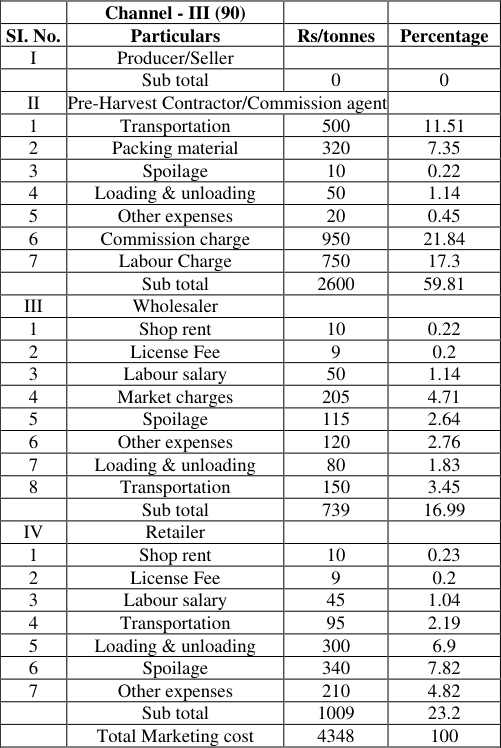 Table 5
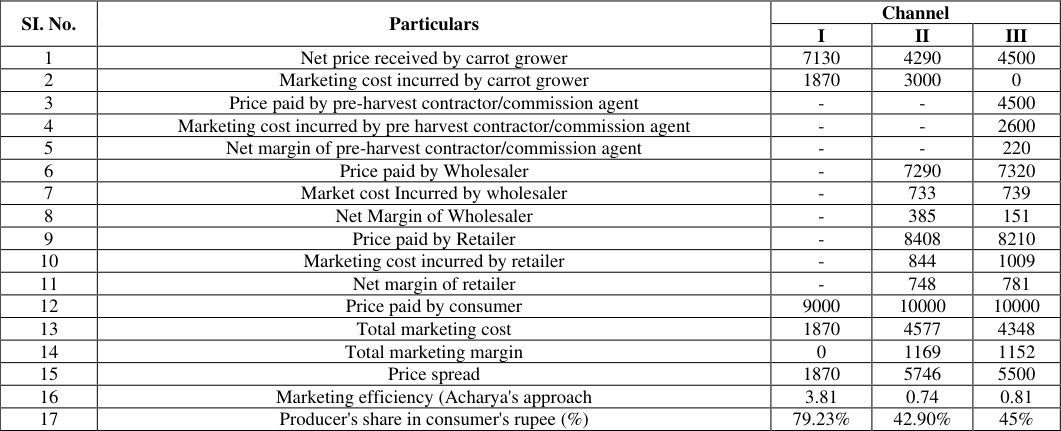 Table 6
Introduction
Carrot is a good source of carotenoids and it contain high amount of dietary fiber, vitamins, and minerals (Nicolle et al., 2004) [11] . It consists of beta-carotene and an appreciable amount of thiamine (Vitamin B1) and Riboflavin (Vit B2) (da Silva Dias, 2014) [7] . Carrots can provide us a lot of vitamin A because they are high in carotenoids (van Het Hof, 2000). Carrots can add more to a person's diet than other vegetables. Researcher have also documented benefits for wound healing, cardiovascular and cholesterol disease reduction, anti-inflammatory, antibacterial, antifungal, antioxidant, and immune-enhancer properties of carrots (Silva Dias, 2014) [7] . Besides that, Carrot fleshy roots are used as salads, soups, and used in vegetable dishes (Amjad, 2005) [6] . China ranks first in carrot production in the world. India's cultivated area is 119,000 hectares and its production is 0.213 million tonnes. India ranks 14 th in carrot production. (Agriculture statistics at a glance 2021-2022) Uttar Pradesh's carrot production is 178,970 tonnes and covers an area of 68,800 hectares. Among these, the largest area of carrot is Bulandshahr with production of 0.080 million tonnes spread over an area of 13,700 hectares, followed by Agra with a production of 0.043 million tonnes spread over an area of 4300 hectares (Ministry of Horticulture and Food Processing). Uttar Pradesh 2022-2023).
Materials and Methods
This study used multistage sampling to select districts, blocks, villages and participants. A total of 110 farmers were selected from 7 villages of Sikandrabad block of Bulandshahr district through random sampling technique. Cultivators are divided into four different groups based on land ownership. The first category was farmers with less than 1 hectare of land, the second category was small farmers with 1 to 2 hectares of land, the third category was medium-sized farmers with 2 to 10 hectares of land and fourth category was large-sized farmers with more than 10 hectares land. Qualitative interview techniques and preliminary interviews used to collect detailed information from growers about various aspects of the carrot marketing. The marketing functionaries from Naveen Sabzi mandi Bulandshahr and Azadpur Sabzi mandi, New Delhi were organized and out of which 10% market functionaries were selected randomly from each primary and secondary market. The observe regarding market functionaries was taken into consideration to gather data regarding total marketing cost, marketing margin, and to identify different marketing channels used in carrot marketing. With the help of this data price spread, total marketing cost, marketing margin, marketing efficiency and producer share in consumer's rupee was calculated. (Table 1
| SI. No. | Market (Primary & Secondary) | Market Functionaries no. | Total |
|---|---|---|---|
| 1 | Naveen Sabzi mandi, Bulandshahr | Village Merchants | 5 |
| Dealer/agents | 12 | ||
| Retailers | 7 | ||
| 2 | Azadpur Sabzi mandi, New Delhi | Village Merchants | 7 |
| Dealer/agents | 11 | ||
| Retailers | 13 | ||
| 3 | Sunshine Vegetable Pvt. Ltd. | Pre-harvest Contractor | 1 |
| Total | 56 |
Table text extracted from the original PDF; superscript letters are shown inline. The original table image is below.
View original table image
Analytical tools
Techniques such as arithmetic mean, tabular analysis and formulae were used to calculate different marketing concept like marketing cost, marketing efficiency, marketing margin, price spread and producer share in consumer's rupee.
The marketing efficiency was calculated by using Acharya's approach given by Acharya in 2011. This is the most common method used to measure marketing efficiency.
MME =
Where, MME = modified measure of marketing efficiency. FP = Net price received by producer. MC = Total marketing cost. MM = Total marketing margin.
Results and Discussion
The marketing channels were identified in Bulandshahr district.
Channel I: Producer-consumer.
Channel II: Producer-Wholesaler-Retailer-Consumer.
Channel III: Producer-pre harvest contractor/Commission Agent-Wholesaler-Retailer-Consumer.
Distribution of carrot in different marketing channels by sample respondents:
Table 2 revealed that majority of growers sell their produce through channel III (81.9%) followed by channel II (10.9%) and channel I (7.2%). Growers do not have good marketing skills due to which they did not get better price for their produce that why they choose channel III to get better price. Marketing Cost incurred in channel I (1 Tonne) Table 3 revealed that total marketing cost incurred in channel 1 was Rupee 1870 per tonne. In total marketing cost major cost incurred in labour (42.78%) followed by spoilage (27.8%), packing material (24.06%) and transportation cost (5.35%). Marketing margin, total marketing cost, marketing Efficiency and producer's share in consumer rupee in different marketing channels (1 tonne) Table 6 revealed that marketing efficiency was highest in channel-I (3.81) followed by channel-III (0.81) and channel-II (0.74) because the net price received by growers in channel-I was highest and marketing cost is lower. There was a no marketing margin involved in channel-I because growers sold their produce directly to consumer. Total marketing cost in channel-I, channel-II and channel-III was 1870,4577,4348 per tonne respectively. Total marketing margin in channel-I, channel-II and channel-III was rupee 0, 1169 and 1152 per tonne respectively. Price spread was highest in channel-II (Rupee 5746 per tonne) followed by channel-III (Rupee 5500 per tonne) and channel-I (Rupee 1870 per tonne). The producer's share in consumer rupee was highest in channel-I (79.23%) because there were no intermediaries involved followed by channel-III (45%) and channel-II (42.90%). www.extensionjournal.com
| SI. No. | Particulars | Channel | — | — |
|---|---|---|---|---|
| I | II | III | ||
| 1 | Net price received by carrot grower | 7130 | 4290 | 4500 |
| 2 | Marketing cost incurred by carrot grower | 1870 | 3000 | 0 |
| 3 | Price paid by pre-harvest contractor/commission agent | - | - | 4500 |
| 4 | Marketing cost incurred by pre harvest contractor/commission agent | - | - | 2600 |
| 5 | Net margin of pre-harvest contractor/commission agent | - | - | 220 |
| 6 | Price paid by Wholesaler | - | 7290 | 7320 |
| 7 | Market cost Incurred by wholesaler | - | 733 | 739 |
| 8 | Net Margin of Wholesaler | - | 385 | 151 |
| 9 | Price paid by Retailer | - | 8408 | 8210 |
| 10 | Marketing cost incurred by retailer | - | 844 | 1009 |
| 11 | Net margin of retailer | - | 748 | 781 |
| 12 | Price paid by consumer | 9000 | 10000 | 10000 |
| 13 | Total marketing cost | 1870 | 4577 | 4348 |
| 14 | Total marketing margin | 0 | 1169 | 1152 |
| 15 | Price spread | 1870 | 5746 | 5500 |
| 16 | Marketing efficiency (Acharya's approach | 3.81 | 0.74 | 0.81 |
| 17 | Producer's share in consumer's rupee (%) | 79.23% | 42.90% | 45% |
Table text extracted from the original PDF; superscript letters are shown inline. The original table image is below.
View original table image
| — | Channel-I (8) | — | — |
|---|---|---|---|
| SI. No. | Particulars | Rs/tonnes | Percentage |
| I | Producer to Consumer | ||
| 1 | Labour | 800 | 42.78 |
| 2 | Packing material | 450 | 24.06 |
| 3 | Transportation | 100 | 5.35 |
| 4 | Spoilage | 520 | 27.8 |
| Total Marketing Cost | 1870 | 100 |
Table text extracted from the original PDF; superscript letters are shown inline. The original table image is below.
View original table image
| SI. No. | Channels | Number of intermediaries involved | Number of farmers sold through this channel | Percentage |
|---|---|---|---|---|
| 1 | Channel I | Producer Consumer | 8 | 7.2 |
| 2 | Channel II | Producer Wholesaler Retailer Consumer | 12 | 10.9 |
| 3 | Channel III | Producer Pre contractor/commission agent WholesalerRetailer Consumer | 90 | 81.9 |
| Total | 110 | 100 |
Table text extracted from the original PDF; superscript letters are shown inline. The original table image is below.
View original table image
Marketing cost incurred in channel III (1 tonne)
Marketing cost incurred in channel III (1 tonne)
Conclusion
From the above, it has been concluded that most of the growers sell their produce by using channel-III (81.9). total marketing cost incurred was highest in channel-II (Rupee 4577 per tonne) because more intermediaries involved in channel-II. Marketing margin in channel-I was zero because farmers sold their produce directly to the consumers and in channel-II and channel-III marketing margin was rupee 1169, 1152 per tonne respectively. Price spread was highest for channel-II. In channel-I growers gained more profit because they sold their produce directly to consumers so producer's share in consumer rupee is also higher in channel-I as compared to channel-II and channel-III.
Acknowledgement
AcknowledgementI extend my heartfelt thanks to my advisor Dr. Mukesh Maurya for his continuous support and expert guidance throughout the research process.
Figures and tables from the paper
| — | Channel - II (12) | — | — |
|---|---|---|---|
| SI. No. | Particulars | Rs/tonnes | Percentage |
| I | Producer/Sellers | ||
| 1 | Labour Charges | 800 | 17.47 |
| 2 | Packing Charges | 320 | 7 |
| 3 | Transportation | 500 | 10.92 |
| 4 | Commission Charge | 1070 | 23.36 |
| 5 | Loading Unloading | 200 | 4.36 |
| 6 | Other expenses | 110 | 2.4 |
| Sub total | 3000 | 65.53 | |
| II | Wholesaler | ||
| 1 | Shop rent | 10 | 0.22 |
| 2 | License Fee | 8 | 0.17 |
| 3 | Labour Salary | 50 | 1.09 |
| 4 | Transportation | 120 | 2.62 |
| 5 | Loading & unloading | 100 | 2.18 |
| 6 | Market Charge | 160 | 3.6 |
| 7 | Spoilage | 175 | 3.82 |
| 8 | Other Expenses | 110 | 2.4 |
| Sub total | 733 | 16.1 | |
| III | Retailer | ||
| 1 | Shop rent | 10 | 0.21 |
| 2 | License Fee | 9 | 0.28 |
| 3 | Labour Salary | 45 | 0.99 |
| 4 | Transportation Cost | 90 | 1.97 |
| 5 | Loading & unloading | 100 | 2.27 |
| 6 | Spoilage | 350 | 7.64 |
| 7 | Other expenses | 240 | 5.2 |
| Sub total | 844 | 18.55 | |
| Total Marketing Cost | 4577 | 100 |
Table text extracted from the original PDF; superscript letters are shown inline. The original table image is below.
View original table image
| — | Channel - III (90) | — | — |
|---|---|---|---|
| SI. No. | Particulars | Rs/tonnes | Percentage |
| I | Producer/Seller | ||
| Sub total | 0 | 0 | |
| II | Pre-Harvest Contractor/Commission agent | ||
| 1 | Transportation | 500 | 11.51 |
| 2 | Packing material | 320 | 7.35 |
| 3 | Spoilage | 10 | 0.22 |
| 4 | Loading & unloading | 50 | 1.14 |
| 5 | Other expenses | 20 | 0.45 |
| 6 | Commission charge | 950 | 21.84 |
| 7 | Labour Charge | 750 | 17.3 |
| Sub total | 2600 | 59.81 | |
| III | Wholesaler | ||
| 1 | Shop rent | 10 | 0.22 |
| 2 | License Fee | 9 | 0.2 |
| 3 | Labour salary | 50 | 1.14 |
| 4 | Market charges | 205 | 4.71 |
| 5 | Spoilage | 115 | 2.64 |
| 6 | Other expenses | 120 | 2.76 |
| 7 | Loading & unloading | 80 | 1.83 |
| 8 | Transportation | 150 | 3.45 |
| Sub total | 739 | 16.99 | |
| IV | Retailer | ||
| 1 | Shop rent | 10 | 0.23 |
| 2 | License Fee | 9 | 0.2 |
| 3 | Labour salary | 45 | 1.04 |
| 4 | Transportation | 95 | 2.19 |
| 5 | Loading & unloading | 300 | 6.9 |
| 6 | Spoilage | 340 | 7.82 |
| 7 | Other expenses | 210 | 4.82 |
| Sub total | 1009 | 23.2 | |
| Total Marketing cost | 4348 | 100 |
Table text extracted from the original PDF; superscript letters are shown inline. The original table image is below.
View original table image
References
7 in the original paper- Agricultural statistics at a glance. Economics and statistics division, department of Agriculture and farmer welfare, ministry of agriculture & farmer's welfare; c2021-2022. Available at: https://desagri.gov.in/
- Department of horticulture and food processing, Uttar Pradesh; c2022-2023. Available at: https://uphorticulture.gov.in/
- Pandey N, et al. Production Economics and determinants of carrot (Daucus carota L.) production in Chitwan, Nepal. International journal of social science and management; c2020. ISSN No. 2091-2986
- Amjad MN. Growth and seed yield of carrot as influenced by different regimes of nitrogen and potassium. Journal of Research Science. 2005;16(2):7378.
- Silva Dias JC. Nutritional and Health Benefits of Carrots and their Seed extracts. Food and Nutrition Sciences. 2014;5:2147-2156.
- van Het Hof KH. Dietary factors that affect the bio availabillity of Carotenoids. The Journal of nutrition. 2000;130:503-506
- Nicolle C, Simon G, Rock E, Amouroux P, Remesy C. Genetic variability influences carotenoid, vitamin, phenolic and mineral content in white, yellow, purple, orange and dark-orange carrot cultivars. Journal of the American Society for Horticultural Science. 2004;129:(4):523-529. DOI: https://doi.org/10.21273/JASHS.129.4.0523.
Cited by 3
From OpenAlex, OpenCitations and reference lists read by Scinovex
- Cost economic analysis of sugarcane cultivation in Kanpur Nagar district of Uttar Pradesh
Kamini Sachan, Ashish Srivastava, Aditya Pratap Singh · International Journal of Agriculture Extension and Social Development · 2026
The present study was conducted to examine the economics of sugarcane cultivation in Kanpur Nagar district of Uttar Pradesh during the agricultural year 2025–2026. A purposive-cum-multistage random sampling technique was employed for the selection of respondents, and a total of 100 sugarcane growers were selected from Patrai block. The selected farmers were categorized into marginal, small, and medium farm groups. Primary data were collected through personal interviews with the help of a pre-structured schedule, while secondary data were obtained from official records, journals, and published
- Economic analysis of sugarcane production in Sitapur district of Uttar Pradesh
LK Srivastava, Mukesh Kumar Maurya · International Journal of Agriculture Extension and Social Development · 2025
Sugarcane cultivation constituted a vital part of the agricultural economy in Uttar Pradesh, contributing significantly to rural livelihoods and farmer incomes.The study titled " Economic Analysis of Sugarcane Production in Sitapur District of Uttar Pradesh" examined the economic dimensions of sugarcane farming in Mahmudabad block.For the study, five percent of sugarcane cultivating potential villages were randomly selected from the selected block, and ten percent of the total respondent population were taken as sample randomly.The analysis revealed that marginal farms incurred the highest cos
- Effect of Adding Natural Extracts on pH Value, Yield, and Organoleptic Properties of Honey Candy ↗
Anif Mukaromah Wati, Premy Puspitawati Rahayu, Dimas Irawan Prasetyo, Novie Ayu Kuncoro Esti · Journal of Agriprecision & Social Impact · 2024
This study investigates the effects of adding various natural extracts: carrot, red ginger, mango, and tamarind on the physical and sensory properties of honey candy. Specifically, the research examines the pH value, yield, and organoleptic qualities (taste, aroma, texture, and color) of honey candy enhanced with these extracts. A laboratory experiment with a completely randomized design (CRD) was conducted, and…
❝ 0PDF