
Research article · 2024 · Full text
International Journal of Research in AgronomyEffect of drip irrigation and fertigation on quality of wheat (Triticum aestivum L.)
Volume 7(5) · Pages 174–176 · DOI: 10.33545/2618060x.2024.v7.i5c.668 ↗
Research areasIrrigation Practices and Water ManagementCrop Yield and Soil FertilityAgricultural Science and Fertilization
Abstract
Author-writtenField trials were conducted in the winter months of 2017-18 and 2018-19 to examine the effect of irrigation water and fertilization levels on wheat (Triticum aestivum L.) yield and quality. The trial was carried out with four changes in SPD, four irrigation methods in the main plot and four fertilization stages in the second plot, for a total 16 combinations. Research has shown that scheduling 1.0 PEF drip irrigation can increase crop yields better than 0.6 PEF drip irrigation and 100% RDF drip irrigation fertilization level, resulting in more winter wheat, hay and higher protein yields. It shows that it improves wheat yield and quality. With fertilization, the RDF of rice is more than 50%.
Summary
Source-checkedPlain-language reading of the full paper, prepared with AI and checked against the text. Each point links to the authors' own words.
Why it matters
- Effective water planning for crops involves determining the timing and quantity of water based on methods like climatology and soil moisture depletion. View evidence ↗
- Water-soluble fertilizers are used in agriculture because they allow for more precise control over the nutrient composition provided to plants. View evidence ↗
- Pan Evaporation Fraction (PEF) is a specific irrigation scheduling technology that uses daily evaporation data to plan water application. View evidence ↗
The question
- The study aimed to examine how different levels of irrigation water and fertilization affect the yield and quality of wheat. View evidence ↗
What they did
- The experiment took place at the Teaching Farm of Junagadh Agricultural University during the winter seasons of 2017-18 and 2018-19. View evidence ↗
- The researchers used a split-plot design with 16 treatment combinations, testing four irrigation schedules (0.6, 0.8, 1.0 PEF, and 0.8 IW/CPE) and four fertilization rates (50%, 75%, 100% RDF via drip, and 100% RDF via soil). View evidence ↗
- Wheat variety GW-496 was planted at a rate of 120 kg/ha with a row depth of 5 cm and spacing of 22.5 cm. View evidence ↗
What they found
- Drip irrigation at 1.0 PEF (I3) resulted in the highest pooled grain yield (4369 Kg/ha) and straw yield (4892 Kg/ha) compared to other irrigation schedules. View evidence ↗
- Applying 100% of the Recommended Dose of Fertilizer (RDF) via drip irrigation (F3) significantly increased pooled grain yield to 4533 Kg/ha and straw yield to 5096 Kg/ha. View evidence ↗
- The highest pooled protein yield (501.1 Kg/ha) was achieved using 100% RDF via drip irrigation (F3). View evidence ↗
- A significant interaction was found between irrigation and fertilization, with the combination of 1.0 PEF drip irrigation and 100% RDF (I3F3) resulting in increased yields. View evidence ↗
What it means
- The authors recommend a combination of initial surface irrigation (0.8 IW/CPE) followed by drip irrigation at 1.0 PEF and 100% RDF (120-60-60 kg NPK ha-1) to maximize grain, straw, and protein yields. View evidence ↗
Visual summary
3 visualsIllustrations explain the paper; charts are replotted from the paper's own table values.
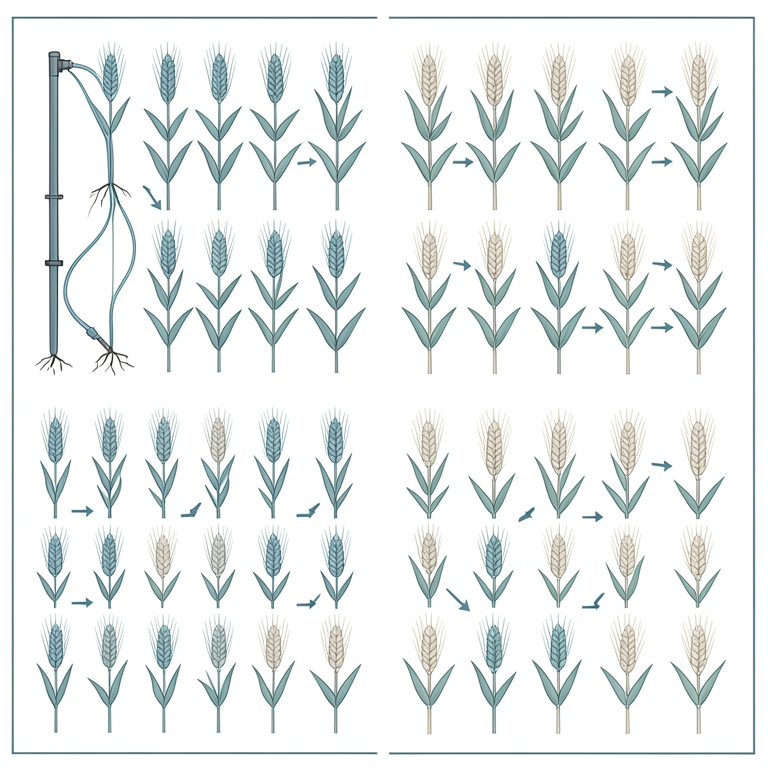
Experimental Treatment Matrix
AI-generated conceptual illustration (wheat plants (Triticum aestivum L.)). It explains the idea and does not show study data.
View source evidence ↗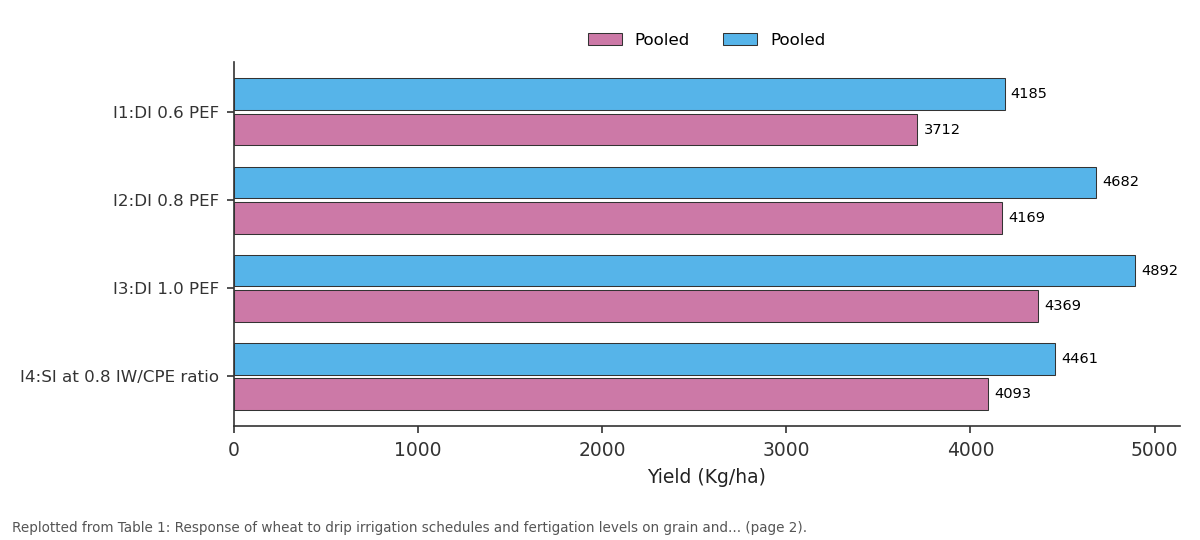
Pooled and Pooled: I1:DI 0.6 PEF vs I2:DI 0.8 PEF vs I3:DI 1.0 PEF vs I4:SI at 0.8 IW/CPE...
Replotted from Table 1 (page 2) of the original paper. Every bar is the paper's own table value.
View source evidence ↗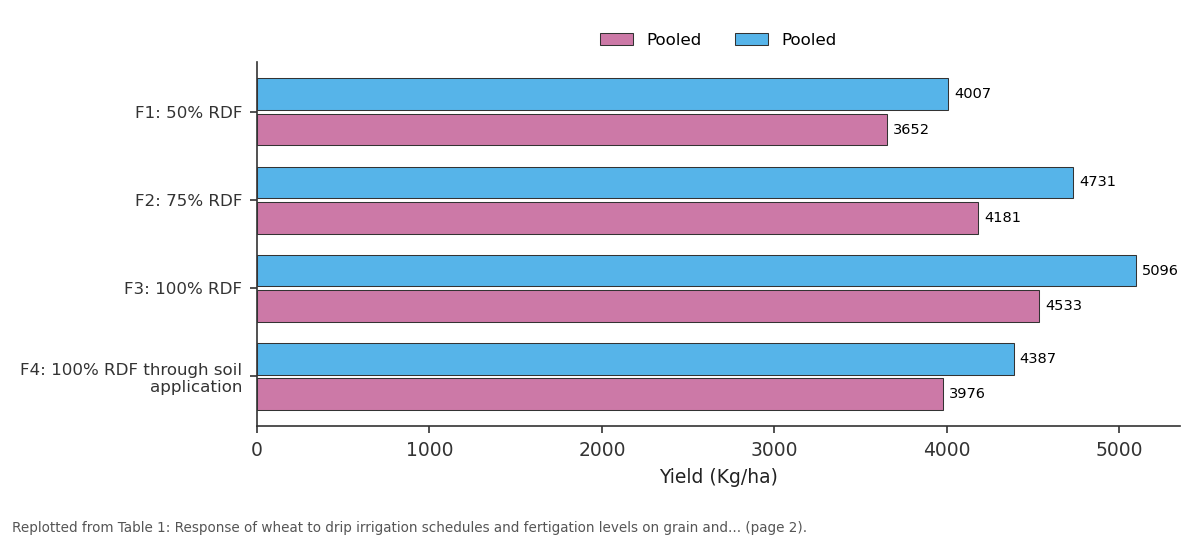
Pooled and Pooled: F1: 50% RDF vs F2: 75% RDF vs F3: 100% RDF vs F4: 100% RDF through...
Replotted from Table 1 (page 2) of the original paper. Every bar is the paper's own table value.
View source evidence ↗Figures & tables
From the original paper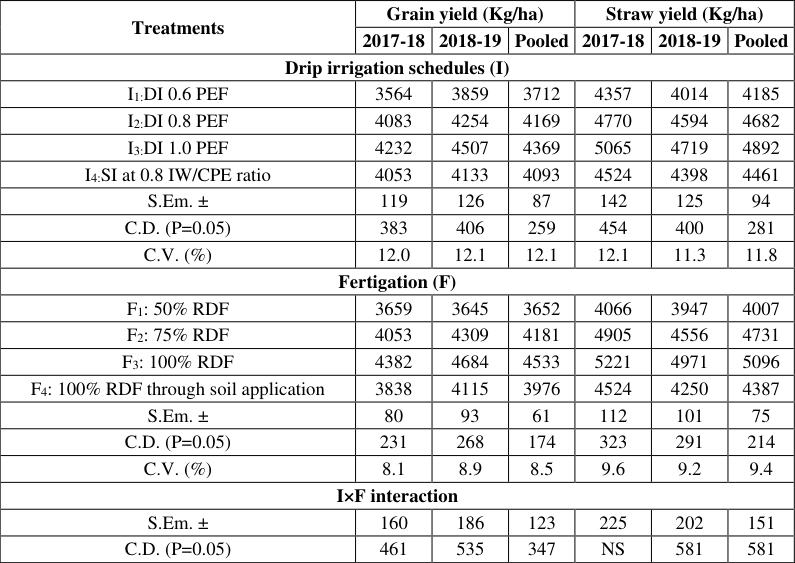 Table 1
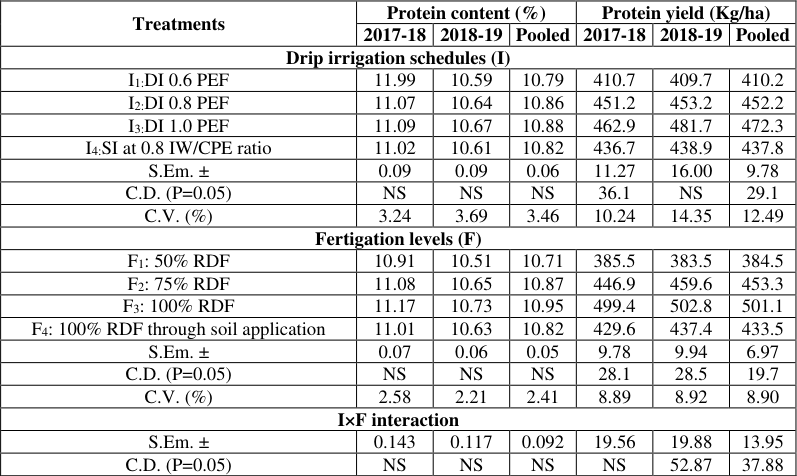 Table 2
Introduction
Water planning involves deciding when to water. How do I water? How much water should be used? After the end of the monsoon, the sowing season begins, such as irrigated crops or rain crops from well-moistened soil. If we are thinking of irrigating a crop, we must know that the crop needs irrigation. Irrigation can be planned using a variety of methods, including the use of climatology, soil moisture depletion, and irrigation during key stages of growth. Pan evaporation values are measured using climatological methods. Since evapotranspiration is closely related to plant evaporation, irrigation is planned according to the demand of the crop. Likewise, PEF (Pan Evaporation Fraction) irrigation scheduling technology plans irrigation based on daily evaporation data. The water-soluble fertilizer industry has expanded in recent years, and this trend should continue. Fertilizers that dissolve easily in water and are applied to the soil or filtered from the soil are called water-soluble fertilizers. Using water-soluble fertilizers makes it easier to control the nutrient composition of your plants. The water-soluble fertilizer market is expected to grow at a CAGR of 5.3% from 2013 to 2019, reaching 9251 businesses, increasing availability and irrigation technology. The biggest problem is 2000 tons (Anonymous, 2019) [2] . The global water-soluble fertilizer market is driven by factors such as ease of application, development of new technologies, new products, and prices of water-soluble fertilizers are generally higher than soil-applied fertilizers.
Materials and Methods
The experiment was conducted at this facility. During the winter months of 2017-18 and 2018-19, C-7 was located at Teaching Farm, Department of Agronomy, Junagadh Agricultural University, 382001. The soil in the experimental area was clay, and the elements were moderate organic carbon, medium nitrogen content, medium phosphorus content and medium potassium content. In four split-plot design (SPD) experiments, 16 mixed treatments were distributed, including four irritations in the main plot (dog irrigation at 0.6, 0.8, 1.0 PEF, and 0.8 IW/CPE) and four seed irrigations. and fertilization rates (50%, 75%, 100% RDF in drip fertilization and 100% RDF from soil in subplots. Wheat (GW-496) was planted at the rate of 120 kg per hectare and at a row depth of 5 cm. spacing is kept at 22.5 cm.
Irrigation and fertilization were carried out for trial purposes. Cultural activities and plant protection studies are carried out when necessary.
Results and Discussion
Results and Discussion
Effect of drip irrigation schedules
Wheat crop, grain, straw and protein yields were higher in treatment I 3 (drip irrigation scheme at 1.0 PEF) but still at the same data as I 2 ; i.e. drip irrigated crops at 0.8 PEF during 2017-18 and 2018-19. The results and in the same column as the data I 4 (0.8 IW/CPE for surface irrigation) analyzed during 2017-18 and 2018-19, where crop and hay production are at the same level according to I 2 statistics (0.8 PEF for drip irrigation) respectively. In 2017-18, 2018-19 and combined results, it is also at I 4 (0.8 IW/CPE for flow) in 2018-19. Analysis of relevant data clearly shows that different drip irrigation methods had no significant impact on protein content in 2017-18 and 2018-19 and mixed results. Planting using drip irrigation at 1.0 PEF (I 3 ) harvested more protein in 2017-18 with mixed results compared to drip irrigation at 0.8 PEF (I 2 ) and I 4 (0.8 IW/CPE). Abdelraouf et al. (2013) [1] reported that moisture stress inhibits the uptake of content by the growing grain and reduces photo assimilations. According to Chouhan et al. (2015) [5] , drip systems work well at retaining moisture in the root zone, providing continuous access throughout the growing season and reducing water stress on crops. In accordance with Bhowmik et al. (2018) [4] , increased irrigation to keep the root zone moist can encourage the release of more nutrients from the soil. They also reported that increased crop yield may be associated with higher water use, ensuring consistent and adequate water supply, as well as better rhizosphere conductance for nutrient uptake.
Effect of fertigation levels
When crops were fertilized with 100% RDF via drip irrigation (F 3 ), grain, straw and protein yields increased significantly, while in 2017-18, straw and protein yields reached F 2 (75% RDF fertilized with drip irrigation). To increase the effect of different levels of fertilization on protein content was found to be insignificant in both years with mixed results, while fertilization with 100% RDF drip irrigation (F 3 ) application was recorded in 2017-18, 2018-19 and the main collection period, maximum protein yields were based on the results. According to Alam et al. (2003) [3] , fertigation's divided administration of N at the first and second irrigation times was preferable to top dressing. According to Abdelraouf et al. (2013) [1] , increased plant height and spikelet numbers m -2 led to higher nitrogen usage efficiency, which in turn increased yields. According to Jabran et al. (2011) [6] fertigation of nutrients like nitrogen, phosphorus, and potassium at grain growth stage assisted to create more fertile tillers and spikelets per spike and less unfertile tillers. These findings coincide with those made public by Kassem and Suker (2009) [8] .
Interaction effect
The interaction between drip irrigation scheme and fertilization level (I x F) for paddy crops was found to be significant in 2017-18, 2018-19 and summary. 1.0 PEF drip irrigation and 100% RDF crop fertilization (I 3 F 3 ) resulted in increased yield and was analyzed in comparison with I 3 F 2 application in 2017-18 and 2018-19. According to the data collected, fertilizing crops with 100% RDF through drip irrigation and drip irrigation (I 3 F 3 ) at 1.0 PEF increased straw and protein yield in 2018-19. It also includes a comparison of combined I 3 F 2 treatment in 2018-19, and in the cumulative results, statistics for combination I 3 F 2 are compared, excluding protein results in 2018-19. According to Abdelraouf et al. (2013) [1] , there was a significant interaction between fertigation treatment reduction (from 100% to 50% RDF) and irrigation demand reduction (from 100% to 50%) on grain, straw, and biological yields. These findings coincide with those made public by Karangiya et al. (2019) [7] .
Conclusion
According to the two-year test results, to obtain more yield of grain, straw and protein, crops should be regularly watered twice with a water depth of 50 mm, and the first irrigation should be done immediately after planting at a rate of 0.8 IW/CPE. A second joint watering three to four days after the first watering. The remaining water should be drip irrigation at a rate of 1.0 PEF per day and the crops should receive 100% RDF (120-60-60 kg NPK ha -1 ) where 50% RDF is used as fertilizer and 50% RDF fraction. (60-30-30 kg NPK ha -1 ) was divided into 6 equal parts with 10 days intervals and irrigated and fertilized starting from 10 DAS.
Figures and tables from the paper
| Treatments | Grain yield (Kg/ha) | — | — | Straw yield (Kg/ha) | — | — |
|---|---|---|---|---|---|---|
| 2017-18 | 2018-19 | Pooled | 2017-18 | 2018-19 | Pooled | |
| Drip irrigation schedules (I) | ||||||
| I1:DI 0.6 PEF | 3564 | 3859 | 3712 | 4357 | 4014 | 4185 |
| I2:DI 0.8 PEF | 4083 | 4254 | 4169 | 4770 | 4594 | 4682 |
| I3:DI 1.0 PEF | 4232 | 4507 | 4369 | 5065 | 4719 | 4892 |
| I4:SI at 0.8 IW/CPE ratio | 4053 | 4133 | 4093 | 4524 | 4398 | 4461 |
| S.Em. ± | 119 | 126 | 87 | 142 | 125 | 94 |
| C.D. (P=0.05) | 383 | 406 | 259 | 454 | 400 | 281 |
| C.V. (%) | 12.0 | 12.1 | 12.1 | 12.1 | 11.3 | 11.8 |
| Fertigation (F) | ||||||
| F1: 50% RDF | 3659 | 3645 | 3652 | 4066 | 3947 | 4007 |
| F2: 75% RDF | 4053 | 4309 | 4181 | 4905 | 4556 | 4731 |
| F3: 100% RDF | 4382 | 4684 | 4533 | 5221 | 4971 | 5096 |
| F4: 100% RDF through soil application | 3838 | 4115 | 3976 | 4524 | 4250 | 4387 |
| S.Em. ± | 80 | 93 | 61 | 112 | 101 | 75 |
| C.D. (P=0.05) | 231 | 268 | 174 | 323 | 291 | 214 |
| C.V. (%) | 8.1 | 8.9 | 8.5 | 9.6 | 9.2 | 9.4 |
| I×F interaction | ||||||
| S.Em. ± | 160 | 186 | 123 | 225 | 202 | 151 |
| C.D. (P=0.05) | 461 | 535 | 347 | NS | 581 | 581 |
Table text extracted from the original PDF; superscript letters are shown inline. The original table image is below.
View original table image
| Treatments | Protein content (%) | — | — | Protein yield (Kg/ha) | — | — |
|---|---|---|---|---|---|---|
| 2017-18 | 2018-19 | Pooled | 2017-18 | 2018-19 | Pooled | |
| Drip irrigation schedules (I) | ||||||
| I1:DI 0.6 PEF | 11.99 | 10.59 | 10.79 | 410.7 | 409.7 | 410.2 |
| I2:DI 0.8 PEF | 11.07 | 10.64 | 10.86 | 451.2 | 453.2 | 452.2 |
| I3:DI 1.0 PEF | 11.09 | 10.67 | 10.88 | 462.9 | 481.7 | 472.3 |
| I4:SI at 0.8 IW/CPE ratio | 11.02 | 10.61 | 10.82 | 436.7 | 438.9 | 437.8 |
| S.Em. ± | 0.09 | 0.09 | 0.06 | 11.27 | 16.00 | 9.78 |
| C.D. (P=0.05) | NS | NS | NS | 36.1 | NS | 29.1 |
| C.V. (%) | 3.24 | 3.69 | 3.46 | 10.24 | 14.35 | 12.49 |
| Fertigation levels (F) | ||||||
| F1: 50% RDF | 10.91 | 10.51 | 10.71 | 385.5 | 383.5 | 384.5 |
| F2: 75% RDF | 11.08 | 10.65 | 10.87 | 446.9 | 459.6 | 453.3 |
| F3: 100% RDF | 11.17 | 10.73 | 10.95 | 499.4 | 502.8 | 501.1 |
| F4: 100% RDF through soil application | 11.01 | 10.63 | 10.82 | 429.6 | 437.4 | 433.5 |
| S.Em. ± | 0.07 | 0.06 | 0.05 | 9.78 | 9.94 | 6.97 |
| C.D. (P=0.05) | NS | NS | NS | 28.1 | 28.5 | 19.7 |
| C.V. (%) | 2.58 | 2.21 | 2.41 | 8.89 | 8.92 | 8.90 |
| I×F interaction | ||||||
| S.Em. ± | 0.143 | 0.117 | 0.092 | 19.56 | 19.88 | 13.95 |
| C.D. (P=0.05) | NS | NS | NS | NS | 52.87 | 37.88 |
Table text extracted from the original PDF; superscript letters are shown inline. The original table image is below.
View original table image
References
8 in the original paper- Abdelraouf RE, El Habbasha SF, Taha MH, Refaie KM. Effect of irrigation water requirements and fertigation levels on growth, yield and water use efficiency in wheat. MiddleEast J Sci Res. 2013;16(4):441-450.
- Anonymous. Water soluble fertilizers market by types (nitrogenous, phosphatic, potassic, micronutrients), applications (fertigation, foliar application), crop types (field, horticultural, turf & ornamentals) & geography trends & forecasts to 2018. Report, Custom Market Research Service; c2019. p. 116-117.
- Alam SM, Azam SS, Akhtar M. Varietal differences in wheat yield and phosphorus use efficiency as influenced by method of phosphorus application. Songklanakarin J Sci Technol. 2003;25(2):175-181.
- Bhowmik T, Bhardwaj AK, Pandyaraj T, Roy A. Productivity, water use efficiency and profitability of drip irrigated wheat in Indo-Gangetic plains of Uttarakhand, India. Int J Curr Microbiol Appl Sci. 2018;7(2):3185-3191.
- Chouhan S, Awasthi M, Nema R. Studies on water productivity and yield responses of wheat based on drip irrigation systems in clay loam soil. Indian J Sci Technol. 2015;8(7):650-654.
- Jabran K, Cheema ZA, Farooq M, Khan MB. Fertigation and foliar application of fertilizer alone and in combination with canola extracts enhances yield in wheat. Crop Environ. 2011;2(1):42-45.
- Karangiya BA, Mashru HH, Vadher HM. Response of wheat (Triticum aestivum L.) under drip fertigation system. Int J Curr Microbiol Appl Sci. 2019;8(06):2519-2526.
- Kassem MA, Suker AL. Effect of fertigation methods on productivity and nitrogen use efficiency for wheat and barley crops. Misr J Agric Eng. 2009;2(26):866-885.