
Research article · 2024 · Full text
International Journal of Agriculture Extension and Social DevelopmentSocio-economic profile of the Kisan credit card scheme beneficiary and non-beneficiary farmers of Marathwada Region
Volume 7(5) · Pages 06–11 · DOI: 10.33545/26180723.2024.v7.i5a.592 ↗
Research areasAgricultural Economics and PracticesIndian Economic and Social Development
Abstract
Author-writtenThe present study “Socio-economic profile of the Kisan credit card scheme beneficiary and non-beneficiary farmers of Marathwada region” was conducted in Latur and Osmanabad district of the Marathwada region. Ex-post-facto research design was adopted in this study. The study had shown the results as under, 59.17 percent of the KCC scheme beneficiaries and 60.00 percent of the non-beneficiaries were from middle age group, 29.17 percent of the beneficiaries educated up to middle level and graduation and 25.00 percent of the non-beneficiaries educated up to middle level, 71.66 percent of the beneficiaries and 74.17 percent of the non-beneficiaries belonged to medium size of family, 70.00 percent of the beneficiaries and 66.67 percent of the non-beneficiaries belonged to nuclear family, 66.67 percent of the beneficiaries belonged to medium annual income and 47.50 percent of the non-beneficiaries belonged to low annual income, 91.67 percent of the beneficiaries and 92.50 percent of the non-beneficiaries had cultivation as their occupation, 41.67 percent of the beneficiaries belonged to small land holding category and 45.83 percent of the non-beneficiaries belonged to marginal land holding category, 49.17 percent of the beneficiaries had medium social participation and 45.83 percent of the non-beneficiaries had low social participation, 64.17 percent of the beneficiaries and 49.17 percent of the non-beneficiaries had medium extension contact, 60.00 percent of the beneficiaries and 47.50 percent of the non-beneficiaries had medium sources of information, 53.33 percent of the beneficiaries and 42.50 percent of the non-beneficiaries had medium economic motivation, 55.00 percent of the beneficiaries and 45.00 percent of the non-beneficiaries had medium risk orientation, 47.50 percent of the beneficiaries and 41.67 percent of the non-beneficiaries had medium level of overall knowledge.
Summary
Source-checkedPlain-language reading of the full paper, prepared with AI and checked against the text. Each point links to the authors' own words.
Why it matters
- Agricultural credit is essential for increasing productivity, developing the farm sector, and enabling the adoption of new technologies. View evidence ↗
- The Kisan Credit Card (KCC) scheme was launched in August 1998 to simplify the delivery of short-term formal credit to farmers based on their land holdings and cropping patterns. View evidence ↗
- In Maharashtra, the KCC scheme provides low-interest loans to help mitigate farmer suicides caused by a lack of available finance. View evidence ↗
The question
- The study aims to determine and compare the socio-economic profiles of farmers who benefit from the KCC scheme versus those who do not. View evidence ↗
What they did
- The research was conducted in the Latur and Osmanabad districts of the Marathwada region. View evidence ↗
- The study sample consisted of 240 respondents, split equally between 120 KCC beneficiaries and 120 non-beneficiaries. View evidence ↗
- The researchers employed an ex-post-facto research design for the study. View evidence ↗
- Data analysis was performed using mean, standard deviation, frequency, percentage, and the 'Z' test to determine significant differences between groups. View evidence ↗
What they found
- The majority of both groups were in the middle age group (59.17% of beneficiaries and 60.00% of non-beneficiaries), with no significant difference between them. View evidence ↗
- Beneficiaries had higher education levels, with 29.17% reaching middle level and 29.17% graduating, compared to 25.00% of non-beneficiaries reaching middle level and only 9.17% graduating. View evidence ↗
- Beneficiaries generally had higher incomes, with 66.67% in the medium income group, whereas 47.50% of non-beneficiaries were in the low income group. View evidence ↗
- Beneficiaries had higher extension contact, with 64.17% reporting medium contact compared to 49.17% of non-beneficiaries. View evidence ↗
- Beneficiaries had better access to information, with 60.00% having medium sources of information compared to 47.50% of non-beneficiaries. View evidence ↗
- Beneficiaries possessed significantly higher overall knowledge of the KCC scheme, with 38.33% having high knowledge compared to 17.50% of non-beneficiaries. View evidence ↗
What it means
- The authors conclude that the KCC scheme is beneficial for enhancing farmer livelihoods, as evidenced by the significant socio-economic differences between beneficiaries and non-beneficiaries. View evidence ↗
- The authors recommend that policy makers and banking personnel promote the KCC scheme to maximize crop production and returns. View evidence ↗
Visual summary
1 visualsIllustrations explain the paper; charts are replotted from the paper's own table values.
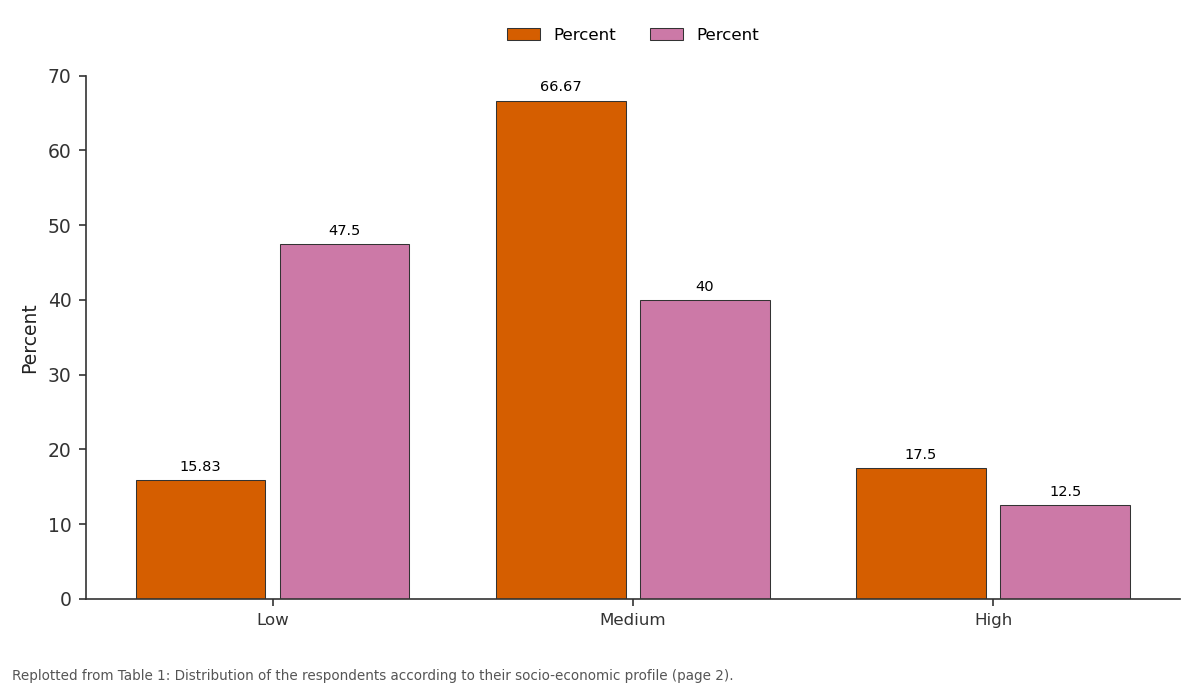
Percent and Percent: Low vs Medium vs High
Replotted from Table 1 (page 2) of the original paper. Every bar is the paper's own table value.
View source evidence ↗Figures & tables
From the original paper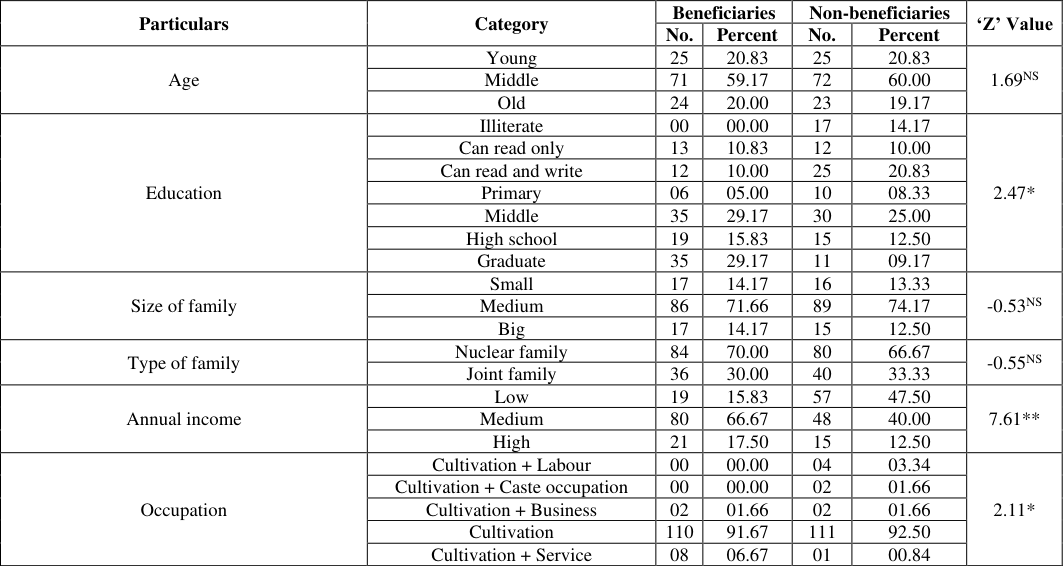 Table 1
Introduction
Agriculture is a key sector of Indian economy as its contribution to gross domestic product and employment. The majority of our country's population depends upon agriculture. Indian agriculture and allied sector broadly cover four activities, viz., crop, livestock, forestry and fisheries. Hence, there is need of financial support to rural people. Credit is most crucial in agriculture to increase agriculture productivity. Agricultural credit plays a vital role in farm sector development and facilitates adoption of new technologies. It helps in maintaining agricultural production by allowing producers to meet their comprehensive credit requirement during the entire cycle of crop production and at the same time provides funds for investment purposes. However, any amount of credit even at the most reasonable rates cannot guarantee higher productivity or adequate income among the farmers, as the success depends upon many other supporting factors including the availability of agricultural inputs, services and remunerative markets for the products. Kisan Credit Card (KCC) scheme was first proposed by the Finance Minister Yashwant Sinha in the financial year 1998-99 Budget, with the objective of providing short term credit to farmers to meet their immediate credit needs during the crop season. Consequent to this a Model KCC scheme was prepared by the NABARD on the recommendations of R. V. Gupta committee to provide term loans for agricultural needs. According to need of credit for agriculture and allied sector development, KCC scheme was launched in August 1998 by GOI, RBI and NABARD to simplify credit delivery mechanism with the aim of providing short term formal credit to farmers on the basis of their land holding, cropping pattern and scale of finance, so that the farmers may use them for purchase of agriculture inputs such as seeds, fertilizers and pesticides etc. and also drawn cash for their production needs. The government of India gives KCC loans up to Rs. 1.6 lakh without guarantee to small farmers having KCC. Now a days KCC not limited to farming only. The scheme was further extended for the investment credit requirement viz. allied activities and nonfarm activities in 2004 and by 2019 for fisheries and animal husbandry giving financial support up to Rs. 2 lakh to farmers. In the present situation low production and productivity of agriculture is more serious problem due to poor socioeconomic endowed of the farmer? Without adequate credit www.extensionjournal.com farmers are unable to buy inputs for high production. Production will be increased if timely provision of credit. In this situation KCC plays an important role. KCC linked with health and crop insurance. KCC become one of the innovative credit tools to enhance the flow of institutional agricultural credit in the state. In Maharashtra lack of availability finance due to this farmer's suicide situation arises. In this situation KCC loan facility help to farmers by providing loan amount in low interest rate but so many farmers are unaware about KCC scheme and those farmers who are using KCC face many problems. Hence present study has been carried out to know about the socioeconomic profile of the beneficiary farmers and nonbeneficiary farmers of KCC Scheme. The present study will be useful for farmers, administrators, policy makers, researchers and banking or financial institutions for making future strategies and also explore the weakness of the ongoing implementations of the KCC.
Materials and Methods
The present study was conducted in Latur and Osmanabad district of the Marathwada region which was selected purposively on the basis of maximum number of Kisan Credit Card Scheme beneficiary farmers. From these two districts six talukas i.e. three talukas from each district were selected purposively on the basis of maximum number of Kisan Credit Card Scheme beneficiary farmers. From these six talukas total 24 villages i.e. four villages from each taluka were selected purposively on the basis of list obtained from bank and co-operative society having KCC Scheme beneficiary farmers. From each selected village 5 KCC Scheme beneficiary farmers and 5 non-beneficiary farmers were selected purposively. Thus total 240 respondents were selected out of that 120 KCC Scheme beneficiary farmers and 120 non-beneficiary farmers. Ex-post-facto research design was adopted in this study. The data were collected with the help of pretested interview schedule from the respondents as per their convenience at their home or farm. The statistical methods and tests such as mean, standard deviation, frequency and percentage and 'Z' test were used for the analysis of data. 'Z' test was used for knowing significance of difference between mean of beneficiary and non-beneficiary of KCC scheme.
Results and Discussion
The study of socio-economic profile of KCC Scheme beneficiary farmers and non-beneficiary farmers were made with reference to age, education, size of family, type of family, annual income, occupation, land holding, social participation, extension contact, sources of information, economic motivation, risk orientation and overall knowledge about KCC Scheme. The result of data collected from the beneficiaries and non-beneficiaries with respect to above listed variables have been tabulated, analyzed, discussed and presented below, [4] and Bhosale (2019) [2] .
Education
It was revealed from Table 1 that, 29.17 percent of the beneficiaries educated up to middle level and graduation, followed by 15.83 percent of the beneficiaries educated up to high school level, 10.83 percent of the beneficiaries can read only, 10.00 percent of the beneficiaries can read and write, 05.00 percent of the beneficiaries educated up to primary level and no any beneficiary illiterate. While one fourth (i.e. 25.00%) of the non-beneficiaries educated up to middle level, 20.83 percent of the non-beneficiaries can read and write, 14.17 percent of the non-beneficiaries were illiterate, 12.50 percent of the non-beneficiaries educated up to high school, 10.00 percent of the non-beneficiaries can read only, 09.17 percent of the non-beneficiaries educated up to graduate level and 08.33 percent of the nonbeneficiaries educated up to primary level. It was observed from above table that, maximum number of beneficiaries educated up to middle level i.e. 5 th to 10 th standard and graduate. While non-beneficiaries educated up to middle level i.e. 5 th to 10 th standard. Education is very important key to success and plays important role in motivating individuals to accept the new schemes. It helps to get information and knowledge about new schemes. Majority of the non-beneficiaries was low level of education due to their family income is low as compared to beneficiaries.
| Particulars | Category | Beneficiaries | — | Non-beneficiaries | — | ‘Z’ Value |
|---|---|---|---|---|---|---|
| No. | Percent | No. | Percent | |||
| Age | Young | 25 | 20.83 | 25 | 20.83 | 1.69NS |
| Middle | 71 | 59.17 | 72 | 60.00 | ||
| Old | 24 | 20.00 | 23 | 19.17 | ||
| Education | Illiterate | 00 | 00.00 | 17 | 14.17 | 2.47* |
| Can read only | 13 | 10.83 | 12 | 10.00 | ||
| Can read and write | 12 | 10.00 | 25 | 20.83 | ||
| Primary | 06 | 05.00 | 10 | 08.33 | ||
| Middle | 35 | 29.17 | 30 | 25.00 | ||
| High school | 19 | 15.83 | 15 | 12.50 | ||
| Graduate | 35 | 29.17 | 11 | 09.17 | ||
| Size of family | Small | 17 | 14.17 | 16 | 13.33 | -0.53NS |
| Medium | 86 | 71.66 | 89 | 74.17 | ||
| Big | 17 | 14.17 | 15 | 12.50 | ||
| Type of family | Nuclear family | 84 | 70.00 | 80 | 66.67 | -0.55NS |
| Joint family | 36 | 30.00 | 40 | 33.33 | ||
| Annual income | Low | 19 | 15.83 | 57 | 47.50 | 7.61** |
| Medium | 80 | 66.67 | 48 | 40.00 | ||
| High | 21 | 17.50 | 15 | 12.50 | ||
| Occupation | Cultivation + Labour | 00 | 00.00 | 04 | 03.34 | 2.11* |
| Cultivation + Caste occupation | 00 | 00.00 | 02 | 01.66 | ||
| Cultivation + Business | 02 | 01.66 | 02 | 01.66 | ||
| Cultivation | 110 | 91.67 | 111 | 92.50 | ||
| Cultivation + Service | 08 | 06.67 | 01 | 00.84 |
Table text extracted from the original PDF; superscript letters are shown inline. The original table image is below.
View original table image
The calculated 'Z' value 2.47 significant at 0.05% level of probability indicating that there was significant difference in education of beneficiaries and non-beneficiaries of KCC Scheme. The findings are similar to Keshri (2014) [8] and Gottemukkula (2017) [6] .
Size of Family
It was revealed from Table 1 that, 71.66 percent of the beneficiaries belonged to medium size of family, followed by 14.17 percent of the beneficiary's belonged to small and big size of family. While nearly three fourth (i.e. 74.17%) of the non-beneficiaries belonged to medium size of family, followed by 13.33 percent of the non-beneficiaries belonged to small size of family and 12.50 percent of the nonbeneficiaries belonged to big size of family. It was observed from above table that, majority of the respondents belonged to medium size of family. The probable reason is the fragmentation of joint families into nuclear families. Another reason might be that the family planning which results in lesser members in the family. Medium size of family creates more employment opportunities to the family labour. The 'Z' value -0.53 is non-significant, indicate that there was no significant difference in size of family of beneficiaries and non-beneficiaries of KCC Scheme. The findings are similar to Rameshkumar S. and Alexpandi M. (2017) [12] . www.extensionjournal.com
Type of family
It was revealed from Table 1 that, 70.00 percent of the beneficiaries belonged to nuclear family and 30.00 percent of the beneficiaries belonged to joint family. While 66.67 percent of the non-beneficiaries belonged to nuclear family and 33.33 percent of the non-beneficiaries belonged to joint family.
It was observed from above table that, the majority of the respondents belonged to nuclear family. The reason might be that the people of present generation have tendency to separate from joint family after marriage. The people are preferring nuclear families over joint families. The 'Z' value -0.55 is non-significant, indicate that there was no significant difference in type of family of beneficiaries and non-beneficiaries of KCC Scheme.
The findings are similar to Roshni Ritu Murmu et al. (2019) [13] .
Annual income
It was revealed from Table 1 that, two third (i.e. 66.67%) of the beneficiaries belonged to medium annual income followed by 17.50 percent of the beneficiaries belonged to high annual income and 15.83 percent of the beneficiaries belonged to low annual income. While 47.50 percent of the non-beneficiaries belonged to low annual income followed by 40.00 percent of the non-beneficiaries belonged to medium annual income and 12.50 percent of the nonbeneficiaries belonged to high annual income. It was observed from above table that, majority of the beneficiaries were from medium annual income group. While majority of the non-beneficiaries were from low annual income group. Such findings are due to the majority of the beneficiaries belonged to small and semi-medium land holding category and non-beneficiaries belonged to marginal land holding category. Due to financial support from KCC Scheme to the beneficiaries for cultivation needs helps to increase the crop production resulted in increase in annual income. The 'Z' value 7.61 significant at 0.01% level of probability indicating that there was significant difference in annual income of beneficiaries and non-beneficiaries. The findings are similar to Bhosale (2019) [2] and Roshni Ritu Murmu et al. (2019) [13] .
Occupation
It was revealed from Table 1 that, majority (i.e. 91.67%) of the beneficiaries had cultivation as their occupation, 06.67 percent of the beneficiaries had cultivation + service as their occupation, 01.66 percent of the beneficiaries had cultivation + business as their occupation and no any beneficiaries had cultivation + labour or cultivation + caste occupation as their occupation. While majority (i.e. 92.50%) of the non-beneficiaries had cultivation as their occupation, 03.34 percent of the non-beneficiaries had cultivation + labour as their occupation, 01.66 percent of the nonbeneficiaries had cultivation + caste occupation and cultivation + business as their occupation and 00.84 percent of the non-beneficiaries had cultivation + service as their occupation.
It was observed from above table that, majority of the respondents had cultivation as their main occupation. It might be due to ancestral traditional occupation and financial support from KCC Scheme for the cultivation needs.
The 'Z' value 2.11 significant at 0.05% level of probability indicating that there was significant difference in occupation of beneficiaries and non-beneficiaries of KCC Scheme. The findings are similar to Pramod Parwate and M. L. Sharma (2018) [10] .
Land holding
It was revealed from Table 1 that, 41.67 percent of the beneficiaries belonged to small land holding category, followed by 26.67 percent of the beneficiaries belonged to semi-medium land holding category, one fourth (i.e. 25.00%) of the beneficiaries belonged to marginal land holding category, 04.16 percent of the beneficiaries belonged to medium land holding category and 02.50 percent of the beneficiaries belonged to big land holding category. While 45.83 percent of the non-beneficiaries belonged to marginal land holding category, 43.34 percent of the non-beneficiaries belonged to small land holding category, 07.50 percent of the non-beneficiaries belonged to semi-medium land holding category, 02.50 percent of the non-beneficiaries belonged to medium land holding category and 00.83 percent of the non-beneficiaries belonged to big land holding category.
It was observed from above table that, majority of the beneficiaries had small and semi-medium land holding and non-beneficiaries had marginal land holding. The probable reason might be that size of land holding reduced day by day due to fragmentation of land as separation of families from joint to nuclear families. The 'Z' value 4.02 significant at 0.01% level of probability indicating that there was significant difference in land holding of beneficiaries and non-beneficiaries of KCC Scheme.
The findings are similar to Verma (2016) [16] , Gottemukkula (2017) [6] and Bhosale (2019) [2] .
Extension Contact
It was revealed from Table 1 that, nearly two third (i.e. 64.17%) of the beneficiaries had medium extension contact, 19.17 percent of the beneficiaries had high extension contact and 16.66 percent of the beneficiaries had low extension contact. While nearly half (i.e. 49.17%) of the nonbeneficiaries had medium extension contact, 34.17 percent of the non-beneficiaries had low extension contact and 16.66 percent of the non-beneficiaries had high extension contact.
It was observed from above table that, majority of the respondents were having medium extension contact. It is because of their interest and good contact with the extension officer, Gramsevak, bank officers, VEW, Agril. Officer, DRDA staff, etc. Beneficiaries had more sources of information which helps to increasing their extension contact.
The 'Z' value 6.70 significant at 0.01% level of probability indicating that there was significant difference in extension contact of beneficiaries and non-beneficiaries of KCC Scheme.
The findings are similar to Sharma (2010) [15] , Gottemukkula (2017) [6] and Bhosale (2019) [2] .
Sources of information
It was revealed from Table 1 that, two fifth (i.e. 60.00%) of the beneficiaries had medium sources of information, 25.83 percent of the beneficiaries had high sources of information and 14.17 percent of the beneficiaries had low sources of information. While 47.50 percent of the non-beneficiaries had medium sources of information, 36.67 percent of the non-beneficiaries had low sources of information and 15.83 percent of the non-beneficiaries had high sources of information.
It was observed from above table that, most of the respondents had medium sources of information. It might be because of most of the beneficiaries got information about KCC Scheme from family members, friends, relatives, progressive farmers, agriculture officers, bank officers, extension officers, Grampanchayat members, TV, newspaper, mobile, internet, etc. also they have strong communication facilities and availability of mass media. While non-beneficiaries had poor communication facilities, lack of time and understanding. The 'Z' value 5.76 significant at 0.01% level of probability indicating that there was significant difference in sources of information of beneficiaries and non-beneficiaries of KCC Scheme.
The findings are similar to Dawar (2011) [3] and Parwate et al. (2018) [10] .
Economic motivation
It was revealed from Table 1 that, 53.33 percent of the beneficiaries had medium economic motivation, one fourth (i.e. 25.00%) of the beneficiaries had high economic motivation and 21.67 percent of the beneficiaries had low economic motivation. While 42.50 percent of the nonbeneficiaries had medium economic motivation, 37.50 percent of the non-beneficiaries had low economic motivation and 20.00 percent of the non-beneficiaries had high economic motivation.
It was observed from above table that, most of the respondents had medium economic motivation. The probable reason could be that, for better agriculture production requires availability of inputs and cultivation resource base at proper time. For this KCC Scheme provide financial support which leads to increase in crop production. This might be due to the sources of information and extension contact which provide information about KCC Scheme leads to better economic motivation. The 'Z' value 6.69 significant at 0.01% level of probability indicating that there was significant difference in economic motivation of beneficiaries and non-beneficiaries of KCC Scheme.
The findings are similar to Sekhon (2010) [14] .
Risk orientation
It was revealed from Table 1 that, 55.00 percent of the beneficiaries had medium risk orientation, 29.17 percent of the beneficiaries had high risk orientation and 15.83 percent of the beneficiaries had low risk orientation. While 45.00 percent of the non-beneficiaries had medium risk orientation, 38.33 percent of the non-beneficiaries had low risk orientation and 16.67 percent of the non-beneficiaries had high risk orientation. It was observed from above table that, most of the respondents had medium risk orientation. This is due to the medium annual income and small and semi-medium land holding of the beneficiaries. Majority of the beneficiaries educated up to middle level and graduate which help them to understand the situation and take the risk whenever required. Also, majority of the beneficiaries had medium and high knowledge which helped them to improve skill and risk-taking ability among the beneficiaries. The 'Z' value 4.72 significant at 0.01% level of probability indicating that there was significant difference in risk orientation of beneficiaries and non-beneficiaries of KCC Scheme.
The findings are similar to Parwate et al. (2018) [10] .
Overall knowledge about KCC scheme
It was revealed from Table 1 that, 47.50 percent of the beneficiaries had medium level of overall knowledge, 38.33 percent of the beneficiaries had high level of overall knowledge and 14.17 percent of the beneficiaries had low level of overall knowledge. While 41.67 percent of the nonbeneficiaries had medium level of overall knowledge, 40.83 percent of the non-beneficiaries had low level of overall knowledge and 17.50 percent of the non-beneficiaries had high level of overall knowledge. It was observed from above table that, majority of the beneficiaries had medium and high level of knowledge while non-beneficiaries had medium and low level of knowledge. The reason behind this is the beneficiaries were well known about KCC Scheme because they got information from various sources of information and extension contacts. The 'Z' value 12.88 significant at 0.01% level of probability indicating that there was significant difference in knowledge of beneficiaries and non-beneficiaries of KCC Scheme. The findings are similar to Rajput (2011), Gole (2013) [5] and Roshni Ritu Murmu et al. (2019) [13] . www.extensionjournal.com
Conclusion
It was concluded that there is significant difference between socio-economic profile of the KCC Scheme beneficiary farmers and non-beneficiary farmers. Therefore KCC scheme is beneficial for the farmers to enhance their livelihood.
Implication
It is implied that, banking personnel and policy makers try to promote the use and benefits of KCC Scheme for better farming so as to ensure maximize crop production and returns.
References
14 in the original paper- Bansode SM, Ankush GS, Mande JV, Suradkar DD. Impact of Self Help Group on socio-economic development of their members. J Community Mobilization Sustain Dev. 2013;11:117-120.
- Bhosale GS. Crop loan borrowing behaviour of farmers [Master's Thesis]. Parbhani: Vasantrao Naik Marathwada Krishi Vidyapeeth; 2019.
- Dawar G. A study on Repayment Behaviour of Kisan Credit Card users of Thikari block, Barwani district of Madhya Pradesh [Master's Thesis]. Jabalpur: Jawaharlal Nehru Krishi Vishwa Vidyalaya; 2011.
- Dhaka S. Impact of Kisan Credit Card (KCC) on Farmers of Banswara District of Rajasthan. [M.Sc. (Agri.) Thesis]. Udaipur: Rajasthan College of Agriculture, Maharana Pratap University of Agriculture and Technology; 2013.
- Gole A. A study on repayment behavior of Kisan Credit Card users of Panagar block of Jabalpur District of Madhya Pradesh. [M.Sc. (Agri.) Thesis]. Gwalior: Rajmata Vijayaraje Scindia Krishi Vishwa Vidyalaya; 2013.
- Akola: Dr. Panjabrao Deshmukh Krishi Vidyapeeth; 2017.
- Kale MG. Impact of Swarnjayanti Gram Swarojgar Yojana on socio-economic condition of beneficiaries. [M.Sc. (Agri.) Thesis]. Parbhani (Maharashtra): Marathwada Krishi Vidyapeeth; 2012.
- Keshri AK. Impact of Kisan Credit Card (KCC) on Socio-economic status of the Farmers of Bikaner District, Rajasthan. [M.Sc. (Agri.) Thesis]. Bikaner: Swami Keshwanand Rajasthan Agricultural University; 2014.
- Mankar DM, Wankhade PP, Shambharkar YB. Impact of National Horticulture Mission on its beneficiaries. Int J Ext Educ. 2013;9:72-80.
- Parwate PP, Sharma ML, Maske MR. Satisfaction of farmers about Kisan Credit Card in Raipur District of Chhattisgarh. Int. J Agric Sci. 2018;10(21):7441-7444.
- Rajput JS. A study on Repayment Behaviour of Crop loan beneficiaries of Budhani Block of Sehore district, Madhya Pradesh. [M.Sc. (Agri.) Thesis]. Gwalior: Rajmata Vijayaraje Scindia Krishi Vishwa Vidyalaya; 2011.
- Rameshkumar S, Alexpandi M. Farmers Attitude towards Kisan Credit Card (KCC) scheme -The case of Sivagangai Taluk in T.N. Int. J Curr Res. 2017;9(6):52244-52249.
- Murmu RR, Bose DK, Jahanara. Knowledge of the Beneficiaries and Non-beneficiaries about Kisan Credit Card Scheme in Deoghar Block of Deoghar District, Jharkhand, India. Int J Curr Microbiol Appl Sci. 2019;8(6):435-442.
- Thesis]. Gwalior: Rajmata Vijayaraje Scindia Krishi Vishwa Vidyalaya; 2010.
Social Participation
It was revealed from Table 1 that, nearly half (i.e. 49.17%) of the beneficiaries had medium social participation, 30.00 percent of the beneficiaries had high social participation and 20.83 percent of the beneficiaries had low social participation. While 45.83 percent of the non-beneficiaries had low social participation, 35.83 percent of the nonbeneficiaries had medium social participation and 18.34 percent of the non-beneficiaries had high social participation.
It was observed from above table that, most of the beneficiaries had medium social participation. This might be due to that, they had membership of one or two organizations like cooperative society, FPO's, oil mills, Grampanchayat, etc. for personal interest and benefits. While non-beneficiaries had low social participation might be due to lack of interest, local politics and hesitate to participate. The 'Z' value 4.13 significant at 0.01% level of probability indicating that there was significant difference in social participation of beneficiaries and non-beneficiaries of KCC Scheme.
The findings are similar to Sharma (2010) [15] , Gole (2013) [5] , Verma (2016) [16] and Gottemukkula (2017) [6] . www.extensionjournal.com