
Research article · 2024 · Full text
International Journal of Agriculture and Food ScienceEvaluation and impact of the performance of two types of emitters for the subsurface drip irrigation system and moisture depletion on water consumption, water use efficiency, and potato yield (Solanum tuberosum L.)
Volume 6(1) · Pages 110–116 · DOI: 10.33545/2664844x.2024.v6.i1b.174 ↗
Research areasIrrigation Practices and Water Management
Abstract
Author-writtenA field experiment was done on one of the station fields of the Agricultural Research and Experiments Station of the College of Agriculture/University of Kirkuk. As a continuity for the autumn period of 2023 and from (26-9-2023) to (1-4-2024). The experiment was done with two factors which were type of the drip irrigation tube as the first and the level of the moisture depletion as the second. The experimentation was done in three replications the RCBD and the split plot design. The drip irrigation examined by the results showed that the nano emitter draining has the greatest effect on the T-Tape emitter. As for the highest value of water usage, this was 247.18 mm season-1 with the rate of moisture depletion of 35%, while the lowest level was 244.78 mm season-1 with the rate of moisture depletion of 55%. The upper limit of the total yield was 28,998 Mg ha-1 when water stress was 35%, and it reached 20,713 Mg ha-1 when water stress was 55%. The greatest water consumption by a land filed was 18.875 mkg-3 if a Tape drip irrigation emitter was used; while the water consumption efficiency of 35% gave me the greatest water consumption efficiency of 19.294 mkg-3 compared to the water consumption rate of 55%, which was 13.995 mkg-3. When the drip irrigation system evaluated, not appeared significant difference between T-tape and Nano emitters for hydraulic characteristics.
Summary
Source-checkedPlain-language reading of the full paper, prepared with AI and checked against the text. Each point links to the authors' own words.
Why it matters
- Global agricultural development is hindered by the scarcity and insufficiency of irrigation water. View evidence ↗
- Subsurface drip irrigation systems are designed to reduce water loss from surface evaporation and deep seepage by delivering water directly to the root zone. View evidence ↗
- In arid and semi-arid regions like Iraq, studying water consumption is critical because rainwater is insufficient for crops. View evidence ↗
The question
- The study aims to evaluate how two different emitter types and levels of moisture depletion affect the water consumption and water use efficiency of potato crops. View evidence ↗
What they did
- The field experiment was conducted at the University of Kirkuk's Agricultural Research and Experiments Station from September 26, 2023, to April 1, 2024. View evidence ↗
- The moisture depletion levels tested were 35% and 55% of ready water. View evidence ↗
- The experiment used 'Lady Rosetta' potato tubers, planted at a depth of 8-10 cm. View evidence ↗
What they found
- There were no statistically significant differences between Nano and T-tape emitters regarding their hydraulic characteristics, including the coefficient of variation. View evidence ↗
- Water consumption was higher when moisture depletion was 35% (247.18 mm season-1) compared to when it was 55% (244.78 mm season-1). View evidence ↗
- T-tape emitters resulted in a higher total potato yield (26,831 kg/ha) than nano-type emitters (22,881 kg/ha). View evidence ↗
- A moisture depletion rate of 35% produced a significantly higher total yield (28,998 Mg ha-1) than a 55% depletion rate (20,713 Mg ha-1). View evidence ↗
- T-tape emitters were more efficient in water utilization (18.875 kg m-3) compared to nano-type emitters (14.414 kg m-3). View evidence ↗
- Field water use efficiency was highest at a 35% depletion rate (19.294 kg m-3) and lowest at a 55% depletion rate (13.995 kg m-3). View evidence ↗
What it means
- The authors conclude that the best results for tuber yield and field water use efficiency were achieved using T-Tape emitters with a moisture depletion level of 35%. View evidence ↗
Visual summary
3 visualsIllustrations explain the paper; charts are replotted from the paper's own table values.
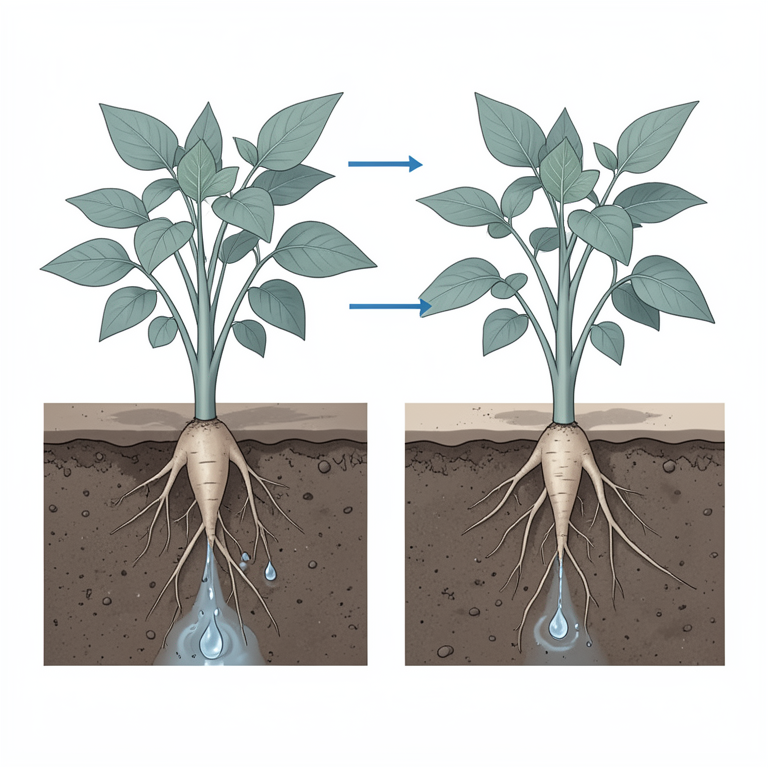
Subsurface Drip Irrigation Concept
AI-generated conceptual illustration (potato plants (Solanum tuberosum L.) in soil). It explains the idea and does not show study data.
View source evidence ↗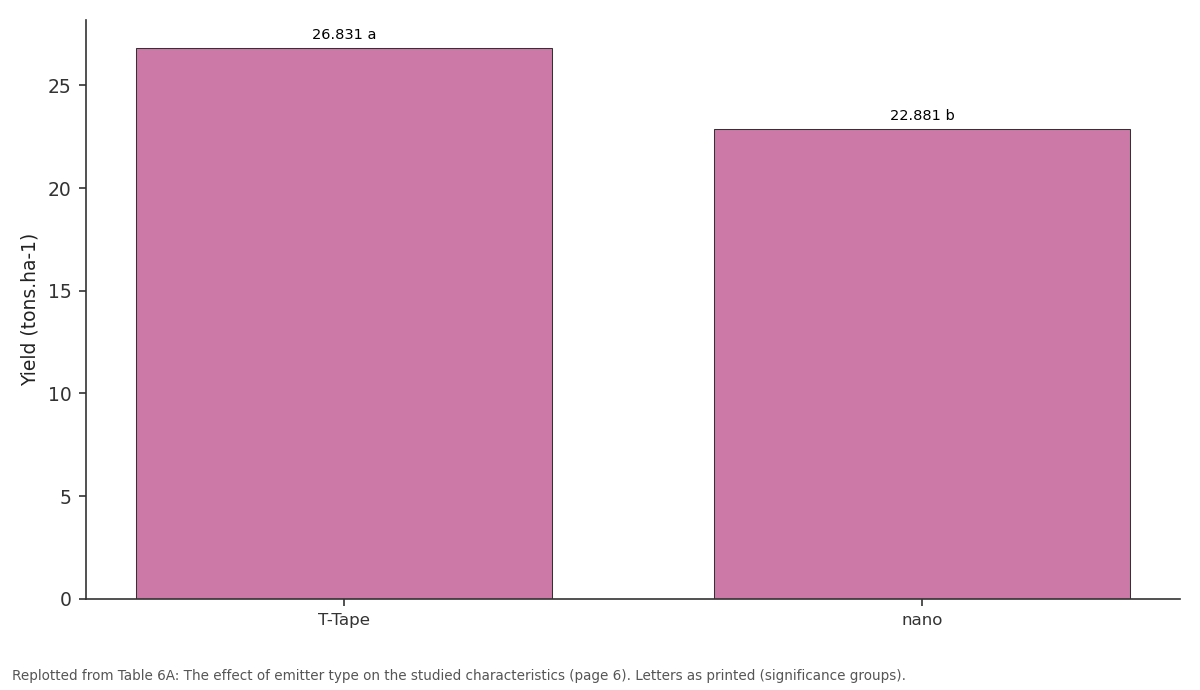
Studied attributes / Yield (tons.ha-1): T-Tape vs nano
Replotted from Table 6A (page 6) of the original paper. Every bar is the paper's own table value.
View source evidence ↗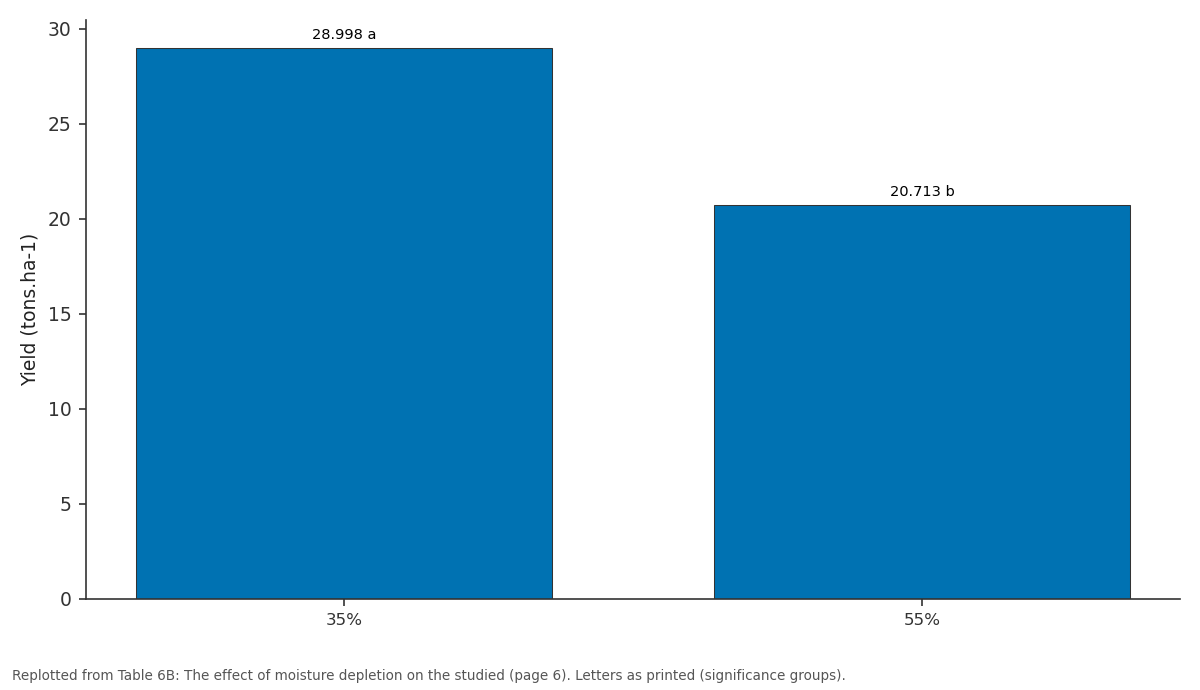
Studied attributes / Yield (tons.ha-1): 35% vs 55%
Replotted from Table 6B (page 6) of the original paper. Every bar is the paper's own table value.
View source evidence ↗Figures & tables
From the original paper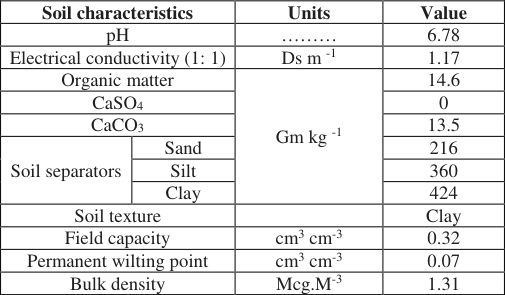 Table 1
 Table 2
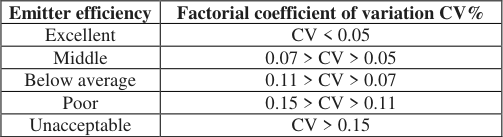 Table 3
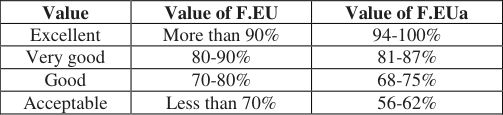 Table 4
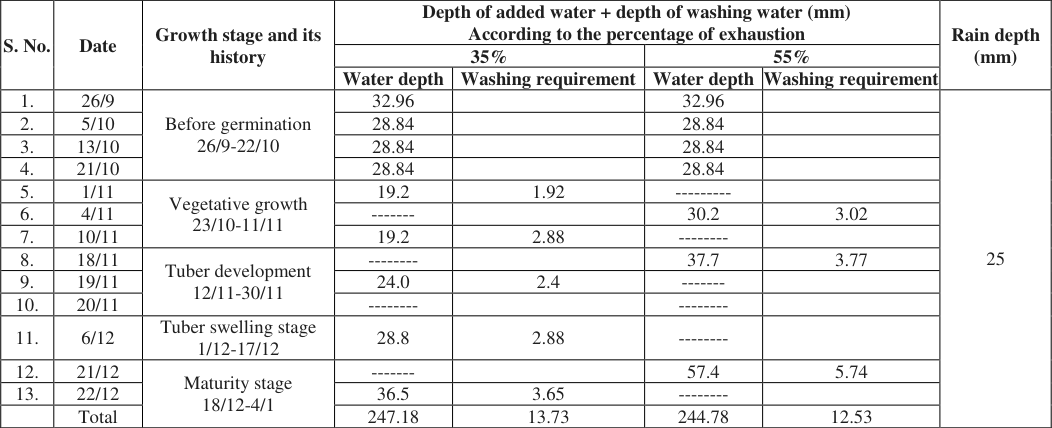 Table 5
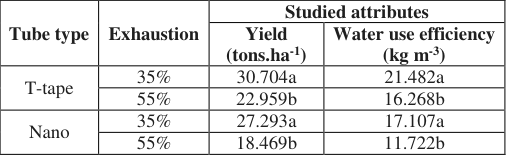 Table 7
 Table 6A
 Table 6B
Introduction
Water is considered the basic foundation for agricultural development and has an essential role in human life and the environment. The scarcity and insufficiency of irrigation water is the main problem facing the world (Ghazal and Ismail, 2017) [31] . Drip irrigation systems are one of the modern irrigation systems. They are a group of emitters through which water is transmitted using lift pumps that generate the necessary pressure (Tahir and Ameen, 2019) [23] . They also contain filters for filtering and fertilizer injectors so that the water comes out of small holes called emitters (Parthush and Suman, 2012) [14] . Usmanov and Gregoritti (2017) [15] mentioned that drip irrigation is a type of irrigation that has gained great interest in recent years, due to its ability to increase production and reduce water waste, which slowly emerges from the emitter and directly to the plant's root area. Many researchers have confirmed that an important part of irrigation water is lost after irrigation from the surface of the soil as evaporation. Therefore, the idea of adding irrigation water directly below the surface of the soil in the area where plant roots spread without allowing the water to moisten the surface parts of the soil and reducing losses from deep seepage appeared. This is currently known as the subsurface drip irrigation system (ASAE, 2003) [13] . The subsurface drip irrigation system is considered highly efficient compared to other irrigation systems, as this system works to supply the plant with quantities of water to a specific area in the root zone, according to the plant's need at all stages of its growth, and thus it has an effect in In agricultural soils in which the percentage of salinity increases and thus affects the reduction of the water effort used in those salty lands and the increase in the soil's acquisition of water in them, the drip irrigation system is considered an influential factor in displacing those amounts of salinity accumulated in the root zone, causing continued germination and growth of the cultivated plants that are watered. With this system The efficiency percentage of irrigation with the drip system differs from the rest of the available irrigation systems, as it ranges from (95-85) %. When using drip irrigation, a humidity percentage ranging between (100-80) % of the field capacity is provided, as this percentage helps to provide sufficient moisture for the plant in the different stages of growth, not exceeding the field capacity, and not allowing water loss to the interior of the agricultural land (Khalil, 1998) [4] . Given the difference in the degree of equivalence of the emitters when calculating and measuring flow, it is necessary for the farmer to determine the type of emitter used in the drip irrigation system (Bozkurt and Ozekjci., 1999) [16] and (Hassan et al., 2017) [27] . Water consumption is one of the variables of the yield production function, and knowing water consumption is important as a result of the decrease in water reserves, the climate, and the decrease in water resources allocated for agricultural purposes. One of the very difficult and complex matters is the relationship of the decrease in water needs versus the density of planting plants per unit area, the timing and duration of cultivation, modeling, and the response of the crop to Low water, and initial efforts to understand this relationship lead to finding a relationship between water consumption and yield, which results in a yield production function that is widely used in economic analysis to determine the crop's response to water use (Afrous et al., 2014) [9] . The importance of water consumption studies in Iraq comes from the fact that it is located within the borders of the arid and semi-arid region, as the importance of delivering water through irrigation increases due to insufficient rainwater. Also, the information obtained from studies of water consumption of agricultural crops can lay the basic foundation through which projects are proposed and planned. Irrigation and puncture. There are several studies and experiments on water consumption of potato crops in the world, but these studies are limited in Iraq. This study aims to evaluate and impact the performance of two types of emitters using a subsurface drip irrigation system and moisture depletion on water consumption and water use efficiency of potato crops.
Materials and Methods
The field experiments were performed on one of the fields that belongs to the Agriculture Research and Experiments Station of the Agriculture College / University of Kirkuk. The Al-Sayada area will be available in the fall season for the year 2023 and will be present from (9/26/2023) to (1/4/2024). Soil samples were taken from the field by using the soil auger with the square method at a depth of (0.3-0) m. Then the soil mixed together and the drying of air was done. The soil sample was passed through the sieve whose diameter was 2 mm and then the analysis and measurements were carried out. Table (1) provides some of the most important physical and chemical properties of the study soil as illustrated below. There were two factors considered for the studies. The first factor was the type of drip irrigation pipe, one of them was carrying a nano emitter, while the other one was carrying a T-tape emitter. The second factor was the percentage of moisture depletion (35% and 55%). The experiment was run 3 times as RCBD with a split-plot design. The experiment was carried out on a site of 28 m x 16 m, with length of 448 m 2 ; this land was prepared for the experiment using a moldboard plow and then was smoothed. For the experiment, the field was divided into three parts with a width of 4 m and a length of 28 m. by way of a guarded area of 2 m (distance) to be left in between the sectors. An under-the-surface drip irrigation system was set up, which had a main line 16 m long and also three secondary lines; each line 28 m long, while the side lines were two types of tube. The first kind of nano emitter is a plastic polyethylene with diameter of 0.016 m. Having 4 m in length, 0.30 m is a distance between one dot and another as well as 0.75 m is a distance between two lines. There are 13 dots inside the outer line. There are two types of emitters: t-tape with 0.016 m diameter and PE material with 4 m length. The distance between each drip is 0.1 m and the distance between one line and another is 0.75 m. The side line carries 40 emitters. The functioning of the drip irrigation system was tested to determine the operating pressure that should be used throughout the season prior to planting. Three operating pressures of 0.5, 0.75 and 1 bar were selected when the evaluation process was underway, to measure drip discharge for both Nano and T-Tape models by reading the pressure on the operational gauge placed at the start. The main canal and with the controller switch placed to the overflow water emitter. away from the plant, and burying them at a depth of 8-10 cm, following Al-Mohammadi (2011) [29] . Afterwards, tubers put in the solution of Topsin pesticide at a concentration of 100 g/100 liters water for 5 minutes as a sterilizing substance against fungal infections with a tuberto-tuber distance of 0.3 m and a 0.75 m agricultural line-to-Soil and foliar fertilization methods were adopted to supply the crop with the nutrients needed both for growth and yield.
For the ground method, Blaukorn compound fertilizer (17-12-12) was applied at 400 kg K2O ha -1 , 300 kg P2O5 ha -1 , and 300 kg N ha -1 (Ali, 2012) [28] .
The factorial coefficient of variation of the emitter discharge was calculated using the following equation (Sabah et al., 2023a) [21] .
Since Cv = Factorial variance coefficient (%). SD = Standard deviation of expenditures (liters per hour -1 ). qm = Emitter discharge rate (liters per hour -1 ).
Variation of Emitter Flow (QVAR)
The variation of drip discharge along the irrigation line was calculated using the equation (Christiansen, 1942) [7] .
Since qvar = Point discharge variance (%) qmax = Maximum drip discharge (liters per hour -1 ) qmin = Minimum drip discharge (liters per hour -1 )
Design emission uniformity
Was calculated using the following equation (Sabah et al., 2023b) [25] (3) Since EU = design emission Uniformity (%). qn = average emitter discharge for the lowest quarter (liters per hour -1 ) Cv = factorial variance coefficient (%) qm = emitter discharge rate (liters per hour -1 ) n = number of pixels
The field emission consistency was calculated based on the following equation (Abd-al Rahman et al., 2019) [22] .
(4) Since F.EU = Field emission uniformity (%) qm = Emitter discharge rate (liters per hour -1 ) qn = Average emitter discharge for the lowest quarter (liters per hour -1 )
Absolute Field Emission Uniformity
The absolute field emission coherence value was calculated based on the equation mentioned in (Al-Bajari et al., 2023) [26] .
(5) Since F. EUa = absolute field emission uniformity (%) qx = average discharge of emitters for the highest price of emitters (liters per hour -1 ) qn = Average emitter discharge for the lowest quarter (liters per hour -1 )
Calculating crop water consumption and irrigation timing
Irrigation was given before planting in order to create a moisture balance in the soil, based on the soil moisture at field capacity and the initial humidity before irrigation. The depth of the irrigation water was calculated based on the depth of the root zone, which was 0.30 m. Moisture depletion treatments of 35% and 55% of ready water were applied after the completion of germination and the beginning of the vegetative growth phase on 23/10/2023 and continued until the end of the experiment on 4/1/2024. Irrigation was scheduled for all study treatments based on the potato growth stage, using the evaporation basin present in the field to determine the timing of irrigation as a preliminary indicator in order to guide taking soil samples from the field and actually estimating the remaining moisture in the soil by the gravimetric method. Use the American evaporation basin, class A (a galvanized iron basin with a diameter of 1.2 m and a depth of 0.25 m) to determine the timing of irrigation, as follows.
1. The depth of water that must be added to the soil (d) was calculated by applying the mathematical equation mentioned by (Al-Shamari et al., 2020) [10] .
(6) d = Depth of water to be added (cm), which is equivalent to actual water consumption (ETa). θfc = Soil moisture at field capacity (cm 3 cm -3 ). θpw = Soil moisture before irrigation (cm 3 cm -3 ).
Root depths were estimated on the basis of experimental observations according to the stages of plant growth.
2. The reference evapotranspiration (ETo) was calculated according to the equation mentioned in (Tahir et al., 2020) [24] , as follows:
ETo = Reference evapotranspiration (mm day -1 ). ETa = Actual evapotranspiration (mm day -1 ). Kc = Yield coefficient (the yield coefficient values were adopted for the four growth stages mentioned in (Table 5) according to what was mentioned in (FAO, 1986) [33] .
| S. No. | Date | Growth stage and its history | Depth of added water + depth of washing water (mm) According to the percentage of exhaustion | — | — | — | Rain depth (mm) |
|---|---|---|---|---|---|---|---|
| 35% | 55% | ||||||
| Water depth | Washing requirement | Water depth | Washing requirement | ||||
| 1. | 26/9 | Before germination 26/9-22/10 | 32.96 | 32.96 | 25 | ||
| 2. | 5/10 | 28.84 | 28.84 | ||||
| 3. | 13/10 | 28.84 | 28.84 | ||||
| 4. | 21/10 | 28.84 | 28.84 | ||||
| 5. | 1/11 | Vegetative growth 23/10-11/11 | 19.2 | 1.92 | --------- | ||
| 6. | 4/11 | ------- | 30.2 | 3.02 | |||
| 7. | 10/11 | 19.2 | 2.88 | -------- | |||
| 8. | 18/11 | Tuber development 12/11-30/11 | -------- | 37.7 | 3.77 | ||
| 9. | 19/11 | 24.0 | 2.4 | ------- | |||
| 10. | 20/11 | -------- | -------- | ||||
| 11. | 6/12 | Tuber swelling stage 1/12-17/12 | 28.8 | 2.88 | -------- | ||
| 12. | 21/12 | Maturity stage 18/12-4/1 | ------- | 57.4 | 5.74 | ||
| 13. | 22/12 | 36.5 | 3.65 | -------- | |||
| Total | 247.18 | 13.73 | 244.78 | 12.53 |
Table text extracted from the original PDF; superscript letters are shown inline. The original table image is below.
View original table image
3. Irrigation was timed by knowing the amount of water lost from the Epan basin as a preliminary indicator in order to guide taking soil samples from the field and actually estimating the remaining moisture in the soil by the weight method, as in the equation mentioned in (Al-Hadithi et al., 2010) [1] , as follows:
Since
ETpan = Evaporation from the basin (mm day -1 ). ETa = Actual evapotranspiration (mm day -1 ). Kp = A coefficient specific to the evaporation basin, which varies depending on the type of basin, the vegetation surrounding the basin, and the nature of the soil surface (Al-
Hadithi et al., 2010) [1] . The value 0.85 was adopted in the study according to what was stated in (FAO, 1984) [32] .
The yield of tubers for each treatment (the average area of one treatment for three replicates is 6 m 2 ) was estimated individually, then the yield was attributed to hectares using the equation mentioned before (Al-Zobaie and Shukri, 2009) [30] and my agencies:
Yield per hectare = ((kg) experimental unit yield) / ((m 2 ) experimental unit area) x 10000 (9)
Field water use efficiency
Water use efficiency, or water unit productivity, was calculated by dividing the yield (kg ha -1 ) by the volume of water added (m 3 ha -1 season), according to the equation Cracium and Cracium (1996) [12] provided as shown below:
Field water use efficiency (kg m -3 season) = ((kg hr -1 ) total yield) / ((m 3 hr -1 ) added water quantity)
The results were analyzed statistically using the SAS, 2000 program for analysis of variance (F test), and the least significant difference (RCBD) and Duncan's multiple range test were used for the purpose of comparing the different parameters included in the study.
Results and Discussion
Evaluation of drip irrigation system The Coefficient of Manufacture Variation (CV %) Evaluating the drip irrigation system is one of the things that must be carried out before starting to implement any field experiment that is irrigated by a drip irrigation system by calculating the average discharges at several operating pressures, which is one of the most important measurements for evaluating a system to know the actual expenses of the emitters approved in calculating the irrigation periods or the time period for operating the system. And irrigation (Tahir et al., 2020) [24] . We notice in Table (2) that there are no significant differences in the coefficient of variation CV% between the nano-type emitter and the T-tape type emitter, but when we return to Table (3) we notice that the nano-type emitter recorded a value of the coefficient of variation CV% within the average level (0.0588). While the T-tape type spotter recorded the lowest value within the below average level (0.0724). The lower value is considered better according to Table (3), which reflects the extent of manufacturing quality and the reduction in the percentage of variation in the drip discharge. We also notice this in the variation of the emitter discharge, as the nano-type emitter achieved the lowest variance (0.012), while the T-Tape emitter recorded a greater variance (0.017). We also notice from the table (2) that the emitters has been achieved excellent values characteristics (water addition efficiency, field emission efficiency and absolute field emission) according to the table (4) it was not significant difference between them. Table (5) shows the amounts of water consumed during the growth stages of the potato crop for the different treatments.
The amounts of water added to the field during the growing season varied depending on the percentage of moisture depletion (35 and 55%) in the fall season of 2023. The highest value of water consumption reached 247.18 mm season -1 for the treatments that irrigated when 35% of the ready water was exhausted, while the value of water consumption for the treatments that irrigated when 55% of the ready water was exhausted reached 244.78 mm season -1 . That is, the irrigation treatment when the moisture is exhausted 35% higher water consumption compared to the irrigation treatment when moisture depletion is 55%. This is because the relationship between moisture depletion rates and water consumption is inversely closed, as increasing moisture depletion rates leads to the moisture content of the soil being close to the point of permanent wilting, while at low depletion the content The moisture content is close to the field capacity, as the intervals between one irrigation are close to another, which leads to an increase in the rate of water consumption by increasing the moisture content of the soil. The washing requirements for irrigation water added to the field when 35% of the ready water was exhausted amounted to 13.73 mm compared to when 55% of the ready water was exhausted, where the amount of washing amounted to 12.53 mm. It is also clear from Table (5) that water consumption differed according to the phenological stages, and in general the consumption decreased. Water as the crop grows. The water consumption of the potato crop was high during the germination stage, which was during late September and early October, which coincided with high temperatures and low relative humidity, in addition to the lack of rain falling during this stage. Then, water consumption decreased during the tuber emergence stage and reached 24.0 mm due to rainfall that reached 25 mm and a drop in temperatures. Then water consumption gradually decreased during the vegetative growth stage and then continued to decrease during the tuber emergence stage and the maturity stage. This decrease in water consumption was followed by a decrease in average air temperature and an increase in average daily relative humidity during each stage of potato growth. Reducing the added irrigation water to a certain extent makes the plant exert a greater effort to absorb water, causes activation and stimulation of the root system, and increases the volume of soil occupied by the roots to absorb water, leading to increased water use efficiency. Under conditions of limited water supply, it is necessary to increase and maximize production per unit area and not add water to a larger area. Therefore, rationalizing water consumption comes to the fore greatly by improving the time and depth of adding water and choosing the growth stage that tolerates water shortages. Water shortages will affect Production and compatibility with (Jett., 2001) [17] .
It is evident that between the two types of subsurface drip irrigation emitters and the percentage of moisture depletion, the total yield of potato plants is affected as seen in Table (6-A). There was a proof that the type of the subsurface drip irrigation emitter causes a statistically significant difference in the yield parameters of the potatoes. The total yield rate went up to 26,831 kg/ha when the subsurface drip irrigation emitter of T-tape type was used and the yield was 22,881 kg/ha when the subsurface drip irrigation emitter of nanotype was employed. The potato yield is higher in a subsurface drip irrigation than the T-tape type could be due to the fact that the soil moisture is higher because it is receiving the total amount of water applied in this method, due to the large total number of emitters in one line, and this agrees. With the findings of Al-Issawi (2010) [5] and Spreer (2007) [18] Good uniformity in the distribution of water in the soil bed leads to a reduction in evaporation losses from the soil surface. This leads to an appropriate amount of water remaining available in the area of the plant's roots, as well as the transfer of water to the area surrounding the plant's roots. Therefore, placing drip lines in the area of the plant's roots to a depth Suitable from the soil surface (10 cm) led to effective preparation of water for the tubers, preventing evaporation losses from the soil surface, and reducing upward flow through capillary action. Field observations for this experiment showed that the soil surface remains dry throughout the growing season in the case of subsurface drip irrigation. Table (6-B) shows the effect of moisture depletion levels on the total yield values for the various study parameters. It is noted that the moisture depletion rate of 35% achieved the highest value for the total yield rate, as it amounted to 28,998 Mg ha -1 , compared to the moisture depletion rate of 55%, where its value reached 20,713 Mg ha -1 . The reason is due to the decrease in moisture content in the soil core when the moisture depletion rate increases 55%, which leads to a reduction in the efficiency of photosynthesis. In addition, the potato crop is sensitive to moisture depletion, and all of this negatively affects the yield, and this is consistent with what was indicated by (Sarhan, 2009) [2] .
Field water use efficiency (kg m -3 ) (Table 6A) illustrates that the study factors influence the efficiency of field water for potato as a foodstuff. The analysis of statistics proved that the different types of simple emitter resulted in field water use with an evident efficiency. However, scientists discovered that T-tape drip irrigation emitter was the most productive in water utilization, as it used 18.875 kg m -3 and exceeded significantly, the result of water utilization by the nano-type emitter was less efficient, and its value reached 14.414 kg m -3 . This causes a drop in the water consumption efficiency as large amounts of water is wasted by the drainage of the T-tape emitter. This is because the efficiency value of the water usage when using the T-tape emitter has increased and consequently has led to an increase in the amount of the volumetric moisture percentage in the soil bed hence, an increase in the dissolution of the nutrients that are needed for growth on the other hand. Simultaneously, it will possibility to convert the amount of irrigation water that coming from a nano emitter into more units of water than of a regular emitter. This outcome is the same which Al-Saadoun (2006) [6] had got. The last factor that had an impact on the effectiveness of the field water use was the coefficient of moisture depletion for the subsurface drip irrigation system. [8] and (Maluki, 2017) [3] . The table (7) below highlights the influence of moisture depletion treatments in conjunction with the type of subsurface drip irrigation emitter on the total yield and the efficiency of field water use. The fact that there is a sizeable influence of the dryness of the environment on the amount of harvest is highlighted. The treatment setting reduced water loss by 35% with the largest results obtained for the drying process. For T-tape below surface subsurface irrigation emitter and Nano type below surface subsurface drip irrigation emitter, the Mg ha -1 were (30,704 and 27,293) Mg ha -1 , respectively. whereas the moisture loss coefficients of 55% of the available water exhibit the lowest consumptive use value, the results showed it reached (22.959 and 18.969) Mg ha -1 for the T-tape type subsurface drip irrigation and the nano type subsurface drip irrigation. So, the main reason for the more-efficient irrigation treatment method at 35% water depletion rate may be that it has to do with the appropriate or suitable water in the soil The placement of drip lines in the best possible location where it is under the soil surface would increase the availability of water to the plant especially the roots, but this has also cut down on the upward movement of water by capillary action leading to the elimination of evaporation loss. Another reason for it can be the irrigation which drains 55% of this water's availability which then leads to water shortages and the difficulty of managing water at various stages of potato growth which in turns hinders the production of this crop (Yuan et al., 2003) [20] . Photosynthesis and drought occur during the stages of the tuber formation and filling, thus have a serious effect on the yield. Nevertheless, it is a known fact that some varieties of potatoes can withstand limited water deficit before tuber formation takes place without them having a huge negative impact on yield (Shock et al., 2007) [19] . (Table 7) evidence depicts the bilateral interaction of the drip irrigation emitter and the percentage of moisture depletion on the efficiency of utilization. If the data of field water analysis were studied, one can conclude that it was the main parameter (35% depletion rate) of both types of T-Tape and nano subsurface drip irrigation emitter with the values (21.482 and 17.107) kg m -3 , respectively. The field Water Use Efficiency (WUE) of the depletion ratio treatments approached the value of 55% (16.268 and 11.722) kg m -3 when the surface drip irrigation emitters of both types of T-Tape and Nano subsurface drip irrigation emitter were used.
| Tube type | Exhaustion | Studied attributes | — |
|---|---|---|---|
| Yield (tons.ha-1) | Water use efficiency (kg m-3) | ||
| T-tape | 35% | 30.704a | 21.482a |
| 55% | 22.959b | 16.268b | |
| Nano | 35% | 27.293a | 17.107a |
| 55% | 18.469b | 11.722b |
Table text extracted from the original PDF; superscript letters are shown inline. The original table image is below.
View original table image
The causes for the decline in water use efficiency for irrigation at depletion level of 55% may be attributed to the plants being exposed to stress.
Figures and tables from the paper
| Soil characteristics | — | Units | Value |
|---|---|---|---|
| pH | ……… | 6.78 | |
| Electrical conductivity (1: 1) | Ds m -1 | 1.17 | |
| Organic matter | Gm kg -1 | 14.6 | |
| CaSO4 | 0 | ||
| CaCO3 | 13.5 | ||
| Soil separators | Sand | 216 | |
| Silt | 360 | ||
| Clay | 424 | ||
| Soil texture | Clay | ||
| Field capacity | cm3 cm-3 | 0.32 | |
| Permanent wilting point | cm3 cm-3 | 0.07 | |
| Bulk density | Mcg.M-3 | 1.31 |
Table text extracted from the original PDF; superscript letters are shown inline. The original table image is below.
View original table image
| S. | Measured traits | Emitter type | — | Calculated T value | P value |
|---|---|---|---|---|---|
| Nano | T-tape | ||||
| 1. | Coefficient of variation (%) C.V | 0.0588 | 0.0724 | 2.36 | 0.0566 |
| 2. | Stipple discharge variance (%) q var | 0.012 | 0.017 | 0.87 | 0.4198 |
| 3. | Water addition efficiency (%) EU | 98.14 | 97.73 | 0.71 | 0.5043 |
| 4. | Field emission uniformity (%) FEU | 99.56 | 98.84 | 0.75 | 0.4833 |
| 5. | Absolute field emission uniformity (%) FEUa | 99.40 | 99.14 | 0.45 | 0.6683 |
Table text extracted from the original PDF; superscript letters are shown inline. The original table image is below.
View original table image
| Emitter efficiency | Factorial coefficient of variation CV% |
|---|---|
| Excellent | CV < 0.05 |
| Middle | 0.07 > CV > 0.05 |
| Below average | 0.11 > CV > 0.07 |
| Poor | 0.15 > CV > 0.11 |
| Unacceptable | CV > 0.15 |
Table text extracted from the original PDF; superscript letters are shown inline. The original table image is below.
View original table image
| Value | Value of F.EU | Value of F.EUa |
|---|---|---|
| Excellent | More than 90% | 94-100% |
| Very good | 80-90% | 81-87% |
| Good | 70-80% | 68-75% |
| Acceptable | Less than 70% | 56-62% |
Table text extracted from the original PDF; superscript letters are shown inline. The original table image is below.
View original table image
| Tube type | Studied attributes | — |
|---|---|---|
| Yield (tons.ha-1) | Water use efficiency (kg m-3) | |
| T-Tape | 26.831a | 18.875a |
| nano | 22.881b | 14.414b |
Table text extracted from the original PDF; superscript letters are shown inline. The original table image is below.
View original table image
| Exhaustion | Studied attributes | — |
|---|---|---|
| Yield (tons.ha-1) | Water use efficiency (kg m-3) | |
| 35% | 28.998a | 19.294a |
| 55% | 20.713b | 13.995b |
Table text extracted from the original PDF; superscript letters are shown inline. The original table image is below.
View original table image
References
14 in the original paper- Fouda TA, Elmaetwalli, Ali E. Response of potato to nitrogen and water deficit under sprinkler irrigation. Scientific papers Series Management, Economic Engineering in Agriculture and Rural Development. 2012;12(1):77-82.
- Afrous A, Pour M, Ghanad S. Water Use Efficiency (WUE) an Index of optimum water use in Agriculture (Case Study: Southwest of Iran, Dezful). ABR. 2014;5(2):201-202.
- Al-Shamari MF, Alkhateb BAAH, Mahmoud SAW. Role of compost and irrigation water quantity on some physical properties of soil under surface, subsurface drip irrigation. The Iraqi Journal of Agricultural Science. 2020;51(5):1300-1307.
- Wahba SA, Abdal Rahman SI, Tayel MY, Matyn MA. Soil moisture, salinity water use efficiency and sunflower growth as influenced by irrigation, bitumen mulch and plant density. Soil Tech. 2018;3(1):33-44.
- Parthyush K, Suman MC. Design of embedded system for the automation of drip irrigation. International Journal of Application or Innovation in Engineering of Management (IJAIEM). 2012;1(2):254-258.
- Usmanov M, Gregoretti F. Design and implementation of a LoRa based wireless control for drip irrigation system. In: 2017 2 nd . International Conference on Robotics and Automation Engineering (ICRAE). IEEE; c2017. p. 248-253.
- Ozekici BA, Bozkurt S. Determination of hydraulic performances of in-line emitters. Journal of Agriculture and Forestry, Turkey. 1999;23(7):19-24.
- Spreer W, Nagle M, Neidhart S, Carle R, Ongprasert S, Muller J. Effect of regulated deficit irrigation and partial root zone drying on the quality of mango fruits. Agricultural Water Management. 2007;88(1-3):173180.
- Yuan BZ, Nishiyama S, Kang Y. Effects of different irrigation regimes on growth and yield potato. Agric Water Manag. 2003;63(31):153-167.
- Tahir HT, Ameen NH. A comparative study of two types of emitters and two levels of irrigation water pressure and their effect on two varieties of pepper under drip irrigation system. Plant Archives. 2019;19(2):4165-4170.
- Tahir HT, Wahab ASA, Ameen NH. Performance study of emitter materials types on cucumber cultivars under drip irrigation system. AIP Conference Proceedings. 2020;2235(1):020024.
- Al-Bajari MA, Tahir HT, Abdullah AAA. A comparative Study between the Performance of Emitters Types, Operating Pressure Levels, and Response of Two Classes of Cucumber under Drip Irrigation System. In: 9 th International Conference on Agriculture and Environmental Sciences (CAES-2023);
- Hassan MK, Tahir HT, Almuhamade OHM. Effect of Water pressure in drip irrigation and potato cultivars (Solanum tuberosum L.) in growth, yield and quality under fall season conditions in Kirkuk Governorate. Journal of Kirkuk University of Agricultural Sciences. 2017;8(5):87-89.
- Ghazal EM, Esmaeel EJ. Simulation of moisture distribution in soil under drip irrigation with different degree water salinity by using HYDRUS-2D. Diyala Journal of Engineering Sciences. 2017;10(4):42-58.