
Research article · 2024 · Full text
International Journal of Agriculture Extension and Social DevelopmentConsumption pattern of oil palm and non-oil palm cultivating farmer families: A comparative study
Volume 7(5) · Pages 01–05 · DOI: 10.33545/26180723.2024.v7.i5a.591 ↗
Research areasOil Palm Production and SustainabilityLivestock Farming and Management
Abstract
Author-writtenOil palm provides around 40% of all traded vegetable oil and was one of the most significant oil crop in the world. Over three billion people especially in Asia regularly eat palm oil as essential dietary ingredients. Palm oil also have a variety of significant non-food applications like in cleaning and sanitizing goods. In this study, a total 90 sample size was selected, of which 30 each were newly established oil palm plantation, well-established oil palm plantation and non-oil palm farmers especially paddy respectively. The dietary intake was calculated using 24 hour recall method. Statistical analysis was carried out to compare the nutrient intake difference between three set of farmers. The results showed that well-established oil palm farmer’s nutrient intake was higher than newly established oil palm and paddy farmers. For energy, protein, fat, carbohydrate, thiamine, riboflavin, niacin, iron, calcium, zinc, copper, phosphorous and vitamin A have showed significant difference at 0.05 level. Vitamin c did not show any significant statistical difference.
Summary
Source-checkedPlain-language reading of the full paper, prepared with AI and checked against the text. Each point links to the authors' own words.
Why it matters
- Oil palm is a globally significant crop, accounting for approximately 40% of all traded vegetable oil. View evidence ↗
- India is a major consumer and importer of palm oil, with demand projected to double by 2030. View evidence ↗
- A population's nutritional status is heavily influenced by food availability and the purchasing power of individuals. View evidence ↗
The question
- The study aimed to compare the nutrient intake differences among three groups of farmers: newly established oil palm, well-established oil palm, and non-oil palm (paddy) farmers. View evidence ↗
What they did
- Daily food intake data was collected using a pre-structured questionnaire and the 24-hour recall method. View evidence ↗
- The researchers measured the daily consumption of energy, macronutrients (protein, fat, carbohydrates), and various vitamins and minerals. View evidence ↗
What they found
- Well-established oil palm farmers had the highest average daily energy consumption (2526.48±258.50 Kcal), followed by newly established oil palm farmers (2347.21±206.33 Kcal) and paddy farmers (2039.68±150.01 Kcal). View evidence ↗
- Protein consumption relative to RDA was highest in well-established oil palm farmers (107.32%), followed by newly established oil palm farmers (103.32%) and paddy farmers (94.25%). View evidence ↗
- Daily fat consumption was highest among well-established oil palm farmers (39.16±9.28 g) and lowest among paddy farmers (31.50±5.17 g). View evidence ↗
- Vitamin A intake was highest in well-established oil palm farmers (829.82±234.06 µg) compared to newly established (762.55±225.96 µg) and paddy farmers (689.68±188.56 µg). View evidence ↗
- Mineral adequacy was lowest in paddy farmers, who received only 57.14% of iron, 54.05% of zinc, and 35.06% of copper RDA. View evidence ↗
- Unlike most other nutrients, Vitamin C intake did not show a statistically significant difference between the three farmer groups. View evidence ↗
- All groups showed deficiencies in vitamins, most notably water-soluble B complex vitamins (50.0% to 69.0% deficit). View evidence ↗
What it means
- The authors conclude that oil palm cultivation is more profitable than paddy farming, and this higher income allows farmers to access a more diverse and nutrient-rich diet. View evidence ↗
- The authors state that the general deficiency in vitamins and minerals across all groups indicates a rice-centric diet lacking in nutrient diversity. View evidence ↗
Visual summary
3 visualsIllustrations explain the paper; charts are replotted from the paper's own table values.
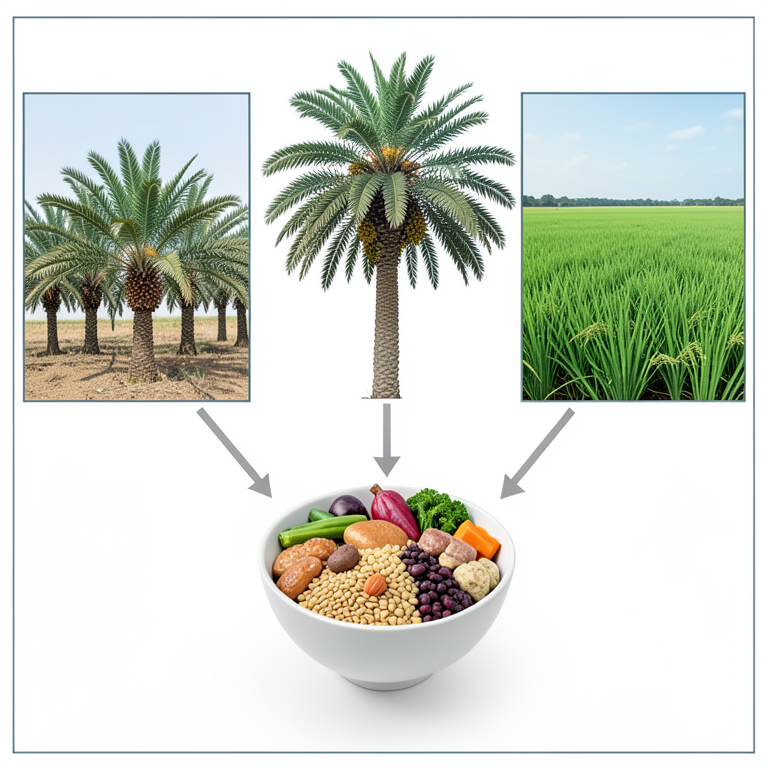
Study Group Structure
AI-generated conceptual illustration (Oil palm trees and paddy rice fields). It explains the idea and does not show study data.
View source evidence ↗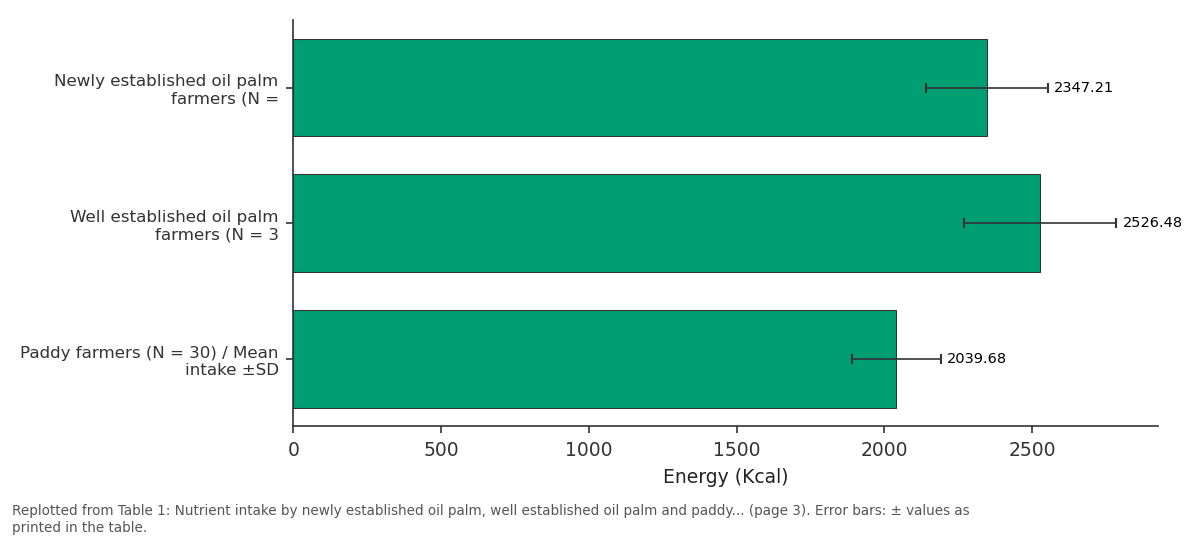
Energy (Kcal): Newly established oil... vs Well established oil... vs Paddy farmers (N = 30)...
Replotted from Table 1 (page 3) of the original paper. Every bar is the paper's own table value.
View source evidence ↗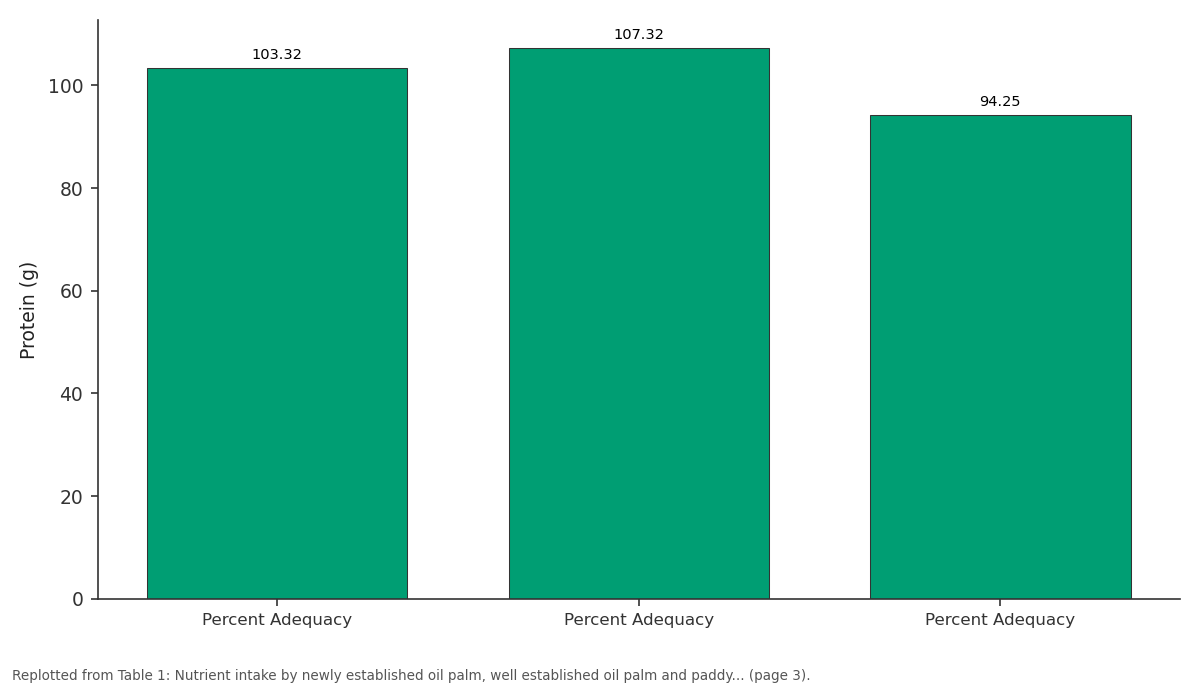
Protein (g): Percent Adequacy vs Percent Adequacy vs Percent Adequacy
Replotted from Table 1 (page 3) of the original paper. Every bar is the paper's own table value.
View source evidence ↗Figures & tables
From the original paper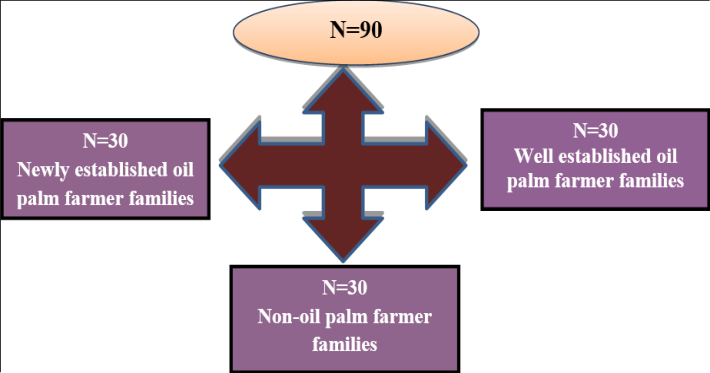 Figure 1
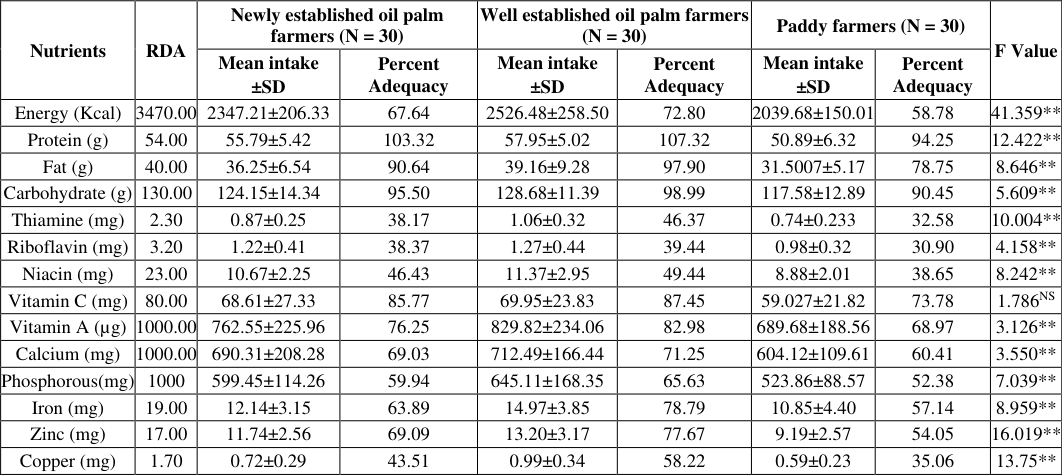 Table 1
 Table 2
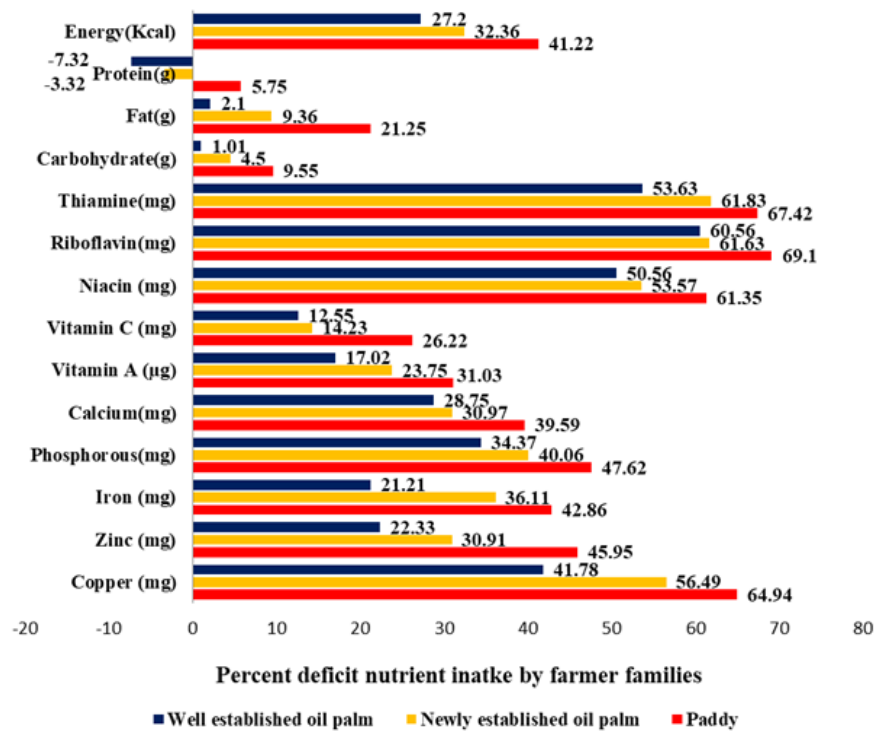 Figure 2
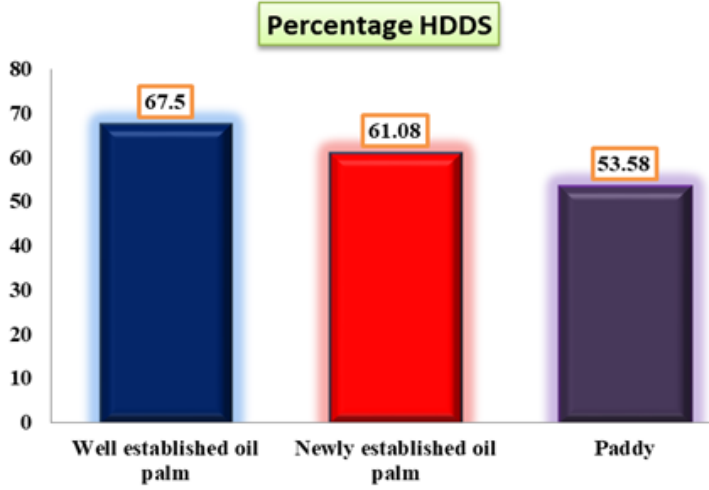 Figure 3
Introduction
The African oil palm, Elaeis guineensis, a native of West Africa was arguably the most significant palm species for agriculture. From 7000 years, ancient cultures depended on the year-round availability of oil palm fruits as a source of semi-wild food. The oil palm plant was very important to local population and for biodiversity in general in these regions (Reddy et al., 2019) [11] . Oil palm has an extraordinarily small land footprint with more than 25-year life cycle compared to other oil seeds crops. Around 19.0 million hectares of oil palm crops produced 81.0 million tonnes of oil per annum globally (Murphy et al., 2021) [8] . India is one of the largest consumer and importer of palm oil in the world with its demand expected to double by 2030 (Sagar et al., 2019) [12] . Oil palm cultivation is extensively encouraged in Andhra Pradesh and Telangana states. In fresh fruit bunches and crude palm oil production, Telangana ranks first in India. These states together contributed 96.0% of produce in India (Reddy, 2022) [10] . The essential part of nutritional care for an individual was the assessment of their nutritional status. It related to population's present physical condition to their level of nutrient consumption and utilization. When the supply of nutrients satisfied individual nutritional demands, optimal nutritional status was achieved. When there was sufficient quantity of food and a person was able to choose, obtain, eat and use foods that satisfied their nutritional demands, the individual will have good nutrition status (Gladys et al., 2016) [4] . Nutritional status of the population largely depended on the consumption of food to their needs which in turn were influenced by the availability of food and purchasing power. The socio-economic conditions like agriculture pattern and occupational profile were different that were determined by the ecosystem they live in (Rao and Rao, 1994) [9] . The quality of life was influenced by nutrient consumption and a variety of life domains including social relationships, personal satisfaction, economics and psychological health (Carson et al., 2014) [2] . The quality of life was a concept, which varied for children, adolescents and adults. According to the WHO, quality of life was an individual's perception of one's position in everyday life according to the culture and value system in which they lived and in relation to their goals, hopes, wants and concerns (Freire et al., 2016) [3] .
Methodology
The present study was carried out through Krishi Vigyan Kendra, Wyra at Khammam district of Telangana state with oil palm and non-oil palm cultivating farmers. A total of 90 sample size were taken with oil palm cultivating families numbering 60 sample size of which 30 each were newly established oil palm and well-established oil palm plantations and another sample size of 30 was for non-oil www.extensionjournal.com palm growing farmers families especially paddy cultivation. Random sampling technique was used. The information regarding daily food intake was obtained using 24 hours recall method with pre-structured questionnaire. The information on amount of raw ingredients used for each preparation and also on the total cooked amount of each preparation was recorded using standardized tools (Thimmayamma et al., 2009) [14] . The average raw ingredient in all the meals consumed by each family per day was calculated and percentage adequacy was determined as given below.
Intake of each nutrient % adequacy =
x 100 Recommended allowances The quantity of foods consumed per day was used to calculate for energy, protein, fat, carbohydrates, thiamine, riboflavin, niacin, vitamin c, calcium, iron, zinc, copper, phosphorous and vitamin A (Longvah et al., 2017). These figures were compared against the recommended dietary allowances to provide a measure of adequacy of food and nutrient consumption.
Results and Discussion
The result, in Table 1 showed that average energy consumption per day of well-established oil palm farmers was 2526.48±258.50 Kcal, followed by newly established oil palm farmers was 2347.21±206.33 Kcal and in paddy farmers, it was 2039.68±150.01 Kcal respectively. Nearly 72.80% of energy requirement was met by well-established oil palm farmers, followed by newly established oil palm farmers with 67.64% and 58.78% by paddy farmers. Energy consumption showed statistically significant difference at 5% level between the three set of farmers. The average protein consumption per day of wellestablished oil palm farmers was 57.95±5.02 g, followed by newly established oil palm farmers with 55.79±5.42 g and paddy farmers with 50.89±6.32 g. It was observed that wellestablished oil palm and newly established oil palm consumed more than recommended RDA. About 107.32% of proteins were consumed by well-established oil palm farmers, followed by 103.32% were consumed by newly established oil palm farmers and 94.25% were consumed by paddy farmers. For protein consumption, there was statistically significant difference at 5% level between the farmers. Their diets contained adequate amount of protein rich food like egg, meat, dairy products, legumes and nuts among well-established and newly established farmers due to awareness on nutrient requirement. The fat consumption of well-established oil palm farmers was 39.16±9.28 g, followed by newly established oil palm farmers with 36.25±6.54 g and paddy farmers with 31.50±5.17 g per day. About 97.90% of fat was consumed by well-established oil palm farmers, followed by newly established oil palm farmers with 90.64 and 78.75% by paddy farmers. The fat consumption showed statistically significant difference at 5% level between farmer groups. Fat consumptions was met by eating almonds, cashews, peanuts, dairy products, deep fried foods along with many Indian gravies and sauces made with base of onions, tomatoes and various spices cooked in oil that contributed the overall fat content. The carbohydrate consumption was 128.68±11.39, 124.15±14.34 and 117.58±12.89 g for well-established oil palm, newly established oil palm and paddy families respectively. The carbohydrate consumption was 98.99, 95.50 and 90.45% in these three sets of farmers with significant statistical difference at 5% level between them. As Indian diet was cereal based, most of the carbohydrate consumption was met by consuming polished rice. The average vitamin consumption per day for wellestablished oil palm, newly established oil palm and paddy was 1.06±0.32, 0.87±0.25 and 0.74±0.23 mg thiamin, 1.27±0.44, 1.22±0.41 and 0.98±0.32 mg riboflavin and 11.37±2.95, 10.67±2.25 and 8.88±2.01mg niacin. The wellestablished oil palm farmers consumed 46.37% of thiamine, 39.44% of riboflavin and 49.44% of niacin, whereas newly established oil palm farmers consumed 38.17% of thiamine, 38.37% of riboflavin and 46.43% of niacin and paddy farmers consumed 32.58% of thiamine, 30.90% of riboflavin and 38.65% of niacin respectively. The thiamine, riboflavin and niacin consumption showed significant statistical difference at 5% level although the diets were deficient in thiamine required for energy conversion. Farming families mostly relied on staple foods such as rice, www.extensionjournal.com wheat or maize which did not provide sufficient amount of these micronutrients. The processing and cooking methods had also affected the availability of these micronutrients in foods. The vitamin C consumption per day for well-established oil palm, newly established oil palm and paddy farmers were 69.95±23.83, 68.61±27.33 and 59.027±21.82 mg per day. The diet provided only 87.45, 85.77 and 73.78% to these farmers with no significant statistical difference. Vitamin C requirement was met by mostly intake of fruits such as guava and papaya which was grown by them. The average vitamin A consumption per day for wellestablished oil palm, newly established oil palm and paddy farmers were 829.82±234.06, 762.55±225.96 and 689.68±188.56 µg in a day respectively. The diet provided only 82.98, 76.25 and 68.97% to these farmers with significant statistical difference at 5% level. The consumption of vitamin A were almost met by the farmers as their diets were rich in leafy vegetables, tomato, dairy products, papaya, carrots, etc. The calcium and phosphorous consumption for wellestablished oil palm 712.49±166.44 mg and 645.11±168.35 mg, in newly established oil palm farmers was 690.31±208.28 mg and 599.45±114.26 mg, whereas paddy farmers were 604.12±109.61 mg and 523.86±88.57 mg respectively. The well-established oil palm, newly established oil palm and paddy consumed 71.25, 69.03 and 60.41% of calcium, 65.63, 59.94 and 52.38% of phosphorous respectively. The calcium and phosphorous consumption showed significant difference at 5% level. The calcium and phosphorous ratio which is 1:1 was nearly met (Koletzko et al., 2005) [6] . Theoretically, low calcium to phosphorus ratio has a negative impact on calcium and phosphorous homeostasis and increased risk of osteoporosis and bone fractures as age progressed (Kemi et al., 2006) [5] . The iron, zinc and copper consumption per day for wellestablished oil palm, newly established oil palm and paddy farmers were 14.97±3.85, 12.14±3.15 and 10.85±4.4 mg of iron, 13.20±3.17, 11.74±2.56 and 9.19±2.57 mg of zinc and 0.99±0.34, 0.72±0.29 and 0.59±0.23 mg of copper respectively. The diet provided 78.79, 63.89 and 57.14% of iron, 77.67, 69.03 and 54.05% of zinc and 58.22, 43.51 and 35.06% of copper to these three sets of farmers. The iron, zinc and copper consumption showed significant statistical difference at 5% level. Both low and high intake of any of these micronutrients may influence the utilization and metabolism of remaining micronutrients. A diet low in copper hindered the liver's ability to mobilize iron stores, whereas a diet high in copper blocked the intestinal absorption of iron and zinc. An overabundance of iron might irritate the intestinal mucosa's copper and zinc absorption. The excess zinc intake diminished copper's bioavailability, which negatively affected iron balance. Zinc insufficiency slowed down the rate of protein synthesis, which might affect blood transport of these elements among other things (Brzozowska, 1989) [1] . The diets were not deficient in protein, fat and carbohydrates due to eating of rice as stable diet, protein from rice muting the protein RDA and cooking practices providing required fat RDA. But, the diets were deficient in water soluble B complex vitamin by 50.0 to 69.0%, vitamin C by 12.0 to 26.0% and vitamin A by 17.0 to 31.0%. In comparison, the minerals were deficit by 28.0 to 64.0% with highest deficiency of copper which can affect the hemoglobin formation and its absorption from intestines.
| Nutrients | RDA | Newly established oil palm farmers (N = 30) | — | Well established oil palm farmers (N = 30) | — | Paddy farmers (N = 30) | — | F Value |
|---|---|---|---|---|---|---|---|---|
| Mean intake ±SD | Percent Adequacy | Mean intake ±SD | Percent Adequacy | Mean intake ±SD | Percent Adequacy | |||
| Energy (Kcal) | 3470.00 | 2347.21±206.33 | 67.64 | 2526.48±258.50 | 72.80 | 2039.68±150.01 | 58.78 | 41.359** |
| Protein (g) | 54.00 | 55.79±5.42 | 103.32 | 57.95±5.02 | 107.32 | 50.89±6.32 | 94.25 | 12.422** |
| Fat (g) | 40.00 | 36.25±6.54 | 90.64 | 39.16±9.28 | 97.90 | 31.5007±5.17 | 78.75 | 8.646** |
| Carbohydrate (g) | 130.00 | 124.15±14.34 | 95.50 | 128.68±11.39 | 98.99 | 117.58±12.89 | 90.45 | 5.609** |
| Thiamine (mg) | 2.30 | 0.87±0.25 | 38.17 | 1.06±0.32 | 46.37 | 0.74±0.233 | 32.58 | 10.004** |
| Riboflavin (mg) | 3.20 | 1.22±0.41 | 38.37 | 1.27±0.44 | 39.44 | 0.98±0.32 | 30.90 | 4.158** |
| Niacin (mg) | 23.00 | 10.67±2.25 | 46.43 | 11.37±2.95 | 49.44 | 8.88±2.01 | 38.65 | 8.242** |
| Vitamin C (mg) | 80.00 | 68.61±27.33 | 85.77 | 69.95±23.83 | 87.45 | 59.027±21.82 | 73.78 | 1.786NS |
| Vitamin A (µg) | 1000.00 | 762.55±225.96 | 76.25 | 829.82±234.06 | 82.98 | 689.68±188.56 | 68.97 | 3.126** |
| Calcium (mg) | 1000.00 | 690.31±208.28 | 69.03 | 712.49±166.44 | 71.25 | 604.12±109.61 | 60.41 | 3.550** |
| Phosphorous(mg) | 1000 | 599.45±114.26 | 59.94 | 645.11±168.35 | 65.63 | 523.86±88.57 | 52.38 | 7.039** |
| Iron (mg) | 19.00 | 12.14±3.15 | 63.89 | 14.97±3.85 | 78.79 | 10.85±4.40 | 57.14 | 8.959** |
| Zinc (mg) | 17.00 | 11.74±2.56 | 69.09 | 13.20±3.17 | 77.67 | 9.19±2.57 | 54.05 | 16.019** |
| Copper (mg) | 1.70 | 0.72±0.29 | 43.51 | 0.99±0.34 | 58.22 | 0.59±0.23 | 35.06 | 13.75** |
Table text extracted from the original PDF; superscript letters are shown inline. The original table image is below.
View original table image
Household dietary diversity score (DDS): Dietary diversity score was calculated by using a set of 12 food groups (Swindale and Bilinsky 2006) [13] . The food group consumed by the respondents during the previous 24-hour period was scored '1' and the food not consumed was given score '0'. The mean dietary diversity score of the well-established oil palm, newly established oil palm and paddy farmers was 8.10±1.15, 7.33±0.96 and 6.43±0.97 out of 12 and it showed statistically significant difference at 5% level as shown in Table 2. Well-established oil palm farmers had high level of nutritional awareness, showing a greater emphasis on consuming a diverse and balanced diet. The size and composition of households affected dietary diversity scores. The larger household may have more dietary diversity as various family members have different food preferences. The increased financial stability enabled them to afford a wider variety of food groups such as fruits, vegetables, protein and other nutrient rich foods leading to higher dietary diversity score. The newly established oil palm farmers had 61.08% of score whereas paddy farmers had 53.58% indicating lower inclusion of various food groups.
Conclusion
The study showed that well established oil palm plantation farmers consumed foods providing higher energy, protein, fat, thiamine, riboflavin, niacin, vitamin c, calcium and iron compared to newly established oil palm and paddy farmers. The diets were deficient in vitamins and minerals in all three groups indicate of being rice centric and lack of nutrient diversity. Nutrient intake was influenced by numerous variables such as dietary habits, access to diverse foods, socio-economic status and geographical location. Oil palm cultivation was more profitable than paddy growing leading to higher income levels as the income levels increased, the farmers had better variety of nutrient-rich foods and dietary variation.
Figures and tables from the paper
References
11 in the original paper- Brzozowska A. Interaction of iron, zinc and copper in the body of animals and humans. Ann Natl Inst Hyg. 1989;40(4-6):302-312.
- Carson TL, Hidalgo B, Affuso O. Dietary interventions and quality of life: A systematic review of the literature. J Nutr Educ Behav. 2014;46:90-101.
- Freire T, Ferreira G. Health related quality of life of adolescents: Relations with positive and negative psychological dimensions. J Adolesc Youth. 2016;23:11-24.
- Gladys AA, Cynthia AM, Jovita NOA. Nutritional assessment of rural farmers in Imo state, Nigeria: Implication for health and well-being. Int J Adv Acad Res. 2016;2(4):7-18.
- Kemi VE, Karkkainen MU, Lamberg ACJ. High phosphorus intakes acutely and negatively affect Ca and bone metabolism in a dose-dependent manner in healthy young females. Br J Nutr. 2006;96:545-552.
- Koletzko B, Baker S, Cleghorn G, Neto UF, Gopalan S, Hernall O. Global standard for the composition of infant formula: recommendations of an ESPGHAN coordinated international expert group. J Pediatr Gastroenterol Nutr. 2005;41:584-599.
- Murphy D, Goggin K, Paterson RR. Oil palm in the 2020s and beyond: challenges and solutions. Centre for Agriculture and Bioscience International. 2021;2(39):122.
- Rao DH, Rao KM. Levels of malnutrition and socioeconomic conditions among Maria gonds. J Hum Ecol. 1994;5:185-190.
- Reddy IVS. Status and need of mechanization of oil palm harvesting in Telangana. Agric Mech Asia Afr Latin Am. 2022;53(4):7389-7394.
- Reddy MT, Kalpana M, Sivaraj N, Kamala V, Pandravada SR, Sunil N. Indigenous traditional knowledge on health and equitable benefits of oil palm (Elaeis spp.). Open Access Libr J. 2019;6(01):1-25.
- Sagar HSSC, Mabano A, Roopa R, Sharmin M, Richard FJ, Clause J. India in the oil palm era: Describing India's dependence on palm oil, recommendations for sustainable production and opportunities to become an influential consumer. Trop Conserv Sci. 2019;12:1-9.