
Research article · 2024 · Full text
International Journal of Geography Geology and EnvironmentEvaluation of dustfall rates on Najaf and its temporal and spatial variations
Volume 6(1) · Pages 351–355 · DOI: 10.22271/27067483.2024.v6.i1e.239 ↗
Research areasAeolian processes and effectsAtmospheric aerosols and cloudsWind and Air Flow Studies
Abstract
Author-writtenThe increasing problem of air pollution, along with the problem of lack of rainfall, the increase in the area of the dry and decertified area, and the fragmentation of soil, contribute greatly to increasing concern about the environmental damage resulting from these problems. This study aims examine dustfall in four sites from Najaf province for eleven months, starting in February and ending in December 2021. The direct traditional method using aluminium-collector plate was used to collect falling dust. The results of quantitative analysis of falling dust rates showed that falling dust rates for the study sites during the study period ranged between (110.14 - 1952.95) mg/m2/day. The dustfall rate values exceeded the permissible limits set by Australian and Malaysian standards in all the study areas throughout the study period, except two data points. The results also showed a spatial and temporal change in the values of falling dust rates. Falling dust rates indicate the presence of processes or activities that emit high levels of dust. Therefore, these operations or activities should be identified and stopped, and legal action should be taken to prevent these activities from occurring.
Summary
Source-checkedPlain-language reading of the full paper, prepared with AI and checked against the text. Each point links to the authors' own words.
Why it matters
- Environmental damage in the region is driven by air pollution, lack of rainfall, soil fragmentation, and the expansion of dry, desertified areas. View evidence ↗
- Dust negatively impacts plant growth by clogging pores and reducing photosynthesis. View evidence ↗
- There is a lack of basic data regarding the spatial and temporal characteristics of dust changes in many cities. View evidence ↗
The question
- The study aims to assess monthly and spatial variations in dustfall rates and their potential dangers in Najaf from February 2021 to January 2022. View evidence ↗
What they did
- Dustfall samples were collected using aluminium metal bottles with a diameter equal to one-third of their height. View evidence ↗
- Four collection sites were established: Aden District (Industrial), Kufa (Commercial), Manathira (Residential), and Najaf (Residential). View evidence ↗
- Collection bottles were installed 1.5 meters above the floor and replaced monthly. View evidence ↗
- One-way ANOVA was used to determine if there were statistically significant differences between the collected data groups. View evidence ↗
What they found
- Dustfall rates across the study sites ranged from 110.14 to 1952.95 mg/m²/day. View evidence ↗
- The lowest average dustfall rate was found at the Aden district station (482.97 mg/m²/day), and the highest was at the Najaf Residential station (612.56 mg/m²/day). View evidence ↗
- Temporal analysis showed the highest average dustfall in May (829.9 mg/m²/day) and the lowest in November (281.7 mg/m²/day). View evidence ↗
- Dustfall rates exceeded British, Australian, and Malaysian permissible limits in almost all months and stations. View evidence ↗
- Rates exceeded American specifications in at least half of the stations for all months except February. View evidence ↗
- Kruskal-Wallis tests revealed no statistically significant difference in dustfall rates between the different stations. View evidence ↗
What it means
- The authors conclude that industrial, agricultural, and road-related activities are producing excessive dust and that authorities must intervene to stop these emissions. View evidence ↗
- The authors state that further research is needed to determine the physical and chemical composition of the dust to better estimate potential hazards. View evidence ↗
Visual summary
3 visualsIllustrations explain the paper; charts are replotted from the paper's own table values.
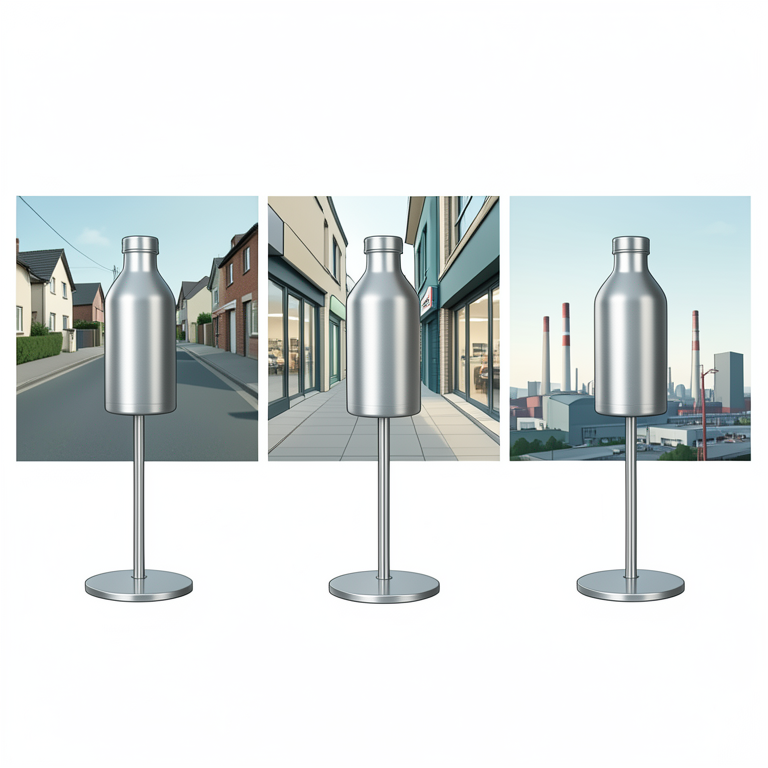
Dust Collection Setup
AI-generated conceptual illustration (metal dust collection bottles on stands in urban environments). It explains the idea and does not show study data.
View source evidence ↗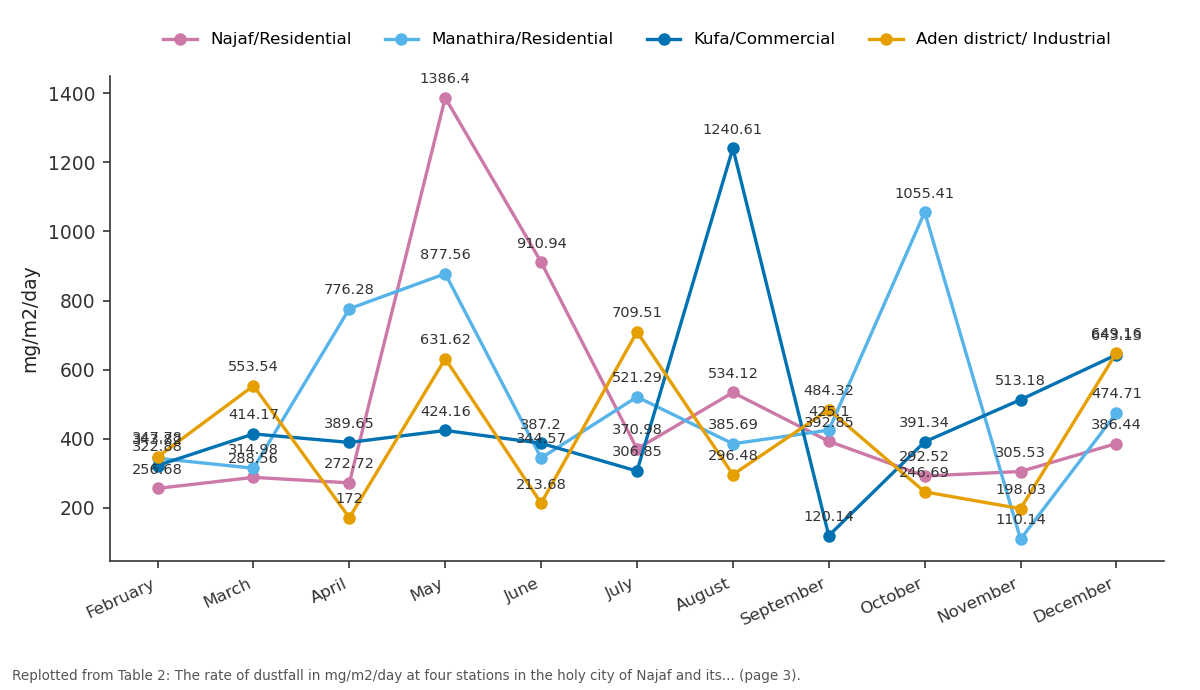
Najaf/Residential and Manathira/Residential and more: February vs March vs April vs May vs June
Replotted from Table 2 (page 3) of the original paper. Every bar is the paper's own table value.
View source evidence ↗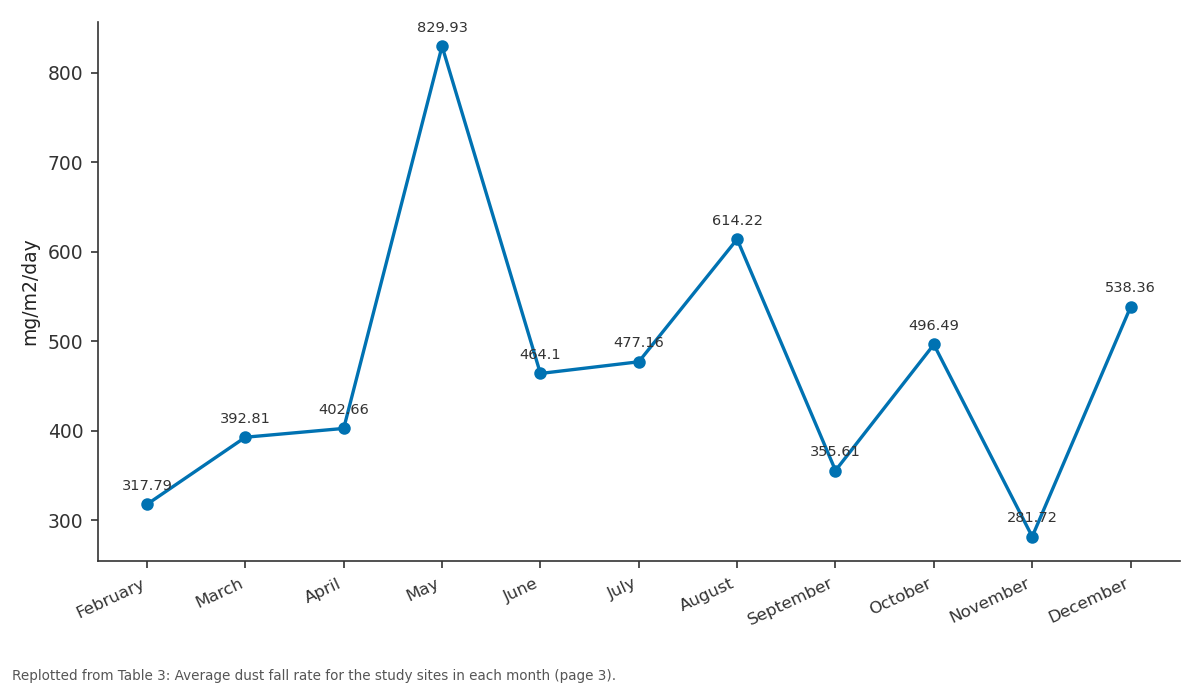
Average rate of dustfall (mg/m2/day): February vs March vs April vs May vs June
Replotted from Table 3 (page 3) of the original paper. Every bar is the paper's own table value.
View source evidence ↗Figures & tables
From the original paper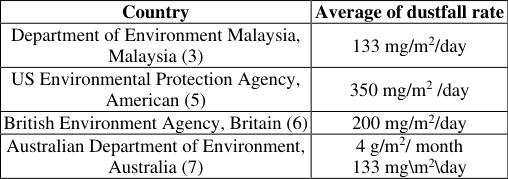 Table 1
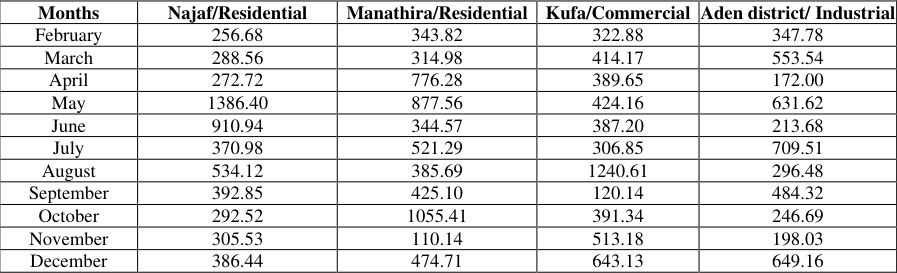 Table 2
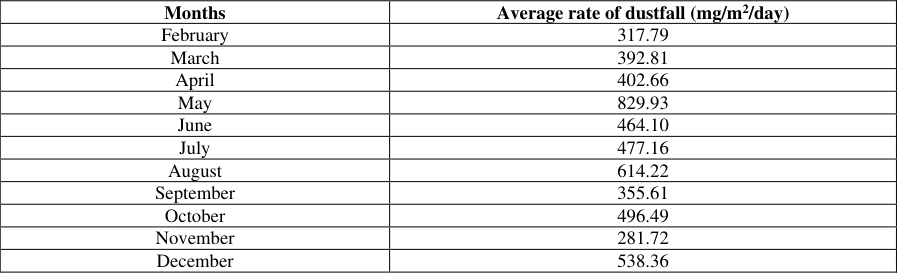 Table 3
 Table 4
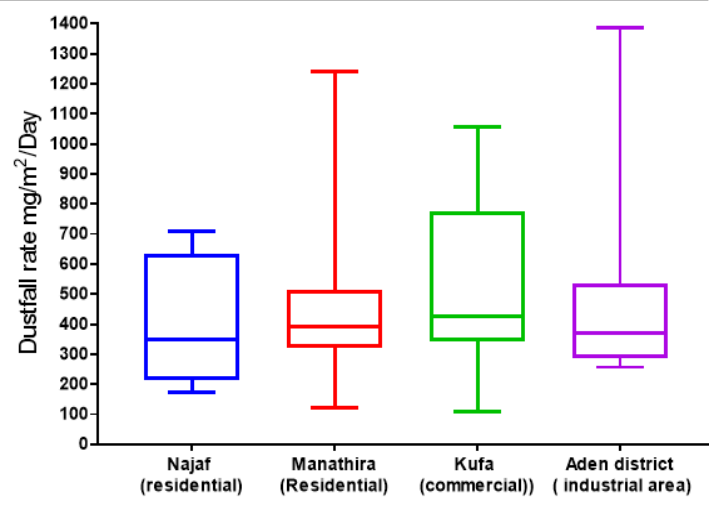 Figure 2
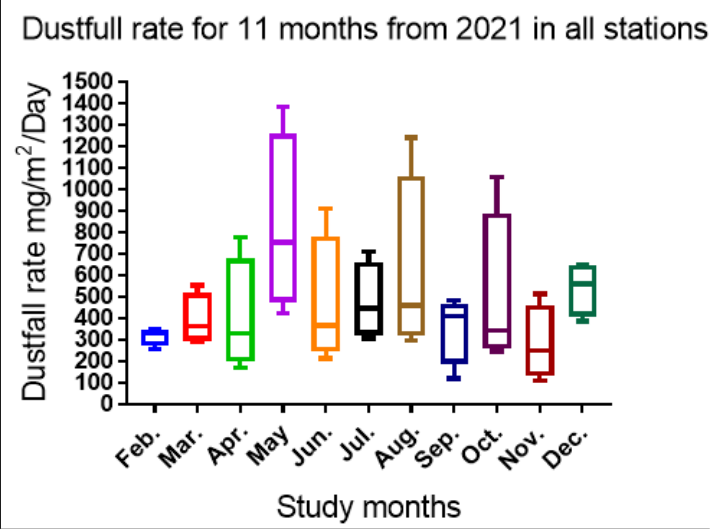 Figure 3
Introduction
The dust is considered as a nuisance when it accumulates and falls, it quickly causes damage to the roof of residential properties or commercial buildings. However, the level at which it becomes a nuisance is very subjective so a nuisance rating may be left up to personal opinions. Experimental data from dustfall quantity measurements are frequently used to assess the level of impact the dust has on the environment [1] . Falling dust in meters allow measuring the average dustfall rate, which can be compared to threshold values. The rate of dustfall is expressed as average milligrams per square meter per day (mg/m 2 /day). The average rate of dust falling varies depending on the characteristics of the area. For example, the average rate of dustfall in the city and residential areas differs from that in commercial centres [2] . Threshold limit values of dust fall are maintained in a number of recommended air quality guidelines. The table below shows the values of some of them. The Plant growth is hampered by dust, and dust clogs pores and reduces photosynthesis activity. While transporting dust, many young plants are lost resulting in decreased productivity. Plant infections also occur due to the palm dust mite pest Oligonychus afrasiaticus Meg and so is Acari Tetranychida, which is a severe pest in North Africa, the Near East, and other date palm regions of the world. The dust mite attacks palm fruits in their early growth stages. Adult and nymph pests suck the sap of immature green date fruit, causing severe scarring, deformation, browning, and peeling of the fruit [13] .
An accurate understanding of the potential risks of dust depends on knowing the type, size, shape and density of dust particles along with wind speed and direction, rainfall, local topography and hydrogeology, which are parameters that can disperse dust emissions. However, in general, large dust particles (larger than 30 µm), which make up the largest proportion of dust emitted by metalwork, will largely settle within 100 meters of the source. Medium-sized particles of 10 to 30 μm are more likely to travel from 200 to 500 m [14] . The importance of the research: In recent decades at the global level, there is much interest in studying the sources of dust, the model of its transportation, its effects on the environment, and its interaction with the problem of climate change. In addition, basic data on the characteristics of spatial and temporal changes are still lacking, not available in all cities.
Aim of the study
The aim of this study is to assess the monthly variation in the dust fall rate and an assessment of the potential dangers of the dust fall rates, in addition to a test of the variation in the rate of dustfall between the studied stations for the period from 2/1/2021 to 1/1/2022.
Methodology
Samples of dustfall were collected at the study sites, using metal bottles made of aluminium with diameters equal to one-third of their heights. This method of collection is followed by both the Iraqi Environmental Protection and Improvement Department and the Meteorology and Seismic Monitoring Authority in estimating the amounts of falling dust and other studies. Other tools can also be used to collect falling dust, if available, for example Frisbee Bottle [15] . Dust collection containers were distributed to four locations (residential, industrial, commercial) as follows: The first location was named (Aden District/Industrial), and it is an industrial area located south of the holy city of Najaf. The second sample collection station was named (Kufa/commercial) station, which is located in the Kufa District, east of the city of Najaf. The third sample collection station was named (Manathira/Residential), located in the Manathira District, which is about twenty kilometers south of the holy city of Najaf. The fourth station, which was named (Najaf/residential), is located in the center of the city of Najaf, which is a residential area. Note that the bottles were installed in the elected school site at a height of 1.5 m above the floor level of each site, and the dust collection bottles were changed at the end of each month. The collected dust is placed in a beaker containing distilled water, which then evaporates the water to ensure that the results are only representative of materials of a mineral nature. The weight of falling dust was calculated by subtracting the weight of the empty container (W1) from the weight of the container after collecting dust (W2), which is its weight after it was placed on site. Thirty days after thawing and fumigation.
Calculating the rate of dustfall
The rate of dustfall is expressed as the average weight of dust falling on an area of one square meter over thirty days. The unit of measurement is gram square/ meter/thirty days. The rate of dust falling at the end of each month was calculated according to the following steps: 1. Calculate the weight of dustfall collected in each sample collection container during a month at each study site 2. Weight of dustfall = W2-W1 3. The rate of dustfall is gm \m2 per month = (weight of dust in the container / area of the base of the container in square metres) 4. Calculating the area of the collection container (cm 2 ) = radius squared * π.
Statistical Analysis
The data represent in the form of a box, which shows the distribution and spread of data, and through it is possible to determine whether there is extreme (anomalous) data or that is inconsistent with the main data set. As for the method of drawing the box, it is by specifying the first quartile of the data, which is the value that captures less than 25% of the data, and the third quartile, which is the value that captures less than 75% of the data [16] . ANOVA test is a way to find out whether the data collected are similar or different. In other words, it helps to know whether the null hypothesis should be rejected or an alternative hypothesis should be accepted. Basically, you test different groups to see if there is a difference between them. Use one-way analysis of variance One Way ANOVA determines the number of independent variables in the analysis of variance test, the research is one independent variable.
Results
The falling dust rate was calculated in mg/m 2 /day. In order to compare the collected data with the values of available standards that specify permissible dust levels in air pollution laws, see table 2. The rate of dust falling to the study sites during the study period ranged between 110.14 -1952.95 mg/m 2 /day. The average values of the falling dust rate at the four stations at each month are presented in Table 3. The average dust fall rate was calculated for eleven months in each study site and is presented in Table 4. The lowest average values of the falling dust rate were in station 1 (Aden district), which was 482.97 (mg / m 2 / day), while the highest average values of the falling dust rates were in station 4 (Najaf / Residential), which was 612.56 (mg/m 2 / day) day). The normal distribution test was conducted for the data of the four stations collected during the study period using the D'Agostino & Pearson normality test and also using the Shapiro-Wilk normality test. The results indicated that the distribution of data from the second and fourth stations was not normal, while the distribution of data from the first and third stations was normal.
| Months | Average rate of dustfall (mg/m2/day) |
|---|---|
| February | 317.79 |
| March | 392.81 |
| April | 402.66 |
| May | 829.93 |
| June | 464.10 |
| July | 477.16 |
| August | 614.22 |
| September | 355.61 |
| October | 496.49 |
| November | 281.72 |
| December | 538.36 |
Table text extracted from the original PDF; superscript letters are shown inline. The original table image is below.
View original table image
| Months | Najaf/Residential | Manathira/Residential | Kufa/Commercial | Aden district/ Industrial |
|---|---|---|---|---|
| February | 256.68 | 343.82 | 322.88 | 347.78 |
| March | 288.56 | 314.98 | 414.17 | 553.54 |
| April | 272.72 | 776.28 | 389.65 | 172.00 |
| May | 1386.40 | 877.56 | 424.16 | 631.62 |
| June | 910.94 | 344.57 | 387.20 | 213.68 |
| July | 370.98 | 521.29 | 306.85 | 709.51 |
| August | 534.12 | 385.69 | 1240.61 | 296.48 |
| September | 392.85 | 425.10 | 120.14 | 484.32 |
| October | 292.52 | 1055.41 | 391.34 | 246.69 |
| November | 305.53 | 110.14 | 513.18 | 198.03 |
| December | 386.44 | 474.71 | 643.13 | 649.16 |
Table text extracted from the original PDF; superscript letters are shown inline. The original table image is below.
View original table image
It should be noted here that the results of one-way analysis of variance tests using the Kruskal-Wallis test No presence revealed difference statistically significant between the values of the dust falling rate at the stations. It is noted that the highest values of falling dust rates were recorded in the month of May, where the average was 829.9 (mg/m 2 /day). The lowest values of falling dust rates were in the month of November, when the average was 281.7 (mg/m 2 /day). A test for the normal distribution of falling dust rates was conducted at each month of the study period (based on the absence of statistically significant differences between the four stations) using the Shapiro-Wilk normality test. The results indicated that the distribution of data for all months of the study was normal. Therefore, one-way analysis of variance tests was conducted using Brown-Forsythe test and Turkey's multiple comparisons test. Test results showed no Existence Difference Statistically significant between the values of falling dust rates in the months, see figure 3 rates of dustfall in the months.
It should be noted here that a comparison was made between the permissible limits and the values of the average rates, which was taken as the average of the months for each station of the study, and it was also taken as the average of the values of the dust rates for the four stations for each month. The result is that the values of falling dust rates in all months and at all stations that were studied exceeded the permissible values according to the British, Australian and Malaysian specifications, except for 4 stations, which were not observed in the same months. There was also an increase in falling dust rates above the permissible values according to American specifications in all months (except February) and in at least half of the stations studied. This indicates that there is one or more processes or activities that must be stopped until the dust levels are within the permissible limit.
Discussion
As can be seen from table 2, the values of the rate of dustfall vary in months of the year, this may due to climatic factors such as relative humidity, rainfall, wind speed, and the topography of the region [18] . An increase in relative humidity leads to an increase in the size of dust particles, causing them to settle. In general, relative humidity levels vary depending on the change in outside temperature. Therefore, higher levels of relative humidity in summer than levels in winter may be a factor causing the values of falling dust rates in summer to be higher than those observed in winter in this study [19] .
The dustfall standards permit industrial activity or any activity to add a certain amount of dust to the atmosphere, provided that the resulting atmospheric dustfall on the surfaces of the earth or properties does not exceed the values of the permissible parameters.
It should be noted here that a comparison was made between the permissible limits and the values of the average rates, which was taken as the average of the months for each station of the study, and it was also taken as the average of the values of the dust rates for the four stations for each month. The result is that the values of falling dust rates in all months and at all stations that were studied exceeded the permissible values according to the British, Australian and Malaysian specifications, except for 4 stations, which were not observed in the same months. There was also sand increase in falling dust rates above the permissible values according to American specifications in all months (except February) and in at least half of the stations studied. This indicates that there is one or more processes or activities that must be stopped until the dust levels are within the permissible limit.
As mentioned in the methodology section, the collected dust was mixed with distilled water then heated to remove soluble material. The findings indicate that most of the dust consists of insoluble material, which may include mineral content, such as soil dust. This mineral content may could be attributable to dust-producing activities such as cement, but could also be originated from other sources such as unsealed roads, etc.
Conclusion and Recommendation
There are operations, projects or activities that are responsible for producing dust and should not be allowed to produce a level of dust that exceeds the limits of rate of dustfall, including sources from industries, agriculture, unsealed roads, etc. The authorities must solve the problem of these operations or activities. The study recommends that further studies be conducted to determine the physical properties and chemical composition of baked fines, so that it is possible to estimate the potential dangers, whether to the environment, women, or property.
Future works
After analysing the dustfall rate in four stations in Najaf, several areas for future research have been identified. Further study of the dust properties, such as color, to obtain important information about its origin is needed. Furthermore, identification of the chemical composition of the collected dust is required to assess the hazard.
Figures and tables from the paper
| Country | Average of dustfall rate |
|---|---|
| Department of Environment Malaysia, Malaysia (3) | 133 mg/m2/day |
| US Environmental Protection Agency, American (5) | 350 mg/m2 /day |
| British Environment Agency, Britain (6) | 200 mg/m2/day |
| Australian Department of Environment, Australia (7) | 4 g/m2/ month 133 mg\m2\day |
Table text extracted from the original PDF; superscript letters are shown inline. The original table image is below.
View original table image
References
8 in the original paper- Walton G, Datson H, Wardrop DR. Dust movement from and into quarries. In Proceedings of the 14 th Extractive Industry Geology Conference, EIG Conferences. 2008;109:45-52.
- Dozic A, Selimbasic V, Cipurkovic A, Crnkic A, Hodzic Z, Trumic I. Heavy metals in dust deposition in the vicinity of coal ash disposal site Divkovici II. Journal of Life Sciences. 2014;8(5):461-472.
- Querol X, Pey J, Pandolfi M, Alastuey A, Cusack M, Pérez N, et al. African dust contributions to mean ambient PM10 mass-levels across the Mediterranean Basin. Atmospheric Environment. 2009;43(28):42664277.
- Badarinath KV, Kharol SK, Kaskaoutis DG, Sharma AR, Ramaswamy V, Kambezidis HD. Long-range transport of dust aerosols over the Arabian Sea and Indian region-A case study using satellite data and ground-based measurements. Global and Planetary Change. 2010;72(3):164-181.
- Almuhanna EA. Dustfall associated with dust storms in the Al-Ahsa Oasis of Saudi Arabia. Open Journal of Air Pollution. 2015;4(02):65.
- Owoade OK, Olise FS, Ogundele LT, Fawole OG, Olaniyi HB. Correlation between particulate matter concentrations and meteorological parameters at a site in Ile-Ife, Nigeria. Ife Journal of Science. 2012;14(1):83-93.
- Farsani MH, Shirmardi M, Alavi N, Maleki H, Sorooshian A, Babaei A, et al. Evaluation of the relationship between PM10 concentrations and heavy metals during normal and dusty days in Ahvaz, Iran. Aeolian Research. 2018;33:12-22.
- Alghamdi MA, Almazroui M, Shamy M, Redal MA, Alkhalaf AK, Hussein MA. Characterization and elemental composition of atmospheric aerosol loads during springtime dust storm in western Saudi Arabia. Aerosol and Air Quality Research. 2015;15(2):440-453.