
Research article · 2024 · Full text
International Journal of Research in AgronomyInsect pest management in paddy and sociodemographic profile of agricultural practitioners within the SAS Nagar, India
Volume 7(4S) · Pages 211–219 · DOI: 10.33545/2618060x.2024.v7.i4sc.625 ↗
Research areasInsect-Plant Interactions and ControlAgricultural pest management studiesInsect Pest Control Strategies
Abstract
Author-writtenThe study conducted in five villages of SAS Nagar, Mohali area- Sahauran, Hasanpur, Radiala, Ghataur, Allahpur districts of Punjab, India examines the socio-economic profile of farmers. The aim is to gain insights into the challenges and opportunities in the agricultural sector. The study covers various aspects of farmers lives such as age distribution, education levels, access to technology, family structure, land holdings and sources of information. It emphasizes on insect pest management in paddy fields utilizing a questionnaire and video, farmers comprehension and knowledge retention were assessed before and after video viewing. In Punjab common pests like rice stem borers, rice hispas, brown plant hoppers pose challenges. Farmers employ various practices, including monitoring, biological control agents, training, selective chemical application and timely intervention. Challenges persist, including rising input costs, labour shortages, limited access to pest control products, and climate change impacts. Land holdings vary from less than 1 hectare to over 10 hectares, with most farmers owning between 2 and 10 hectares. Input dealers and co-operative societies are significant sources of information for farmers. Moreover, the availability of essential cards such as Aadhar and ration cards varies among farmers. The results highlight the importance of addressing educational disparities, bridging digital divides, and enhancing access to information for farmers. This would help improve agricultural practices and overall well- being in the region.
Summary
Source-checkedPlain-language reading of the full paper, prepared with AI and checked against the text. Each point links to the authors' own words.
Why it matters
- Agriculture is a fundamental pillar of the Indian economy, supporting the livelihoods of more than half of the population. View evidence ↗
- Rice farming in Punjab is hindered by pest infestations, particularly following floods, which can lead to labor shortages and ineffective pesticide application. View evidence ↗
The question
- The study aims to identify the challenges and opportunities within the agricultural sector by examining the socio-economic profiles of farmers. View evidence ↗
- The researchers specifically focused on evaluating farmers' understanding of insect pest management in paddy fields using instructional videos and questionnaires. View evidence ↗
What they did
- The study was conducted across five villages in the SAS Nagar (Mohali) area of Punjab, India: Sahauran, Hasanpur, Radiala, Ghataur, and Allahpur. View evidence ↗
- Data was collected through interviews and questionnaires administered to a sample of 60 farmers. View evidence ↗
- The researchers used a non-experimental, descriptive research design to characterize the relationships between variables. View evidence ↗
- To measure knowledge retention, farmers were given a questionnaire both before and after watching an instructional video on pest management. View evidence ↗
What they found
- The largest age group among the surveyed farmers was 65-80 years, representing 35% of the respondents. View evidence ↗
- Fathers were the most common heads of household at 43.3%, followed by the farmers themselves (28.3%) and mothers (2%). View evidence ↗
- Regarding land tenure, 41.6% of farmers lease land in, 36.6% own their land, and 23.3% lease land out. View evidence ↗
- Educational levels were generally low, with 25% of farmers being illiterate and only 3% having graduated. View evidence ↗
- The survey found a high prevalence of joint families at 66.6%, compared to 18.3% for nuclear families. View evidence ↗
- The most common information sources were Radio/TV (68.3%) and friends/relatives (41%), while call centers (0.01%) and progressive farmers (0.1%) were rarely used. View evidence ↗
- Livestock management is common, with 65% of farmers utilizing cows and 56.6% utilizing buffaloes. View evidence ↗
- Access to government identification is widespread, with 65% of farmers using Aadhaar cards and 50% using ration cards. View evidence ↗
- The instructional video significantly improved knowledge, with the average correct response rate increasing from 77% before viewing to 86.56% after. View evidence ↗
What it means
- The authors conclude that improving agricultural practices and farmer well-being requires addressing educational gaps, the digital divide, and information access. View evidence ↗
- The authors recommend equipping farmers with pest knowledge to reduce the misuse of pesticides and encourage sustainable, eco-friendly farming. View evidence ↗
Visual summary
2 visualsIllustrations explain the paper; charts are replotted from the paper's own table values.
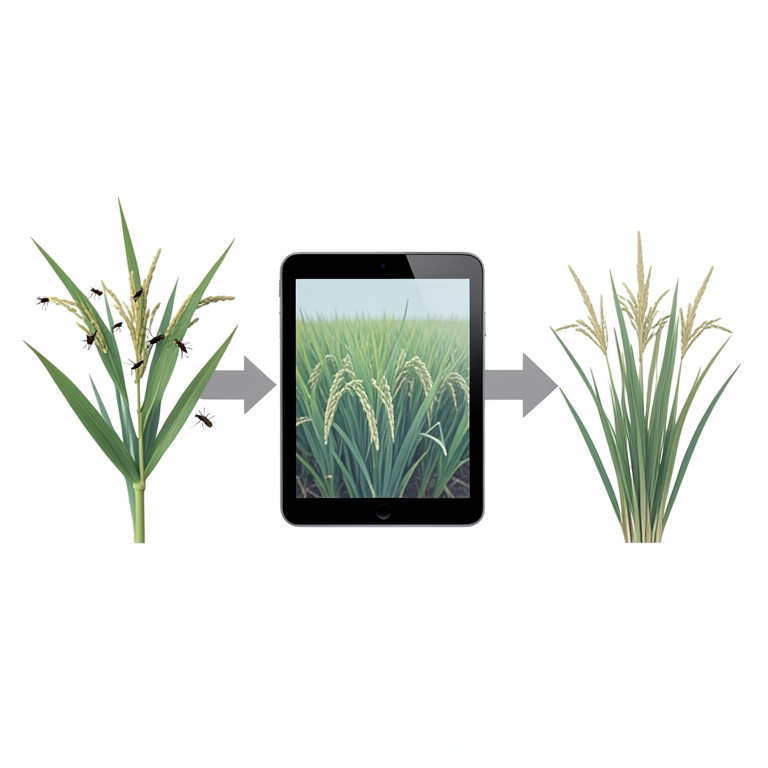
Knowledge Gain from Visual Learning
AI-generated conceptual illustration (paddy rice plants and a digital tablet screen). It explains the idea and does not show study data.
View source evidence ↗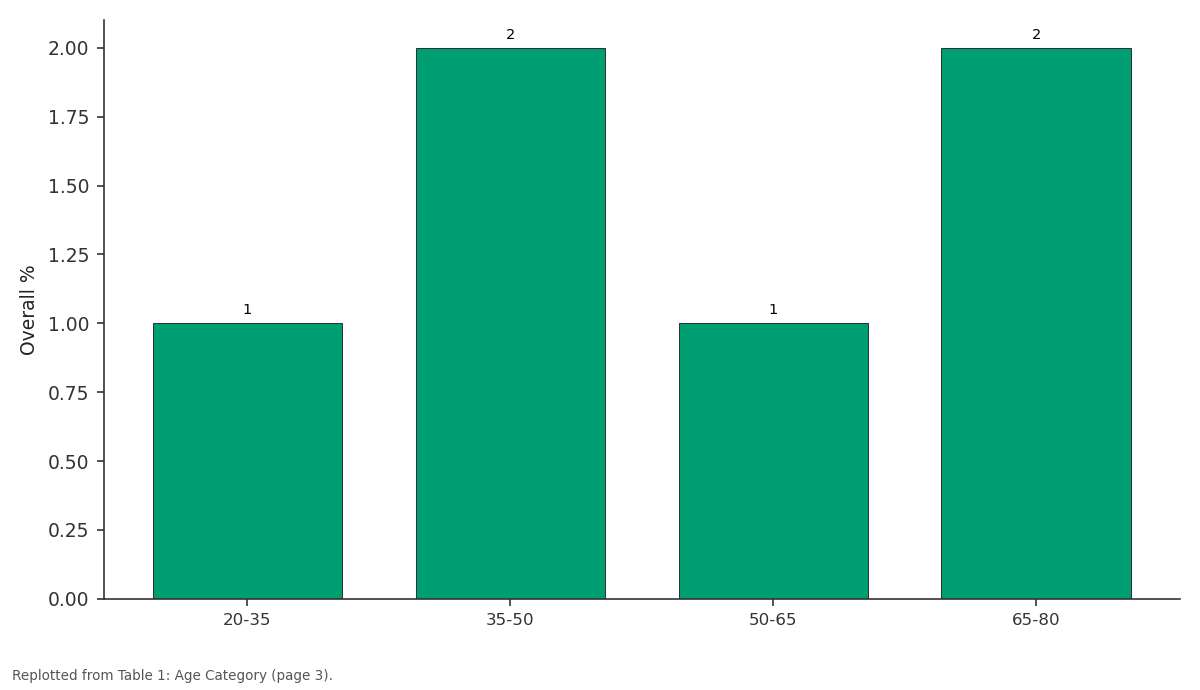
Ghataur n=12: 20-35 vs 35-50 vs 50-65 vs 65-80
Replotted from Table 1 (page 3) of the original paper. Every bar is the paper's own table value.
View source evidence ↗Figures & tables
From the original paper Table 1
 Table 2
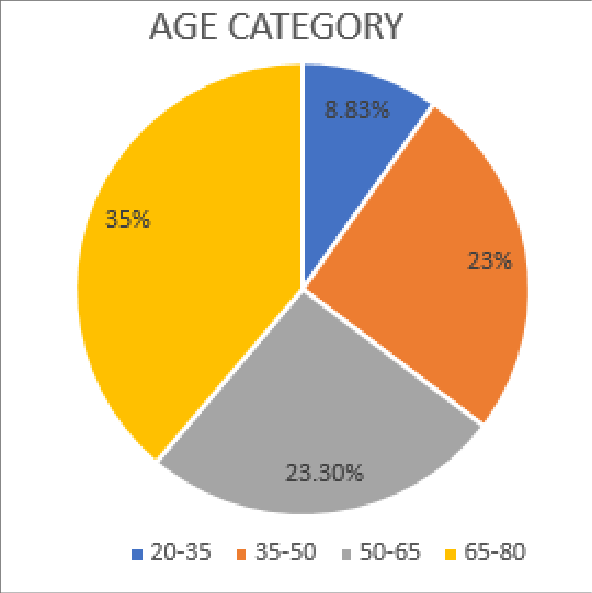 Figure 1
 Table 3
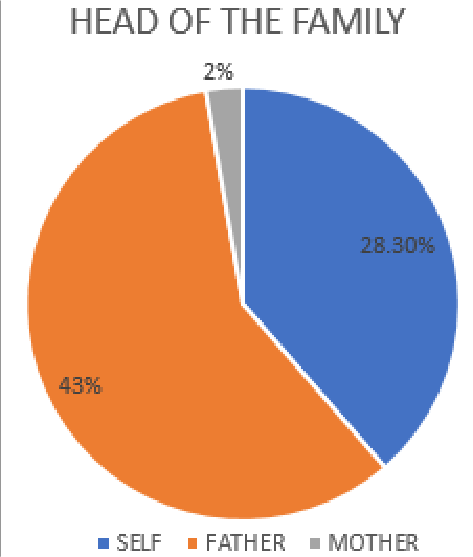 Figure 2
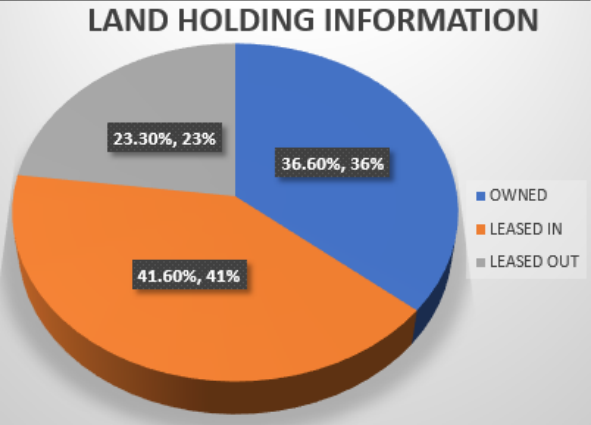 Figure 3
 Table 4
 Table 5
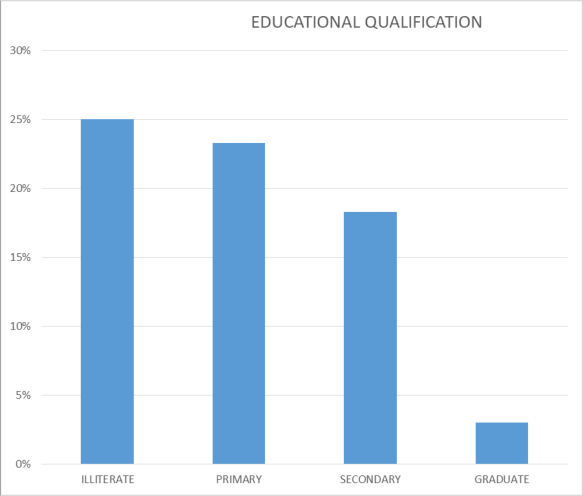 Figure 4
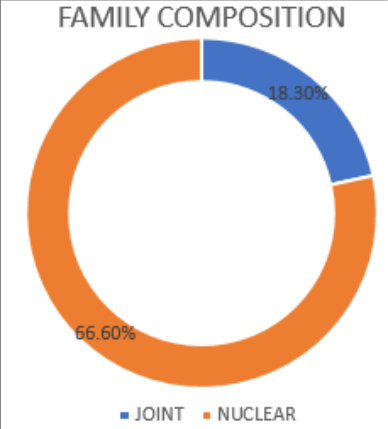 Figure 5
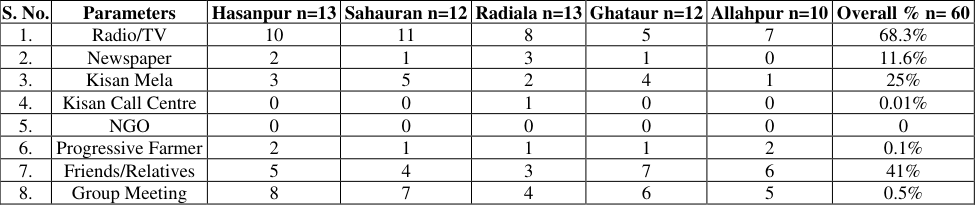 Table 6
 Table 7
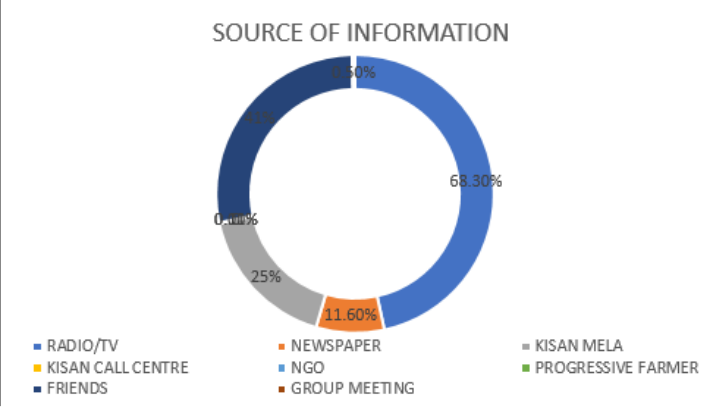 Figure 6
 Table 8
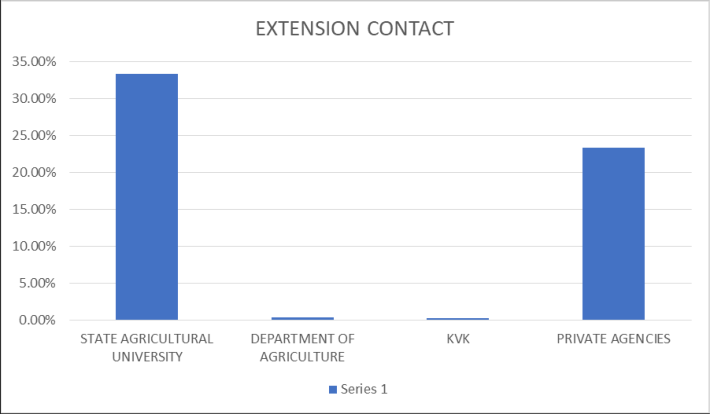 Figure 7
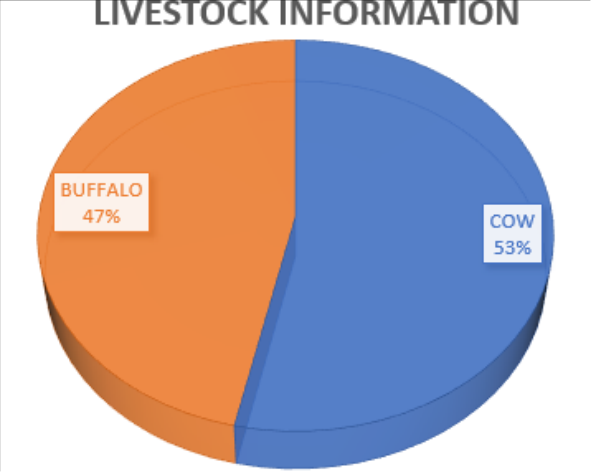 Figure 8
 Table 9
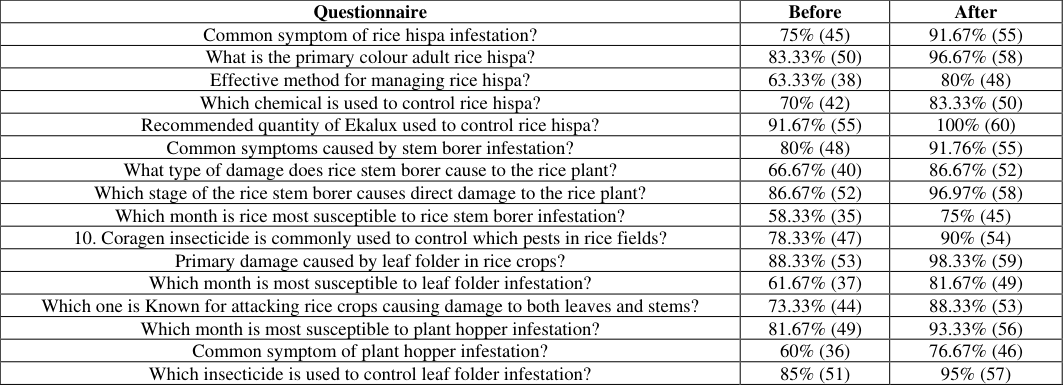 Table 10
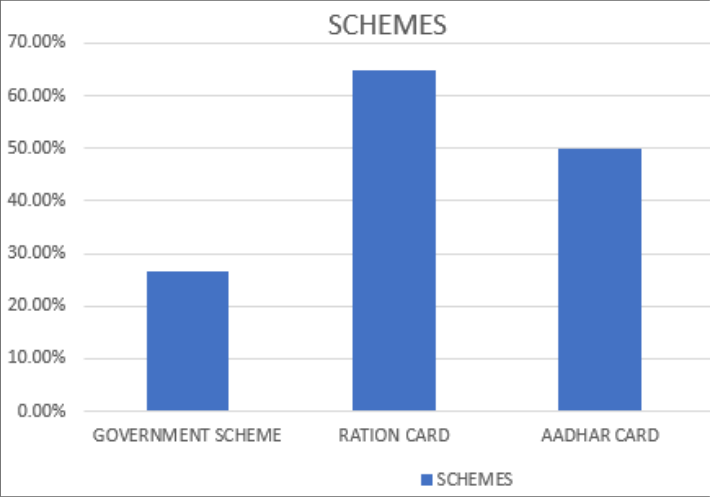 Figure 9
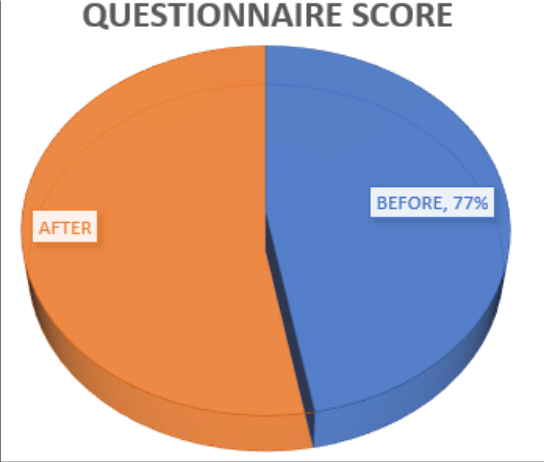 Figure 10
Introduction
Agriculture plays a crucial role in India's economy, with over 50% of the population making a living from it. The sector provides raw materials for various other industries and contributes significantly to the country's GDP. Therefore, improving agricultural practices is crucial to increase the country's agricultural productivity and promote economic growth. Providing quality education to impoverished and rural communities is also vital to India's social and economic progress. Rice cultivation in Punjab has experienced remarkable growth and productivity over the past 45 years, leading to the state being recognized as the "Rice Bowl of India." Since the Green Revolution in the 1960s, Punjab has made significant strides in rice cultivation, contributing substantially to India's overall rice production. The adoption of high-yielding varieties and modern agricultural practices has been pivotal in Punjab's success story in rice [3] . Rice holds a crucial position in India's agricultural landscape, covering a quarter of the total cropped area and providing sustenance to nearly half of the Indian population. Punjab's progress in rice productivity can be attributed to its adoption of high-yielding varieties and advanced agricultural techniques. The state's success in rice cultivation has not only boosted its own agricultural output but has also significantly impacted India's rice production on a national scale [1] . The adaptability of rice cultivation in Punjab is evident through its growth under diverse soil and climatic conditions. From below sea level areas like Kuttanad in Kerala to elevations reaching 2000 meters in regions like Jammu & Kashmir, Himachal Pradesh, and the North-Eastern Hills, rice crops thrive across a wide range of environments. This adaptability underscores the resilience and extensive cultivation potential of rice across various terrains and climates [2] . Despite these achievements, rice cultivation in Punjab faces challenges such as pest infestations, especially after floods, leading to issues like ineffective sprays and labor shortages [8] . To address these challenges sustainably, Integrated Pest Management (IPM) practices play a crucial role by emphasizing regular monitoring, optimal pesticide use research, and the integration of bio-based approaches for effective pest management [6] . Our central focus was on addressing insect pests in paddy fields we employed a questionnaire and video actively involve farmers, evaluating their comprehension both before and after viewing the instructional video. This methodology enabled us to gauge the farmers understanding of insect pest management in paddy cultivation. In the region of Punjab, farmers grapple with challenges posed by prevalent pests such as rice stem borer, rice hispas and brown plant hoppers [5] . In response to these challenges, Punjabi farmers adopt a range of practices including visual inspections, sampling techniques, the introduction of biological control agents, participation in Farmer Field Schools for integrated Pest management practices, selective application of insecticides based on Economic Threshold Levels and strategic interventions for maximum effectiveness [9] .
Materials and Methods
In the RAWE program, we developed a questionnaire and video focusing on insect pest management in paddy fields. We engaged farmers by posing questions before and after they viewed the video. This approach allowed us to assess their comprehension and knowledge retention regarding insect pest management in paddy cultivation. The socio-economic status of farmers in the SAS Nagar, districts of Punjab, India, provides a comprehensive view of their living conditions, access to resources, and overall well-being. By analysing data collected from villages, Hasanpur, Radiala, Ghataur, Allahpur, Soharaun, crucial insights into various aspects of the farmers' lives, including age distribution, education levels, access to technology, family structure, land holdings, and sources of information, are obtained. The study locale was selected based on the representativeness of the district's agricultural practices and the diversity in landholding sizes. The research was conducted in three villages within the SAS Nagar district of Punjab, located in the northeastern part of the state. The selection of these villages ensures that the findings can be contextualized within the broader district context while capturing potential variations within it. This study locale allowed for a comprehensive exploration of the socio-economic landscape and well-being of farmers in the SAS Nagar district of Punjab. The non-experimental, descriptive research design enabled the observation and characterization of complex relationships between independent and dependent variables, while the selection of representative villages enabled contextualization within the broader district context. Hasanpur village is a significant rural community located in the Kharar tehsil of Sahibzada Ajit Singh Nagar district in Punjab, India. The village has a total geographical area of 172 hectares, and its demographic and socio-economic profile has been updated using the latest available data. It is situated 16 km from the sub-district headquarter Kharar and 12 km from the district headquarter Sahibzada Ajit Singh Nagar. According to the 2011 Census, the village code is 039040, and it falls under the governance of the Hasanpur gram panchayat. The village has a total population of 961, with 518 males and 443 females. The literacy rate stands at 79.71%, with 82.43% of males and 76.52% of females being literate. The village has approximately 175 houses, and its pin code is 140103. Kurali is the nearest town for major economic activities [4] .
Radiala
A village located within the Kharar tehsil of Punjab's Sahibzada Ajit Singh Nagar district, is a community that is undergoing a transformation while still retaining its traditional roots. The village is situated approximately 19 kilometers from the Kharar sub-district headquarters and 23 kilometers from the district headquarters, covering a total land area of 297 hectares. While the 2011 census provides a historical perspective, it is essential to provide an up-to-date picture of Radiala in 2024 [7] .
Ghataur
Ghataur is home to 1,453 people who embody a vibrant rural spirit. Agriculture remains the main source of income, with wheat and paddy being the primary crops. Despite 75.2% of the population being literate, the gender gap in literacy is still a concern. The village is known for its strong community spirit and traditional values. However, with the nearby IT hub of SAS Nagar, social interactions are changing, and it remains to be seen how this will affect the aspirations of future generations. Ghataaur must navigate the challenges of diversifying its economy, addressing the gender gap in literacy, and adapting to the changing social landscape while preserving its unique identity.
Allahpur
Allahpur, with a population of 1,023, shares similar economic realities with Ghataaur, with agriculture remaining a dominant industry. However, the literacy rate is slightly lower, standing at 73.4%, with a higher disparity between male and female literacy rates. Like Ghataaur, Allahpur has a strong sense of community and traditional values. With the advent of the nearby IT hub, social interactions are changing, and further exploration is needed to understand how this will affect the aspirations of future generations. Allahpur's future depends on achieving sustainable economic diversification, bridging the literacy gap, and proactively addressing the challenges posed by the changing social landscape.
Soharaun
Soharaun, with a population of 1,284, is a unique blend of agriculture, animal husbandry, and small-scale industries. This diversification has resulted in a slightly higher literacy rate of 76.9%, but the gender gap remains an issue. Soharaun's strong Punjabi identity is evident, while its social fabric is undergoing changes driven by education and technology. Understanding how these factors influence intergenerational dynamics and cultural preservation is crucial. Soharaun's progress hinges on modernizing its agricultural practices, creating job opportunities for its youth, and ensuring the harmonious integration of technological advancements while safeguarding its rich cultural heritage. Primary data collection for this study involved administering questionnaires based on interviews conducted with 60 farmers. The questionnaire was developed through pre-structured sessions aimed at aligning with the study's objectives. Percentages have been included alongside the recorded data to enhance comprehension, calculated using relevant formulas. Percentage (%) = N/ n*100 where, N = total no. of respondents from all the 5 villages i.e., 60 respondents. n = the no. of respondents from each village.
Results and Declarations
The survey revealed that 20, 25, 30, 35 overall percentage of the respondents is 8.83% of G1, G2, G3, G4 respectively were in the age group of 35, 40, 45, 50 percentage of respondents is 23% of G1, G2, G3, G4 respectively were in the age group of 50, 55, 60, 65 overall percentage of respondents is 23.3% of G1, G2, G3, G4 and respectively were in the age group of 65-80 years overall percentage of respondents is 35%.
Head of the family
The head of a village or community plays a pivotal role in leadership and decision-making within that locality. The role of the head of the family is crucial as they serve as the primary caregiver and decision-maker within the household. In a recent survey conducted in five villages, data was collected on three categories of family heads: self, father, and mother. The results indicated that self accounted for 28.3%, father for 43.3%, and mother for 2% of the total, with fathers being the most common family heads across the villages. This underscores the significant responsibility fathers hold in leading their families and making important decisions within the farming communities.
Family Composition
The survey also revealed that most of the families in the villages were nuclear families, with only a small percentage living in joint families. The percentage of nuclear families was 18.3%, while the percentage of joint families was 66.6% Neighbor-friends-relatives are commonly ranked as the primary source of information by farmers, highlighting the importance of informal networks in knowledge sharing. Additionally, company dealers and print media play significant roles in providing agricultural information to rural farmers, emphasizing the diverse range of sources utilized by farmers to enhance their farming practices.
Extension Contact
Farmers rely on various sources of information and extension contacts to manage their crops and improve productivity. Among the surveyed population, 33.3% of farmers utilize the state agricultural university as a source of information, while 0.3% consult the department of agriculture and 0.2% engage with agriculture science centers. Additionally, private agencies have been a significant source of guidance for 23.3% of farmers, indicating the diverse range of resources farmers leverage to enhance their agricultural practices. Farmers utilize a variety of sources to access information and guidance for their agricultural practices. These sources include state agricultural universities, departments of agriculture, agriculture science centers, and private agencies, highlighting the importance of diverse and accessible resources for farmers to improve their operations and productivity.
Livestock Information
Farmers manage their livestock and improve productivity. Among the surveyed population, 65% of farmers utilize cow and buffalo as their primary livestock, with 56.6% specifically focusing on cow or buffalo. Additionally, the income of people is known because few people are making their products, selling milk or milk in dairy also provides a source of income, which is also a hope .Cow and buffalo are the most common livestock species in the surveyed population, highlighting their significance in the farming community. These animals play a crucial role in the agricultural economy, contributing to milk production and other dairy products. By leveraging the resources available for cow and buffalo management, farmers can optimize their livestock operations and enhance their overall productivity .The income generated from selling milk or milk products in dairy also provides a significant source of income for farmers. This income stream is a hope for many farmers, as it contributes to their overall financial stability and well-being. By focusing on dairy production and marketing, farmers can capitalize on this income source and improve their livelihoods.
Schemes
Farmers utilize various government schemes to meet their needs and enhance their businesses. These schemes, launched by the government, aim to support farmers in different aspects. Among the surveyed population, 26.6% of people are utilizing a specific government scheme, while nearly all individuals have access to and use Aadhaar cards (65%) and ration cards (50%). The data reveals a significant uptake of these schemes among the surveyed population, indicating a widespread utilization of these resources to meet their requirements and benefit their Moreover, research highlights a strong link between farmers' knowledge and their implementation of pest management practices, emphasizing the importance of adequate knowledge and suitable practices to minimize the negative impacts of pesticides in agriculture.
Overall, these studies emphasize the positive influence of educational interventions on farmers' knowledge and practices concerning insect pest management in paddy fields.
Conclusion
Agriculture, along with its related sectors, undeniably stands as the primary source of livelihood in India, particularly in the extensive rural regions. Furthermore, it makes a substantial contribution to the Gross Domestic Product (GDP). Sustainable agricultural practices, encompassing food security, rural employment, and environmentally friendly technologies like soil conservation, sustainable natural resource management, and biodiversity protection, are imperative for comprehensive rural development. The agricultural landscape in India has witnessed significant transformations known as the green revolution, white revolution, yellow revolution, and blue revolution. The study conducted in five villages of SAS Nagar, Mohali area, Punjab, India, examines the socio-economic profile of farmers. The aim is to gain insights into the challenges and opportunities in the agricultural sector. The study covers various aspects of farmers' lives such as age distribution, education levels, access to technology, family structure, land holdings, and sources of information. Rice holds a crucial position in India's agricultural landscape, covering a quarter of the total cropped area and providing sustenance to nearly half of the Indian population. Punjab's progress in rice productivity can be attributed to its adoption of high-yielding varieties and advanced agricultural techniques. The state's success in rice cultivation has not only boosted its own agricultural output but has also significantly impacted India's rice production on a national scale. we developed a questionnaire and video focusing on insect pest management in paddy fields. We engaged farmers by posing questions before and after they viewed the video. This approach allowed us to assess their comprehension and knowledge retention regarding insect pest management in paddy cultivation.
Figures and tables from the paper
| S.No. | Parameters | Hasanpur n=13 | Sahauran n=12 | Radiala n=13 | Ghataur n=12 | Allahpur n=10 | Overall % n=60 |
|---|---|---|---|---|---|---|---|
| 1. | 20-35 | 1 | 2 | 0 | 1 | 1 | 8.83% |
| 2. | 35-50 | 2 | 5 | 1 | 2 | 4 | 23% |
| 3. | 50-65 | 3 | 5 | 2 | 1 | 3 | 23.3% |
| 4. | 65-80 | 6 | 4 | 4 | 2 | 5 | 35% |
Table text extracted from the original PDF; superscript letters are shown inline. The original table image is below.
View original table image
| S.No. | Parameters | Hasanpur n=13 | Sahauran n=12 | Radiala n=13 | Ghataur n=12 | Allahpur n=10 | Overall % n= 60 |
|---|---|---|---|---|---|---|---|
| 1. | SELF | 5 | 3 | 1 | 2 | 6 | 28.3% |
| 2. | FATHER | 13 | 3 | 6 | 1 | 3 | 43.3% |
| 3. | MOTHER | 3 | 2 | 5 | 1 | 1 | 2% |
Table text extracted from the original PDF; superscript letters are shown inline. The original table image is below.
View original table image
| S.No. | Parameters | Hasanpur n=13 | Sahauran n=12 | Radiala n=13 | Ghataur n=12 | Allahpur n=10 | Overall % n= 60 |
|---|---|---|---|---|---|---|---|
| 1. | OWNED | 6 | 4 | 7 | 3 | 2 | 36.6% |
| 2. | LEASED IN | 4 | 5 | 8 | 5 | 3 | 41.6% |
| 3 | LEASED OUT | 3 | 2 | 1 | 4 | 4 | 23.3% |
Table text extracted from the original PDF; superscript letters are shown inline. The original table image is below.
View original table image
| S.No. | Parameters | Hasanpur n=13 | Sahauran n=12 | Radiala n=13 | Ghataur n=12 | Allahpur n=10 | Overall % n= 60 |
|---|---|---|---|---|---|---|---|
| 1. | ILLITERATE | 3 | 2 | 4 | 3 | 3 | 25% |
| 2. | PRIMARY | 4 | 2 | 4 | 3 | 1 | 23.3% |
| 3 | SECONDARY | 1 | 2 | 3 | 3 | 2 | 18.3% |
| 4 | GRADUATE | 1 | 0 | 2 | 1 | 0 | 3% |
Table text extracted from the original PDF; superscript letters are shown inline. The original table image is below.
View original table image
| S.No. | Parameters | Hasanpur n=13 | Sahauran n=12 | Radiala n=13 | Ghataur n=12 | Allahpur n=10 | Overall % n= 60 |
|---|---|---|---|---|---|---|---|
| 1. | JOINT | 3 | 2 | 3 | 1 | 2 | 18.3% |
| 2. | NUCLEAR | 5 | 7 | 11 | 8 | 9 | 66.6% |
Table text extracted from the original PDF; superscript letters are shown inline. The original table image is below.
View original table image
| S. No. | Parameters | Hasanpur n=13 | Sahauran n=12 | Radiala n=13 | Ghataur n=12 | Allahpur n=10 | Overall % n= 60 |
|---|---|---|---|---|---|---|---|
| 1. | Radio/TV | 10 | 11 | 8 | 5 | 7 | 68.3% |
| 2. | Newspaper | 2 | 1 | 3 | 1 | 0 | 11.6% |
| 3. | Kisan Mela | 3 | 5 | 2 | 4 | 1 | 25% |
| 4. | Kisan Call Centre | 0 | 0 | 1 | 0 | 0 | 0.01% |
| 5. | NGO | 0 | 0 | 0 | 0 | 0 | 0 |
| 6. | Progressive Farmer | 2 | 1 | 1 | 1 | 2 | 0.1% |
| 7. | Friends/Relatives | 5 | 4 | 3 | 7 | 6 | 41% |
| 8. | Group Meeting | 8 | 7 | 4 | 6 | 5 | 0.5% |
Table text extracted from the original PDF; superscript letters are shown inline. The original table image is below.
View original table image
| S. No. | Parameters | Hasanpur n=13 | Sahauran n=12 | Radiala n=13 | Ghataur n=12 | Allahpur n=10 | Overall % n= 60 |
|---|---|---|---|---|---|---|---|
| 1. | State agricultural university | 3 | 2 | 5 | 6 | 4 | 33.3% |
| 2. | Department of agriculture | 5 | 3 | 7 | 2 | 1 | 0.3% |
| 3. | KVK | 1 | 3 | 2 | 1 | 5 | 0.2% |
| 4. | Private Agencies | 4 | 2 | 1 | 3 | 4 | 23.3% |
Table text extracted from the original PDF; superscript letters are shown inline. The original table image is below.
View original table image
| S.No. | Parameters | Hasanpur n=13 | Sahauran n=12 | Radiala n=13 | Ghataur n=12 | Allahpur n=10 | Overall % n= 60 |
|---|---|---|---|---|---|---|---|
| 1. | COW | 7 | 8 | 10 | 5 | 9 | 65% |
| 2. | BUFFALO | 5 | 7 | 4 | 8 | 10 | 56.6% |
Table text extracted from the original PDF; superscript letters are shown inline. The original table image is below.
View original table image
| S.No. | Parameters | Hasanpur n=13 | Sahauran n=12 | Radiala n=13 | Ghataur n=12 | Allahpur n=10 | Overall % n= 60 |
|---|---|---|---|---|---|---|---|
| 1. | GOVERNMENT SCHEME | 3 | 5 | 4 | 2 | 2 | 26.6% |
| 2. | RATION CARD | 7 | 8 | 9 | 5 | 10 | 65% |
| 3. | AADHAR CARD | 13 | 12 | 13 | 12 | 9 | 50% |
Table text extracted from the original PDF; superscript letters are shown inline. The original table image is below.
View original table image
| Questionnaire | Before | After |
|---|---|---|
| Common symptom of rice hispa infestation? | 75% (45) | 91.67% (55) |
| What is the primary colour adult rice hispa? | 83.33% (50) | 96.67% (58) |
| Effective method for managing rice hispa? | 63.33% (38) | 80% (48) |
| Which chemical is used to control rice hispa? | 70% (42) | 83.33% (50) |
| Recommended quantity of Ekalux used to control rice hispa? | 91.67% (55) | 100% (60) |
| Common symptoms caused by stem borer infestation? | 80% (48) | 91.76% (55) |
| What type of damage does rice stem borer cause to the rice plant? | 66.67% (40) | 86.67% (52) |
| Which stage of the rice stem borer causes direct damage to the rice plant? | 86.67% (52) | 96.97% (58) |
| Which month is rice most susceptible to rice stem borer infestation? | 58.33% (35) | 75% (45) |
| 10. Coragen insecticide is commonly used to control which pests in rice fields? | 78.33% (47) | 90% (54) |
| Primary damage caused by leaf folder in rice crops? | 88.33% (53) | 98.33% (59) |
| Which month is most susceptible to leaf folder infestation? | 61.67% (37) | 81.67% (49) |
| Which one is Known for attacking rice crops causing damage to both leaves and stems? | 73.33% (44) | 88.33% (53) |
| Which month is most susceptible to plant hopper infestation? | 81.67% (49) | 93.33% (56) |
| Common symptom of plant hopper infestation? | 60% (36) | 76.67% (46) |
| Which insecticide is used to control leaf folder infestation? | 85% (51) | 95% (57) |
Table text extracted from the original PDF; superscript letters are shown inline. The original table image is below.
View original table image
References
1 in the original paper- Food and Agriculture Organization of the United Nations. Role of Durum Wheat Cultivation in Indian Wheat Economy. Indian Farming. 2002;50(8):14-16.