
Research article · 2024 · Full text
International Journal of Agriculture Extension and Social DevelopmentUnlocking insights into marine product exports in India: analysing trade patterns and export potential using Markov chain approach
Volume 7(4) · Pages 604–608 · DOI: 10.33545/26180723.2024.v7.i4h.578 ↗
Research areasGlobal trade and economicsGlobal Trade and CompetitivenessAgricultural Economics and Practices
Abstract
Author-writtenMarine sector in India holds tremendous potential for growth, export expansion and employment generation primarily due to competitive advantage of the country in the production of marine products. This study made an attempt to assess the loyalty of importing countries as well as analyse the competitiveness of Indian fisheries in world trade. Markov Chain Approach was used to explore the dynamic nature of trade patterns, particularly the gains and losses in the export of Indian marine products to significant importing nations. The study revealed that USA (99.69%), followed by Japan (96.36%), Other Countries (74.81%), South East Asian countries (67.85%), and China (42.03%) were the largest and most consistent importers of Indian marine products. It was also observed that EU, China, South East Asia, Middle East and the Other Countries exhibited a decline in the projected quantity of marine products imported from India over the years. The paper also provides suggestions to exporters and policymakers on tapping the future export potential of marine products in selected countries.
Summary
Source-checkedPlain-language reading of the full paper, prepared with AI and checked against the text. Each point links to the authors' own words.
Why it matters
- Global demand for marine products is rising due to factors like urbanization, globalization, and changing food consumption patterns. View evidence ↗
- India's comparative advantage in producing marine products provides significant opportunities for economic growth, employment, and export expansion. View evidence ↗
- Increasing exports is important because it boosts foreign exchange earnings, economic activity, and the general living standards of the population. View evidence ↗
The question
- The study aims to evaluate the loyalty of countries importing Indian marine products and analyze the overall competitiveness of Indian fisheries in global trade. View evidence ↗
What they did
- The researchers used annual export data for Indian marine products spanning from 1995-96 to 2020-21, sourced from MPEDA and Indiastat. View evidence ↗
- The analysis focused on six major importing regions: Japan, USA, EU, China, South East Asia, and the Middle East, with all other countries grouped as 'Others'. View evidence ↗
- The study employed Markov Chain Analysis and a Transition Probability Matrix, derived via Linear Programming with Minimization of Mean Absolute Deviation, to estimate exports. View evidence ↗
What they found
- South East Asia had the highest mean export quantity (188,205.85), followed by China (134,110.85) and the European Union (131,699.35). View evidence ↗
- The Compound Annual Growth Rate (CAGR) was highest for South East Asia (12.96%), while China showed a negative growth rate of -0.63%. View evidence ↗
- The USA (99.69%) and Japan (96.36%) were identified as the most consistent importers of Indian marine products. View evidence ↗
- The USA increased its market share by gaining 4.03% from China, 3.64% from Japan, and 3.25% from South East Asia. View evidence ↗
- Projections indicate that the USA and Japan are potential importers showing a stable increase in the quantity of imports from India. View evidence ↗
What it means
- The authors conclude that the EU, South East Asia, and China are highly loyal markets and recommend focusing promotional activities on these regions to expand exports. View evidence ↗
- To fully realize export potential, the authors suggest implementing modern fishing practices, diversifying aquaculture species, and providing value-added products. View evidence ↗
- The authors note that further expansion into South East Asian markets is limited by the need for ASEAN nations to provide greater market access and liberalization. View evidence ↗
Visual summary
2 visualsIllustrations explain the paper; charts are replotted from the paper's own table values.
Markov Chain Trade Flow
AI-generated conceptual illustration (Marine products (shrimp, tuna, and crab) and global maps). It explains the idea and does not show study data.
View source evidence ↗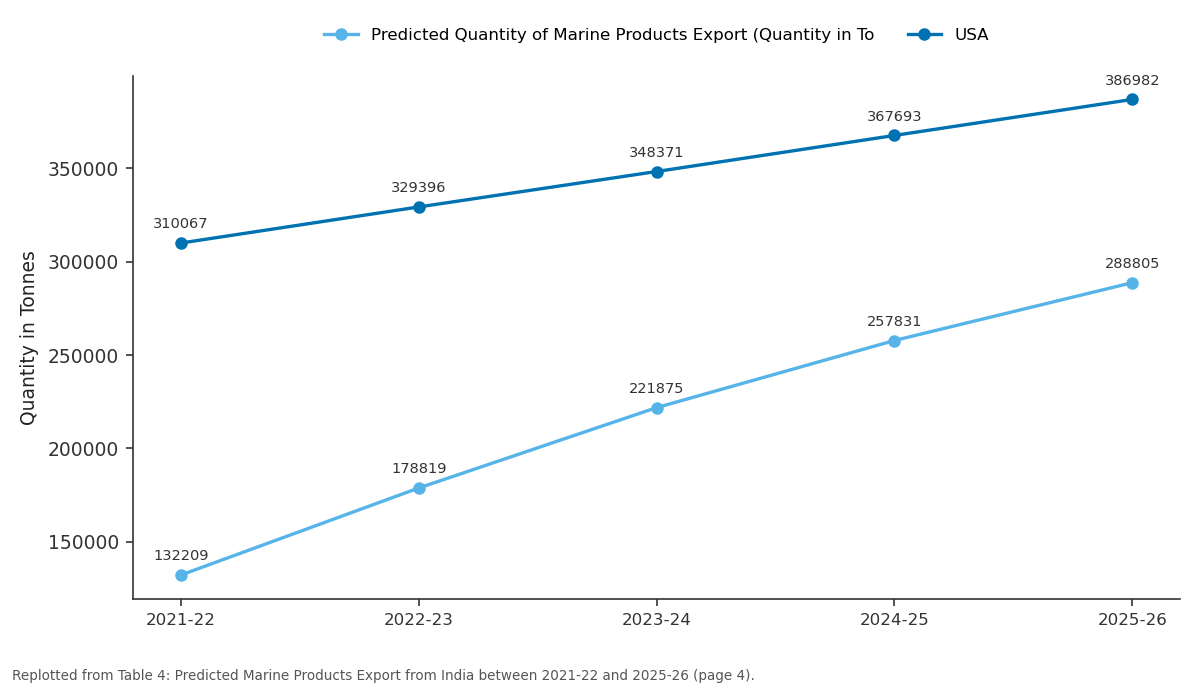
Predicted Quantity of Marine Products Export... and USA: 2021-22 vs 2022-23 vs 2023-24 vs 2024-25 vs 2025-26
Replotted from Table 4 (page 4) of the original paper. Every bar is the paper's own table value.
View source evidence ↗Figures & tables
From the original paper Table 1
 Table 2
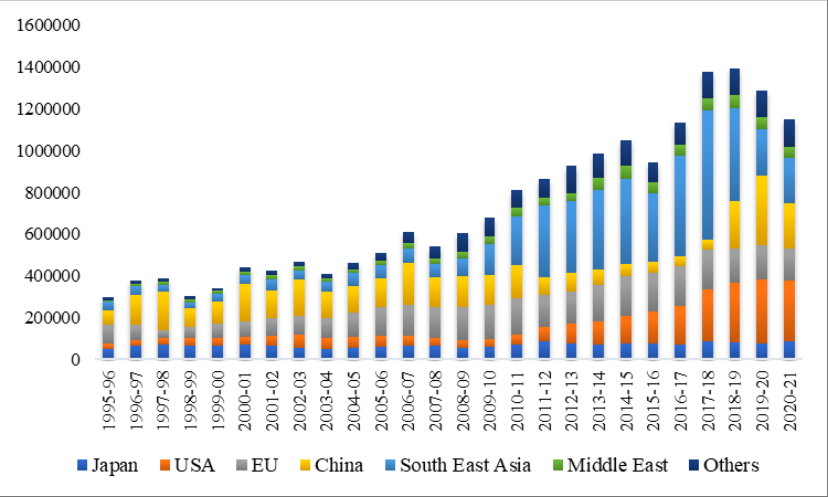 Figure 1
 Table 3
 Table 4
Introduction
India has been successful in diversifying its export portfolio, and in the recent years, several Indian products, especially marine products have seen surges in demand worldwide. Global demand for marine products has increased as a result of changes in the consumption pattern of food, expanding urbanization, globalization and trade policy liberalization, rapidly changing lifestyles, and emergence of new markets (Anand et al. 2015, Regmi 2001) [2,7] . It has been observed that marine exports have contributed to the development of the economies of India as a whole and a few of its states (Radhakrishnan et al. 2018, Faria et al. 2016) [6,5] . India is a significant exporter of marine products to the global market, including fish, shrimp, squid, cuttlefish, scampi, lobster, octopus, and bivalve marine products. Indian exports rely heavily on seafood products. Revenue generated from marine products export exceeded 5.5 billion USD, totalling 1,05,1243 tonnes in volume and ₹ 33,441 crores in value. Seafood exports increased 6.86 per cent in volume and 10.69 per cent in rupee value, and 10.05 per cent over the previous years (MPEDA, 2016) [1] . This suggests that India might potentially increase its exports of marine products and strategic planning focusing on key markets and products is necessary to tap this potential. Due to the comparative advantage that India holds with respect to production of marine products, the marine sector in India has an enormous potential for growth, export expansion, and creation of employment.
Increased exports guarantee greater revenues in foreign exchange earnings, economic activity, employment prospects, and living standards of the population in a country (World Trade Report, 2017) [9] . Thus, the study made an effort to assess the loyalty of importing countries as well as analyse the competitiveness of Indian fisheries in world trade. A thorough understanding of Indian fisheries exports and their trade orientation would benefit in policy decisions for export promotion.
Materials and Methods
Annual export data of Indian Marine products for the period 1995-96 to 2020-21 were collected from the database of Marine Processed Export Developmental Authority (MPEDA) and Indiastat, to analyse the direction of trade and changing pattern Indian marine products export. Major importing countries of Indian Marine and seafood products were Japan, USA, EU, China, South East Asia, Middle East and the other countries were grouped and named as Others. The collected data was converted into a Linear Programming (LP) problem using Minimization of Mean Absolute Deviation (MAD), and by solving the LP problem, Transition Probability Matrix was formed. Exports of the Indian marine products were estimated using Markov Chain Analysis (Das et al., 2016) [3] . Markov Chain Analysis was employed to analyse the structural change in any system whose development over time can be assessed in terms of a single outcome variable (Dent, 1967) [4] . In the present www.extensionjournal.com study, Markov Chain Approach was used to explore the dynamic nature of trade patterns, particularly the gains and losses in the export of Indian marine products to significant importing nations (Singh & Siddiqui 2021) [8] . This was done by developing a Transitional Probability Matrix 'P' whose elements indicate the probability of exports switching from country 'i' to country 'j' over time. The diagonal element where i = j measures the probability of a country retaining its market share, or in other words the loyalty of an importing country to a particular country's exports.
In the context of current application, structural change was treated as a random process with six importing countries. For marine products. the assumption was that the average export of marine products from India amongst importing countries in any period was dependent only on the export in the previous period, and this dependence was same throughout the study period. This was algebraically expressed as:
Where, = Exports from India to the j th country in the year t, = Exports of i th country during the year t-1, = Probability that exports will shift from i th country to j th country, = Error term which was statistically independent of Eit-1, n = Number of importing countries Transitional probability could be arranged in a (c x n) matrix having the following properties:
Thus, the expected export share of each country during period 't' was obtained by multiplying the exports to these countries in the previous period (t-1) with the transitional probability matrix. The probability matrix was estimated for the period 1995-96 to 2020-21. Thus, transitional probability matrix (T) was estimated using linear programming (LP) framework by a method referred to as minimization of mean absolute deviation (MAD).
Results and Discussion Summary Statistics
The Table 1 represents a summary statistics picture of marine products export quantities from India. Highest Mean value for marine products export from India was observed in South East Asia followed by China and European Union. This indicates significant export activity and trade relationships in the marine products industry between India and these regions. The reasons may be due to proximity and regional demand, trade agreements, quality and variety, competitive pricing and economic growth. The Table 2 represents the Compound Annual Growth Rate (CAGR) India's marine products export with major trading partners. Among the major importing countries, higher and positive CAGR was observed with South East Asia (12.96%) followed by other countries (11.59%) and USA (9.63%) from India. China showing minimal and negative CAGR with (-0.63%). This CAGR percentages suggest that India's marine product export industry has been expanding at varying rates to different regions. Rapid growth in South East Asia and other countries indicates potential www.extensionjournal.com opportunities for Indian exporters to diversify and tap into emerging markets. However, it's essential to continue monitoring these trends and adapting export strategies to remain competitive in the global seafood trade. The Figure 1 depicts the trend of Marine products export from India, it is clear from the below figure during last decade the export growth was tremendous than previous decades with major portion in South East Asia followed by European Union and United States of America. A dip in the trend was observed after Covid -19 pandemic, the reason for decline may be due to supply chain disruptions, lockdowns and cargo constraints.
| Importing Countries | CAGR |
|---|---|
| Japan | 1.37 |
| USA | 9.63 |
| EU | 5.23 |
| China | -0.63 |
| South East Asia | 12.96 |
| Middle East | 8.00 |
| Others | 11.59 |
| Total | 6.49 |
Table text extracted from the original PDF; superscript letters are shown inline. The original table image is below.
View original table image
| Importing Countries | Japan | USA | EU | China | South East Asia | Middle East | Others |
|---|---|---|---|---|---|---|---|
| Mean | 69066.58 | 97792.38 | 131699.35 | 134110.85 | 188205.85 | 33354.65 | 68369.54 |
| Std Deviation | 10373.23 | 89874.83 | 47941.79 | 65985.56 | 174811.82 | 18660.92 | 45945.31 |
| Minimum | 50020.00 | 26008.00 | 34088.00 | 45443.00 | 26917.00 | 8800.00 | 12315.00 |
| Maximum | 86764.00 | 305178.00 | 190314.00 | 329479.00 | 616707.00 | 64608.00 | 133223.00 |
Table text extracted from the original PDF; superscript letters are shown inline. The original table image is below.
View original table image
Direction of Marine product export from India
The analysis was carried out to understand the export pattern of Indian marine products for a twenty-six-year period (1995-96 to 2020-21). The major importing countries are Japan, USA, EU, China, South East Asia, Middle East, and pooling other countries as "Others". The results of the export direction are given in Table 3. USA (99.69%), followed by Japan (96.36%), Other Countries (74.81%), South East Asian countries (67.85%), and China (42.03%) were the largest and most consistent importers of Indian marine products. USA gained about 4.03 per cent, 3.64 per cent and 3.25 per cent of the share from China, Japan, and South East Asia, respectively. It lost fewer portion of its share to the other countries accounting to 0.31 per cent. Japan gained about 100 per cent of its share from Middle East, and had lost about 3.64 per cent of its share to USA. Other countries gained shares from South East Asian countries (4.90%), China (4.87%) and USA (0.31%). It had lost about 12.60 per cent of its share to Middle East and 12.59 per cent of its share to South East Asian countries. South East Asian countries had gained about 12.59 per cent from other countries, 5.81 per cent from China and 2.64 per cent of their share from European Union. In the same period, it had lost its share to the European Union (17.65%), Middle East (6.35%), Other countries (4.90%) and USA (3.25%). China gained about 95.82 per cent of its share from European Union, and it had lost 33.72 per cent, 9.54 per cent, 5.81 per cent, 4.87 per cent and 4.03 per cent of its share to European Union, Middle East, South East Asia, Other Countries and USA, respectively.
| Country | Japan | USA | EU | China | South East Asia | Middle East | Others |
|---|---|---|---|---|---|---|---|
| Japan | 0.9636 | 0.0364 | 0.0000 | 0.0000 | 0.0000 | 0.0000 | 0.0000 |
| USA | 0.0000 | 0.9969 | 0.0000 | 0.0000 | 0.0000 | 0.0000 | 0.0031 |
| EU | 0.0000 | 0.0000 | 0.0153 | 0.9582 | 0.0264 | 0.0000 | 0.0000 |
| China | 0.0000 | 0.0403 | 0.3372 | 0.4203 | 0.0581 | 0.0954 | 0.0487 |
| South East Asia | 0.0000 | 0.0325 | 0.1765 | 0.0000 | 0.6785 | 0.0635 | 0.0490 |
| Middle East | 1.0000 | 0.0000 | 0.0000 | 0.0000 | 0.0000 | 0.0000 | 0.0000 |
| Others | 0.0000 | 0.0000 | 0.0000 | 0.0000 | 0.1259 | 0.1260 | 0.7481 |
Table text extracted from the original PDF; superscript letters are shown inline. The original table image is below.
View original table image
Predicted Quantity of Marine Products Export from India
The market share projections of Indian marine products exports to the major importing countries were computed using the Transitional Probability Matrix. The predicted www.extensionjournal.com quantities of Indian marine products exports to major importing countries are presented in Table 3. From the analysis, it could be inferred that USA and Japan could be a potential importer of Marine products revealing a stable increase in the quantity of imports from India. It could also be observed that EU, China, South East Asia, Middle East and the Other Countries exhibit a decline in the projected quantity of marine products imported from India. This could be attributed to stiff competition and higher market penetration efforts from by major marine products exporting countries. This calls for appropriate policy measures and marketing efforts to sustain in the growing markets.
Conclusions
From the results, it could be concluded that European Union, South East Asia, and China were highly loyal markets for Indian marine products. Therefore, promotional activities with respect to exports could be oriented towards these countries for further expansion of exports. Marine Products Export Development Authority (MPEDA) could focus on under prevailing international market situations. Depreciation of Euro, weaker economic condition in China, devaluation of Yen, depreciation of the Indian Rupee, improvement in supply conditions in South East Asian (SEA) countries in comparison to previous years had resulted in continuous drop in prices of shrimp, which is a prime commodity of the Indian seafood export basket. Global markets for marine products are growing significantly due to the increasing demand for human consumption, fishmeal and fish oil, bio active compounds, cosmetic and pharmaceutical industry, and food processing industry. Multi-functionality of marine products in various industrial applications is a driving factor for expanding its role in the international market. Therefore, it is necessary to create awareness among Indian fishermen about its importance at the international market to exploit full market potential of seafood products. India could capitalize the opportunity to make further inroads into the South East Asian nations, only if the ASEAN nations open their markets further by giving greater access to fish and fishery products such as frozen shrimp, frozen tuna etc. in which India has a comparative advantage.
The AIFTA in the present framework does not offer much prospects for our marine product exports in the SEA market. It calls for further liberalization and preferential treatment for the marine product exports of India so that we can capitalize on the gains that have already been made. Policy makers could design suitable assistance in the form of export incentives, benefits, and support and duty neutralization schemes in the form of production-oriented support, thereby disseminating the benefits to marine traders, motivating them for enhanced production, marketing, and foreign trade. Further, mechanization of operations through modern fishing practices, production of diversified aquaculture species, and supply value-added marine products could help tap the export potential.
Figures and tables from the paper
| Year | Predicted Quantity of Marine Products Export (Quantity in Tonnes) | — | — | — | — | — | — |
|---|---|---|---|---|---|---|---|
| Japan | USA | EU | China | South East Asia | Middle East | Others | |
| 2021-22 | 1,32,209 | 3,10,067 | 1,14,405 | 2,38,149 | 1,81,200 | 51,427 | 1,21,882 |
| 2022-23 | 1,78,819 | 3,29,396 | 1,14,056 | 2,09,710 | 1,55,154 | 49,571 | 1,12,633 |
| 2023-24 | 2,21,875 | 3,48,371 | 99,862 | 1,97,424 | 1,34,655 | 44,040 | 1,03,113 |
| 2024-25 | 2,57,831 | 3,67,693 | 91,882 | 1,78,659 | 1,18,459 | 40,367 | 94,448 |
| 2025-26 | 2,88,805 | 3,86,982 | 82,572 | 1,63,127 | 1,05,078 | 36,458 | 86,318 |
Table text extracted from the original PDF; superscript letters are shown inline. The original table image is below.
View original table image
References
6 in the original paper- Das A, Kumar NR, Rani P. Growth, instability and forecast of marine products export from India. Indian Journal of Fisheries. 2016;63(4):112-117.
- Dent WT. Application of Markov Analysis to International Wool Flows. Review of Economics and Statistics. 1967;49(2):613-616.
- Faria S, Kamat M. An Analysis of Marine Production and Exports of Goa's Fisheries Sector. Intercontinental Journal of Marketing Management. 2016, 3.
- Radhakrishnan K, Tesfom MA, Krishnan M, Infantina J, Sivaraman I. Growth and Performance of Indian Fish and Fishery Products Exports. Fishery Technology. 2018;55:143-148.
- Regmi A. Changing Structure of Global Food Consumption and Trade. Economic Research Service. 2001, 4.
- Singh R, Siddiqui AA. Identifying Markets and Forecasting Export Prospects for India's Marine Products. International Journal of Business & Economics. 2021;20(1).
Cited by 3
From OpenAlex, OpenCitations and reference lists read by Scinovex
- Revealed Comparative Advantage and Market Retention Analysis of India’s Marine Product Exports ↗
Parth Mathukia, Shilpa Trivedi, Kalpesh Kumar, Chetan Lakhlani · Advances in Research · 2026
Aims: To analyse the competitiveness and structural shifts in India's marine product exports over 2004-05 to 2023-24, addressing the gap in understanding long-run market transition patterns using RCA and Markov Chain techniques. Study Design: Quantitative analytical study based on secondary time-series data, employing RCA and Markov Chain models to assess export competitiveness and market transitions. Place and Duration of Study:…
❝ 0PDF - Dynamics of India’s Marine Product Exports: Growth, Structural Change and Transition Behaviour across Global Markets ↗
Manoj Kumar Dara, Praveen Kumar Verma, Jahnavi Moturi · Research Square · 2026
❝ 0PDF - Assessment of India’s Agricultural Trade Dynamics and Trade Volatility Through Markov Chain Analysis ↗
Chow Suliyaa Mantaw, Subhasis Mandal, Swati Singh, Udita Chaudhary, Gunjan Bhandari · Agricultural Economics Research Review · 2026
This study examined India’s agricultural trade dynamics from 2017–2018 to 2024–2025. It integrated descriptive trade analysis, the Herfindahl–Hirschman Index (HHI), the Cuddy–Della Valle Index (CDVI) and first-order Markov chain (MC) transition probability matrices across five commodity groups categorized by the national import–export record for yearly analysis of trade portal. Agricultural exports grew steadily over the study period (6.52%), whereas imports…
❝ 0