
Research article · 2024 · Full text
International Journal of Agriculture Extension and Social DevelopmentDietary habits of tribal people of Kandhamal, Odisha
Volume 7(4) · Pages 539–542 · DOI: 10.33545/26180723.2024.v7.i4g.573 ↗
Research areasAgricultural Economics and PracticesLivestock Management and Performance ImprovementFood Security and Health in Diverse Populations
Abstract
Author-writtenThe study was conducted among the tribal people of Kandhamal, Odisha. By random sampling method total 80 tribal households of Desia Kandha (Desia Khonds) tribe were selected from two different villages (Brenguda and Penala) of Kandhamal. Each 40 households were selected from both the villages of Kandhamal district to assess their dietary habits which are the major reasons of poor nutrient intake. The average age of the women were 43.7 ± 13.43 years, the average height of the women were 148.5 ± 6.2 cm and the average weight of the women were 45.8 ± 7.20 kg. The study imparted that there were 53.75% women were consuming meals three times a day and 46.25% consuming meals two times a day. Most of them i.e 51.25% women skipped their meals in a day and 95% women made changes in their food preparation practices which were the cause of poor nutrient intake. Therefore, for a viable health and a good nutritional status of the women and their families have to increased food consumption and follow appropriate dietary practices.
Summary
Source-checkedPlain-language reading of the full paper, prepared with AI and checked against the text. Each point links to the authors' own words.
Why it matters
- Odisha has a significant tribal population, accounting for 22.86% of the state's total population (9.59 million) as of the 2011 Census. View evidence ↗
- The Kandhamal district in Odisha is characterized by a high intensity of nutritional problems. View evidence ↗
- Poor nutrient intake among women in Kandhamal is attributed to poor dietary habits. View evidence ↗
The question
- The study aimed to assess the dietary habits of tribal households in Kandhamal to understand the primary reasons for poor nutrient intake. View evidence ↗
What they did
- The researchers used random sampling to select 80 households from the Desia Kandha (Desia Khonds) tribe across two villages: Brenguda and Penala. View evidence ↗
- Data was collected via personal interviews using structured questionnaires and a 24-hour recall method with standardized vessels to analyze food intake. View evidence ↗
- The study used frequency and percentage for demographic profiles, and mean and standard deviation for dietary intake analysis. View evidence ↗
What they found
- The average physical profile of the women studied was an age of 43.7 ± 13.43 years, a height of 148.5 ± 6.2 cm, and a weight of 45.8 ± 7.20 kg. View evidence ↗
- Over half of the respondents (51.25%) reported skipping meals during the day. View evidence ↗
- A vast majority of respondents (95%) practiced changes in food preparation. View evidence ↗
- Daily fluid intake averaged 3243.8 ± 346.71 ml for water and 155.6 ± 84.19 ml for tea without milk. View evidence ↗
- Monthly household food intake was highest for cereals and millets (30.5 ± 16.25 kg) and vegetables (16.5 ± 8.12 kg), while fruits (0.81 ± 1.44 kg) and nuts/oil seeds (0.78 ± 0.34 kg) were the lowest. View evidence ↗
- Rice washing practices varied, with 50% washing twice, 32.5% once, and 17.5% thrice before cooking. View evidence ↗
- Vegetable peeling before cooking was practiced by 52.5% of the subjects. View evidence ↗
What it means
- The authors conclude that improper cooking practices in more than half of the respondents lead to nutrient loss and poor health. View evidence ↗
- The authors recommend increasing food intake and adopting appropriate dietary practices to achieve viable health. View evidence ↗
Visual summary
2 visualsIllustrations explain the paper; charts are replotted from the paper's own table values.
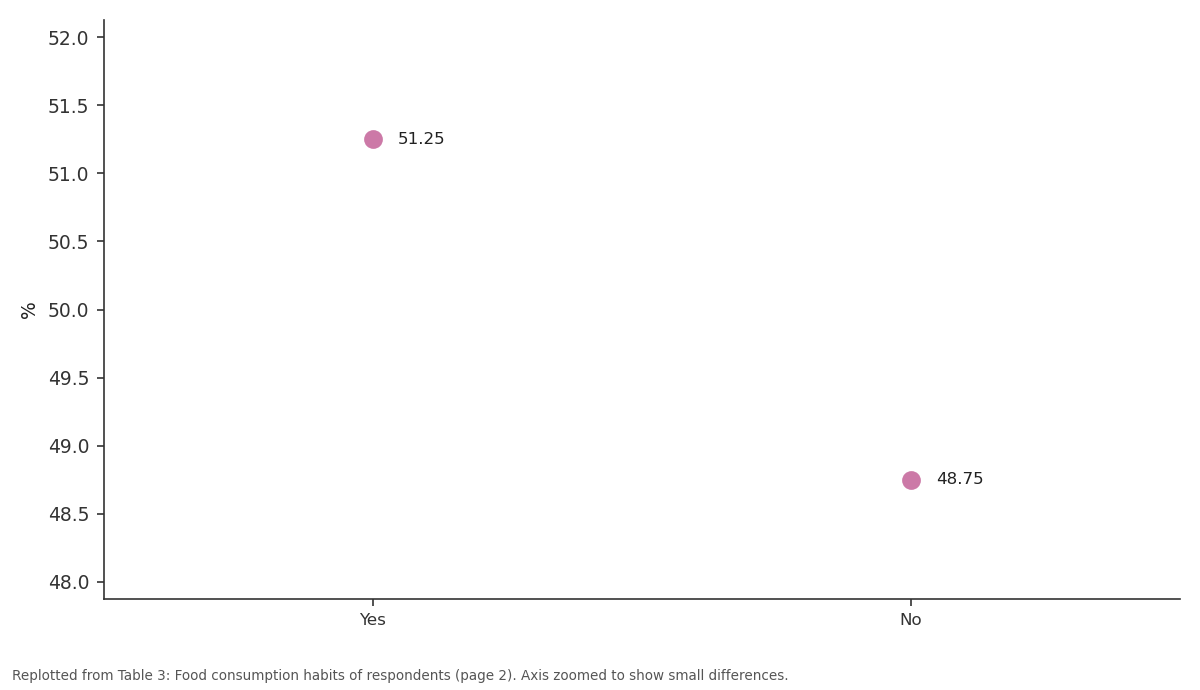
%: Yes vs No
Replotted from Table 3 (page 2) of the original paper. Every bar is the paper's own table value.
View source evidence ↗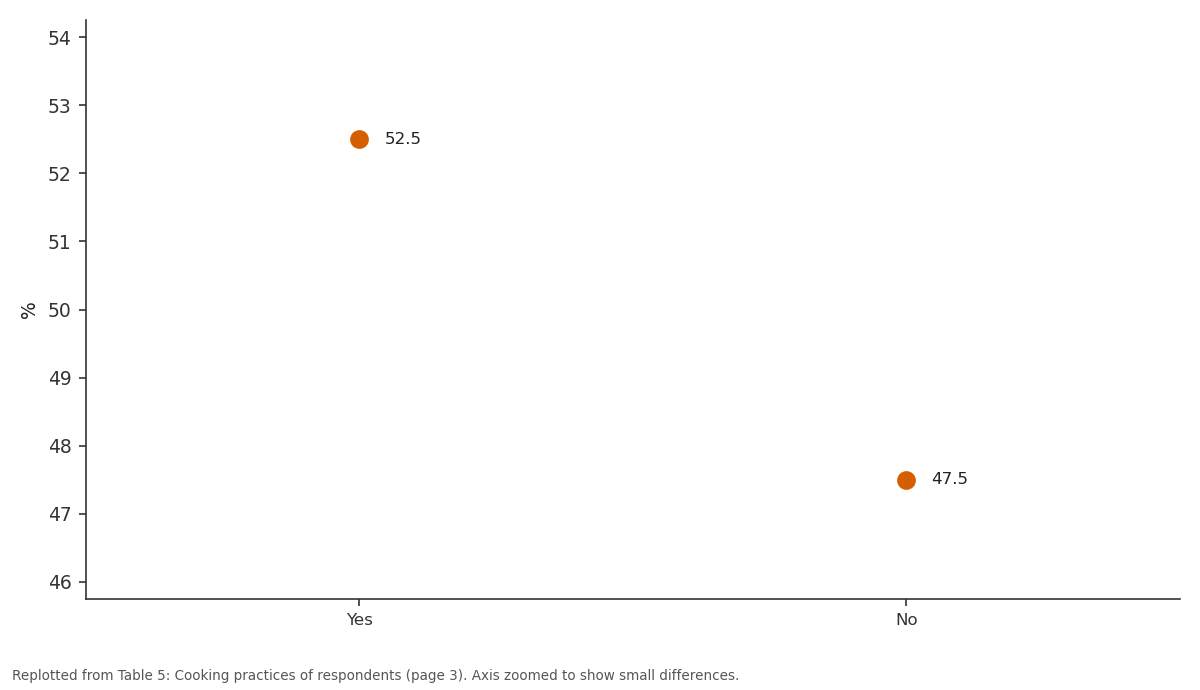
%: Yes vs No
Replotted from Table 5 (page 3) of the original paper. Every bar is the paper's own table value.
View source evidence ↗Figures & tables
From the original paper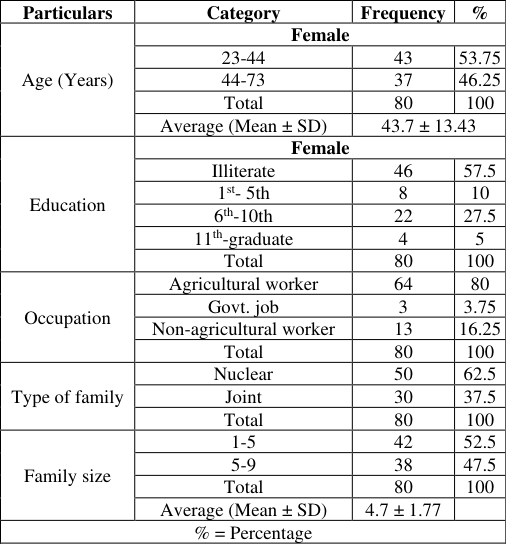 Table 1
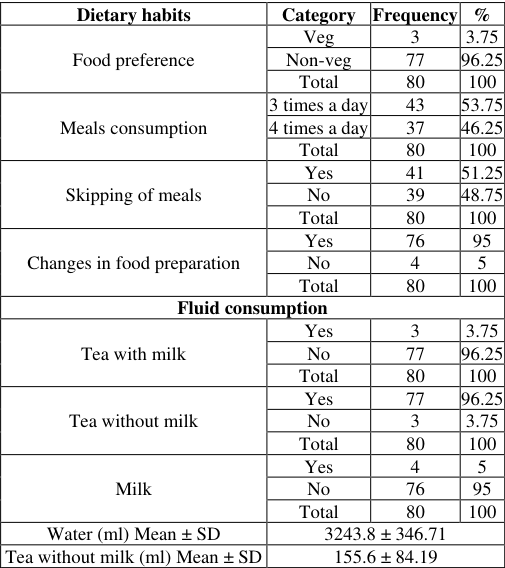 Table 3
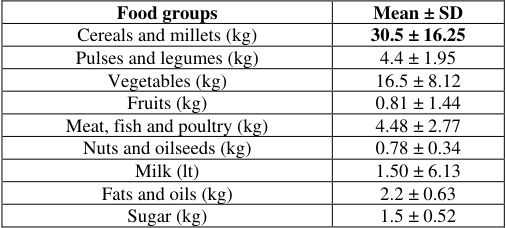 Table 2
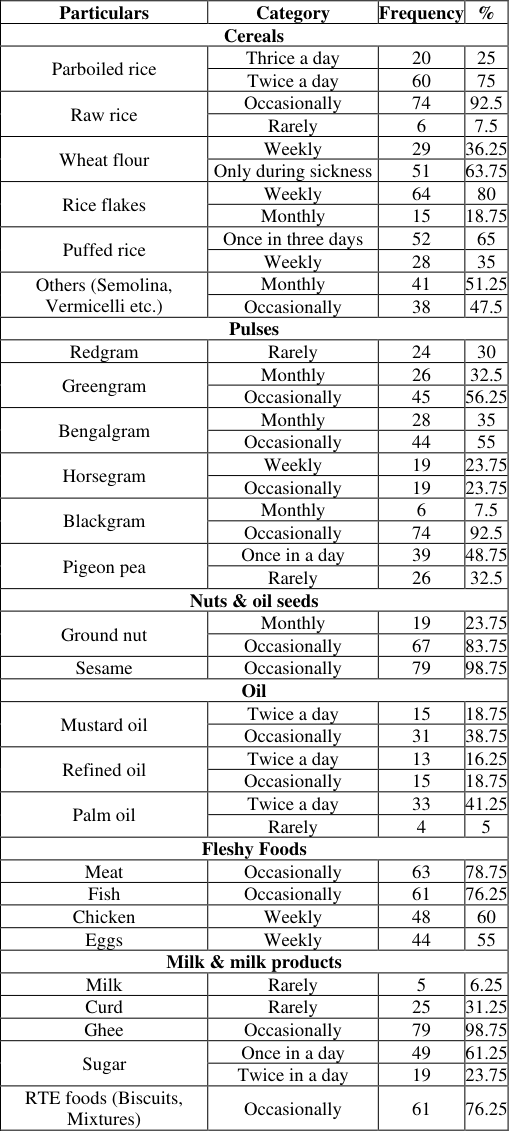 Table 4
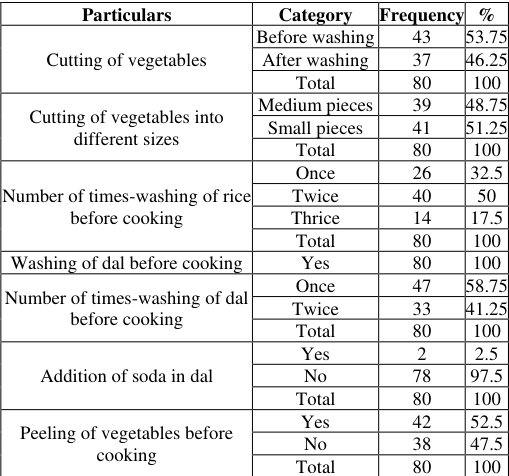 Table 5
Introduction
Odisha is a tribal populated state having a tribal population of 9.59 million, constituting 22.86% of the total population, according to Census, 2011. In Odisha, Kandhamal is one of those districts where the intensity of nutritional problems are very high. More than 50% of the population constitutes ST community and most of them belongs to the Kandha (Khonds) tribe. In Kandhamal poor dietary habits of women were the cause of poor nutrient intake. Wright. L et al. (2017) analysed the dietary patterns and nutritional health of the Mishmi tribes people; and evaluated the cultural beliefs surrounding food and their potential impact on nutritional health. The study revealed that the tribal people were consuming a two-meal pattern diet with high carbohydrate, low fat content, poor in vitamin A, thiamin, riboflavin, niacin, B12, vitamin C, calcium, and iron.
Materials and Methods
The study was conducted in Kandhamal district of Odisha. Kandhamal district was selected by purposive sampling method. By random sampling method total 80 tribal households of Desia Kandha (Desia Khonds) tribe were selected from two different villages (Brenguda and Penala) of Kandhamal. Each 40 households were selected from both the villages of Kandhamal district. Pre-tested questionnaire was prepared for the accumulation of data from the selected households of Kandhamal. Personal interview method was used to collect the general information of the respondents through structured questionnaire. The food intake was analysed by 24 hour recall method using a set of pre standardized vessels. Data regarding the type of preparation, actual ingredients used and amount of food consumed by each respondent were recorded on the scheduled designed for the purpose. Individual consumption of each food stuff was assessed showing appropriate weights of different food stuffs in various vessel sizes. Frequency and percentage were computed to explain the demographic profile of the individuals. Mean and standard deviation were calculated for dietary intake of the individuals.
Results
Results
General information of respondents
By random sampling method total 80 households were selected for the study. Each 40 households were taken from 2 villages. Data were collected from background characteristics of respondents and data has been showed in table 1. It was revealed that 53.75% and 46.25% of women were www.extensionjournal.com belonged to 23-44 years and 44-73 years respectively. There were 57.5% illiterate, 10% were in between class 1 to 5th and 27.5% were in between 6th to 10thand 5.10% were in between 11 th -graduation. Majority of women i.e 80 percent of women were agricultural worker whereas 20% were nonagricultural worker. Families are divided into 2 groups viz., nuclear and joint. The analysis indicated that 62.5% were lived in nuclear family and 37.5% were lived in joint family. It shows that 52.5% families belonged to small family (i.e 1 to 4 members in the family) and 47.5% families belonged to large family (i.e 5 to 9 members in the family).
| Particulars | Category | Frequency | % |
|---|---|---|---|
| Age (Years) | Female | ||
| 23-44 | 43 | 53.75 | |
| 44-73 | 37 | 46.25 | |
| Total | 80 | 100 | |
| Average (Mean ± SD) | 43.7 ± 13.43 | ||
| Education | Female | ||
| Illiterate | 46 | 57.5 | |
| 1st- 5th | 8 | 10 | |
| 6th-10th | 22 | 27.5 | |
| 11th-graduate | 4 | 5 | |
| Total | 80 | 100 | |
| Occupation | Agricultural worker | 64 | 80 |
| Govt. job | 3 | 3.75 | |
| Non-agricultural worker | 13 | 16.25 | |
| Total | 80 | 100 | |
| Type of family | Nuclear | 50 | 62.5 |
| Joint | 30 | 37.5 | |
| Total | 80 | 100 | |
| Family size | 1-5 | 42 | 52.5 |
| 5-9 | 38 | 47.5 | |
| Total | 80 | 100 | |
| Average (Mean ± SD) | 4.7 ± 1.77 | ||
| % = Percentage |
Table text extracted from the original PDF; superscript letters are shown inline. The original table image is below.
View original table image
Average consumption per month of HHs from different food groups
The average intake of cereals and millets was 30.5 ± 16.25 kgs, pulses and legumes was 4.4 ± 1.95 kgs, vegetables was 16.5 ± 8.12, fruits was 0.81 ± 1.44, meat, fish and poultry was 4.48 ± 2.77, nuts and oil seeds was 0.78 ± 0.34 kgs, milk was 1.50 ± 6.13lts, fats and oils was 2.2 ± 0.63 kgs and sugar was 1.5 ± 0.52 kgs.
Food consumption practices
Total 8 groups of food items were given to the subjects and they were expected to answer their frequency of consumption in terms of thrice a day, twice a day, once in three days, occasionally, weekly, only during sickness and rarely. Among cereals majority of subjects (75%) consumed parboiled rice twice a day, raw rice was consumed occasionally by 92.5% of subjects. There were 63.75% subjects consumed wheat flour only during sickness, 80% of subjects consumed rice flakes weekly. Puffed rice was consumed once in three days by 65% of subjects. About 56.25%, 55%, 92.5% of subjects consumed greengram, bengalgram, blackgram occasionally and 48.75% consumed pigeon pea once in a day. Among nuts and oil seeds a total of 83.75%, 98.75% of subjects consumed ground nut, sesame occasionally respectively, 38.75% of subjects consumed mustard oil occasionally and 41.25% consumed palm oil twice a day. From fleshy foods, meat and fish consumed occasionally by www.extensionjournal.com 78.75% and 76.25% of subjects respectively, chicken and eggs consumed weekly by 60% and 55% respectively. Ghee consumed occasionally by 98.75% of subjects, sugar consumed once in a day by 61.25% and RTE foods consumed occasionally by 76.25% subjects. Cooking practices of respondents Among the subjects the cooking practices were different such as 53.75% of subjects followed cutting of vegetables before washing and 46.25% followed cutting of vegetables after washing. There were 48.75%, 51.25% subjects cut the vegetables into medium pieces, small pieces respectively.
Only 32.5% of subjects washed the rice once before cooking and 50%, 17.5% of subjects washed the rice twice, thrice before cooking respectively. All the subjects (100%) washed the dal before cooking, 58.75% and 41.25% of subjects washed the dal for once and twice before cooking respectively. About 97.5% of subjects did not add soda during cooking. Peeling of vegetables before cooking was followed by 52.5% subjects and not followed by 47.5% subjects.
Conclusion
It was found that major percentage of Respondents i.e 53.75% were consumed 3 meals per day and 46.25% were taking 4 meals per day. Most of the Respondents i.e 51.25% were reported to skip meals in a day. It was also revealed that more than half of the respondents were not following the proper cooking practices which causes nutrient loss and leads to poor health conditions. Therefore, for a viable health there is a need of increased food intake and appropriate dietary practices.
Figures and tables from the paper
| Dietary habits | Category | Frequency | % |
|---|---|---|---|
| Food preference | Veg | 3 | 3.75 |
| Non-veg | 77 | 96.25 | |
| Total | 80 | 100 | |
| Meals consumption | 3 times a day | 43 | 53.75 |
| 4 times a day | 37 | 46.25 | |
| Total | 80 | 100 | |
| Skipping of meals | Yes | 41 | 51.25 |
| No | 39 | 48.75 | |
| Total | 80 | 100 | |
| Changes in food preparation | Yes | 76 | 95 |
| No | 4 | 5 | |
| Total | 80 | 100 | |
| Fluid consumption | |||
| Tea with milk | Yes | 3 | 3.75 |
| No | 77 | 96.25 | |
| Total | 80 | 100 | |
| Tea without milk | Yes | 77 | 96.25 |
| No | 3 | 3.75 | |
| Total | 80 | 100 | |
| Milk | Yes | 4 | 5 |
| No | 76 | 95 | |
| Total | 80 | 100 | |
| Water (ml) Mean ± SD | 3243.8 ± 346.71 | ||
| Tea without milk (ml) Mean ± SD | 155.6 ± 84.19 |
Table text extracted from the original PDF; superscript letters are shown inline. The original table image is below.
View original table image
| Food groups | Mean ± SD |
|---|---|
| Cereals and millets (kg) | 30.5 ± 16.25 |
| Pulses and legumes (kg) | 4.4 ± 1.95 |
| Vegetables (kg) | 16.5 ± 8.12 |
| Fruits (kg) | 0.81 ± 1.44 |
| Meat, fish and poultry (kg) | 4.48 ± 2.77 |
| Nuts and oilseeds (kg) | 0.78 ± 0.34 |
| Milk (lt) | 1.50 ± 6.13 |
| Fats and oils (kg) | 2.2 ± 0.63 |
| Sugar (kg) | 1.5 ± 0.52 |
Table text extracted from the original PDF; superscript letters are shown inline. The original table image is below.
View original table image
| Particulars | Category | Frequency | % |
|---|---|---|---|
| Cereals | |||
| Parboiled rice | Thrice a day | 20 | 25 |
| Twice a day | 60 | 75 | |
| Raw rice | Occasionally | 74 | 92.5 |
| Rarely | 6 | 7.5 | |
| Wheat flour | Weekly | 29 | 36.25 |
| Only during sickness | 51 | 63.75 | |
| Rice flakes | Weekly | 64 | 80 |
| Monthly | 15 | 18.75 | |
| Puffed rice | Once in three days | 52 | 65 |
| Weekly | 28 | 35 | |
| Others (Semolina, Vermicelli etc.) | Monthly | 41 | 51.25 |
| Occasionally | 38 | 47.5 | |
| Pulses | |||
| Redgram | Rarely | 24 | 30 |
| Greengram | Monthly | 26 | 32.5 |
| Occasionally | 45 | 56.25 | |
| Bengalgram | Monthly | 28 | 35 |
| Occasionally | 44 | 55 | |
| Horsegram | Weekly | 19 | 23.75 |
| Occasionally | 19 | 23.75 | |
| Blackgram | Monthly | 6 | 7.5 |
| Occasionally | 74 | 92.5 | |
| Pigeon pea | Once in a day | 39 | 48.75 |
| Rarely | 26 | 32.5 | |
| Nuts & oil seeds | |||
| Ground nut | Monthly | 19 | 23.75 |
| Occasionally | 67 | 83.75 | |
| Sesame | Occasionally | 79 | 98.75 |
| Oil | |||
| Mustard oil | Twice a day | 15 | 18.75 |
| Occasionally | 31 | 38.75 | |
| Refined oil | Twice a day | 13 | 16.25 |
| Occasionally | 15 | 18.75 | |
| Palm oil | Twice a day | 33 | 41.25 |
| Rarely | 4 | 5 | |
| Fleshy Foods | |||
| Meat | Occasionally | 63 | 78.75 |
| Fish | Occasionally | 61 | 76.25 |
| Chicken | Weekly | 48 | 60 |
| Eggs | Weekly | 44 | 55 |
| Milk & milk products | |||
| Milk | Rarely | 5 | 6.25 |
| Curd | Rarely | 25 | 31.25 |
| Ghee | Occasionally | 79 | 98.75 |
| Sugar | Once in a day | 49 | 61.25 |
| Twice in a day | 19 | 23.75 | |
| RTE foods (Biscuits, Mixtures) | Occasionally | 61 | 76.25 |
Table text extracted from the original PDF; superscript letters are shown inline. The original table image is below.
View original table image
| Particulars | Category | Frequency | % |
|---|---|---|---|
| Cutting of vegetables | Before washing | 43 | 53.75 |
| After washing | 37 | 46.25 | |
| Total | 80 | 100 | |
| Cutting of vegetables into different sizes | Medium pieces | 39 | 48.75 |
| Small pieces | 41 | 51.25 | |
| Total | 80 | 100 | |
| Number of times-washing of rice before cooking | Once | 26 | 32.5 |
| Twice | 40 | 50 | |
| Thrice | 14 | 17.5 | |
| Total | 80 | 100 | |
| Washing of dal before cooking | Yes | 80 | 100 |
| Number of times-washing of dal before cooking | Once | 47 | 58.75 |
| Twice | 33 | 41.25 | |
| Total | 80 | 100 | |
| Addition of soda in dal | Yes | 2 | 2.5 |
| No | 78 | 97.5 | |
| Total | 80 | 100 | |
| Peeling of vegetables before cooking | Yes | 42 | 52.5 |
| No | 38 | 47.5 | |
| Total | 80 | 100 |
Table text extracted from the original PDF; superscript letters are shown inline. The original table image is below.
View original table image
References
10 in the original paper- Agrawal S. Disadvantageous situation of tribal women and children of Orissa, India: a special reference to their health and nutritional status. Journal of Community Nutrition & Health. 2013;2(1):01-03.
- Bose K, Chakraborty F. Anthropometric characteristics and nutritional status based on body mass index of adult Bathudis: a tribal population of Keonjhar District, Orissa, India. Asia Pac J Clin Nutr. 2005;14(1):80-82.
- Deka S. Health and nutritional status of the Indian tribes of Tripura and effects on education. The International Student Journal. 2011;3(03).
- Gopalan C, Rama Sastri BV, Subramanian SC. Nutritive Value of Indian Foods. National Institute of Nutrition, Indian Council of Medical Research; 1989.
- Indian Council of Medical Research. Nutrient Requirement and Recommended Dietary Allowances for Indians. A Report of the Expert Group of the ICMR www.extensionjournal.com 2010. Hyderabad, India: NIN; c2010.
- Jaiswal A. Nutritional and Health Status Evaluation of Tribes of Uttar Pradesh: An Anthropological Dimension. Glob J Arch & Anthropol. 2018;6(2).
- Jerath SG, Singh A, Bhattacharya A, Ray S, Yunus S, Zodpey SP. Dimensions of nutritional vulnerability: Assessment of women and children in sahariya tribal community of Madhya Pradesh in India. Indian Journal of Public Health. 2013;57(4).
- Jerath SG, Singh A, Kamboj P, Goldberg G, Magsumbol MS. Traditional Knowledge and Nutritive Value of Indigenous Foods in the Oraon Tribal Community of Jharkhand: An Exploratory Crosssectional Study. Ecology of Food and Nutrition. 2015;54:493-519.
- Kshatriya GK, Acharya SK. Gender Disparities in the Prevalence of Undernutrition and the Higher Risk among the Young Women of Indian Tribes. PLoS One. 2016;11.
- Laxmaiah A, Mallikharjuna Rao KM, Kumar HR, Arlappa N, Venkaiah K, Brahmam GNV. Diet and Nutritional Status of Tribal Population in ITDA Project Areas of Khammam District, Andhra Pradesh. J Hum Ecol. 2007;21(2):79-86.