
Research article · 2024 · Full text
International Journal of Advanced Biochemistry ResearchHistomorphometrical studies on the postnatal alterations in the renal corpuscle of Indian domestic pig (Sus scrofa domesticus)
Volume 8(4S) · Pages 453–457 · DOI: 10.33545/26174693.2024.v8.i4sf.1006 ↗
Research areasBirth, Development, and Health
Abstract
Author-writtenHistomorphometrical studies were conducted to measure the growth changes in renal corpuscle (RC) and glomerular size in subcapsular, midcortical and juxtamedullary zones of postnatal porcine kidney. The study was carried out in the Department of Veterinary Anatomy, College of Veterinary Science, Rajendranagar on eighteen pairs of fresh kidney specimens collected from slaughter houses in and around Hyderabad. There was a significant increase in RC diameters in all the three zones as age advanced. Larger RCs were seen in the juxtamedullary zone of groups I and II while no significant change was observed in the mean diameters of RC between the three zones of Group III. There was a significant increase in glomerular diameters in all the three zones with age. The mean diameters of the glomeruli were highest in the Juxtamedullary zone in Groups I and II while there was no significant variation in the mean diameter of glomeruli among the three zones in Group III. Number of RCs decreased as age advanced in the Subcapsular and midcortical zones while there was no significant decrease in number of RCs in the juxtamedullary zone. The renal corpuscles were numerous in the subcortical zones of the kidneys.
Summary
Source-checkedPlain-language reading of the full paper, prepared with AI and checked against the text. Each point links to the authors' own words.
Why it matters
- Newborn kidneys are functionally inefficient, characterized by a low glomerular filtration rate and limited ability to concentrate urine or reabsorb sodium. View evidence ↗
- Understanding how the renal corpuscle changes with age is clinically important because these alterations are linked to declining renal function. View evidence ↗
- Pigs are extensively used in urological research, making anatomical data on their postnatal renal corpuscle changes valuable. View evidence ↗
The question
- The study aimed to measure growth changes in the size of the glomerulus and renal corpuscle across three specific zones of the postnatal pig kidney. View evidence ↗
What they did
- The researchers analyzed eighteen pairs of fresh pig kidneys divided into three age groups: 0-4 weeks, 4-8 weeks, and over 10 weeks. View evidence ↗
- Using light microscopy and micrometers, the study measured the size of the glomerulus and Bowman's capsule in micrometers, and counted the number of renal corpuscles per unit area for Groups II and III. View evidence ↗
- Data analysis was performed using one-way ANOVA and Turkey's HSD test via SPSS Version 16.0. View evidence ↗
What they found
- The diameters of the renal corpuscles and glomeruli increased significantly across all three kidney zones as the pigs aged, with Group III showing the highest values. View evidence ↗
- The number of renal corpuscles per unit area decreased significantly in the subcapsular and midcortical zones when comparing Group III to Group II. View evidence ↗
- Unlike the other zones, the number of renal corpuscles in the juxtamedullary zone remained constant between Groups II and III. View evidence ↗
- The subcapsular zone contained the highest number of renal corpuscles, followed by the midcortical and then the juxtamedullary zones. View evidence ↗
What it means
- The authors conclude that nephrogenesis in pigs proceeds centrifugally, based on the presence of mature glomeruli in the juxtamedullary zone and immature nephrons in the subcapsular zone during early postnatal life. View evidence ↗
- The authors suggest that the observed decrease in the number of renal corpuscles per unit area may be caused by the growth of other cortical components, such as the interstitium and tubules. View evidence ↗
Visual summary
3 visualsIllustrations explain the paper; charts are replotted from the paper's own table values.
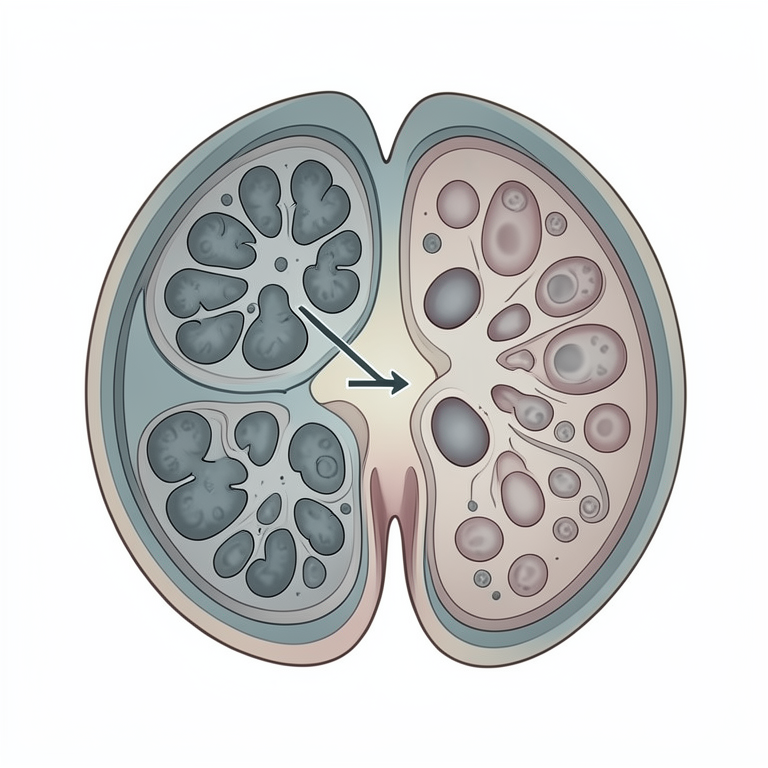
Centrifugal Nephrogenesis Concept
AI-generated conceptual illustration (Indian domestic pig (Sus scrofa domesticus) kidney tissue). It explains the idea and does not show study data.
View source evidence ↗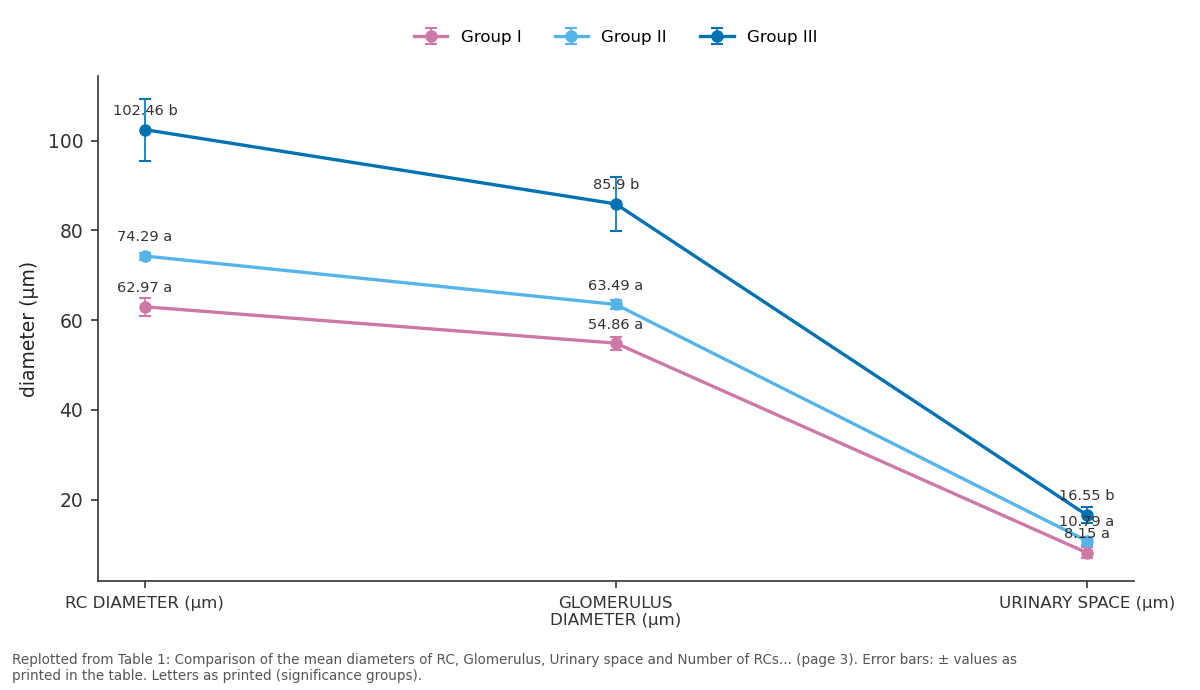
Group I and Group II and more: RC DIAMETER (µm) vs GLOMERULUS DIAMETER (µm) vs URINARY SPACE (µm)
Replotted from Table 1 (page 3) of the original paper. Every bar is the paper's own table value.
View source evidence ↗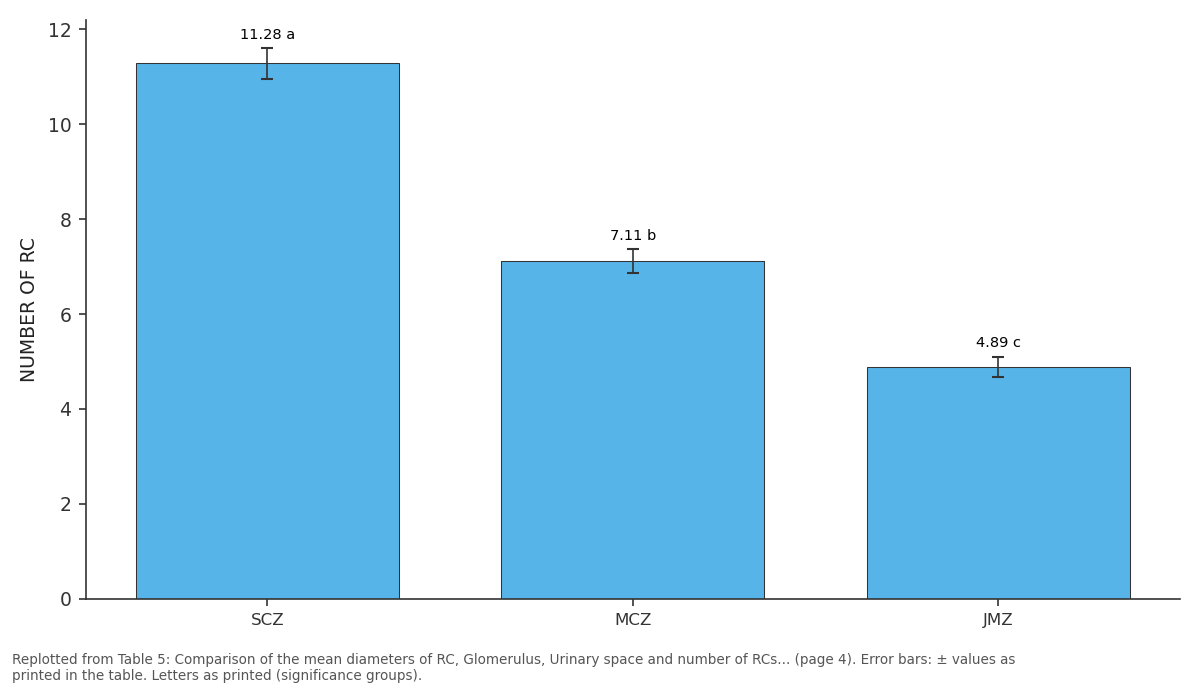
NUMBER OF RC: SCZ vs MCZ vs JMZ
Replotted from Table 5 (page 4) of the original paper. Every bar is the paper's own table value.
View source evidence ↗Figures & tables
From the original paper Table 1
 Table 2
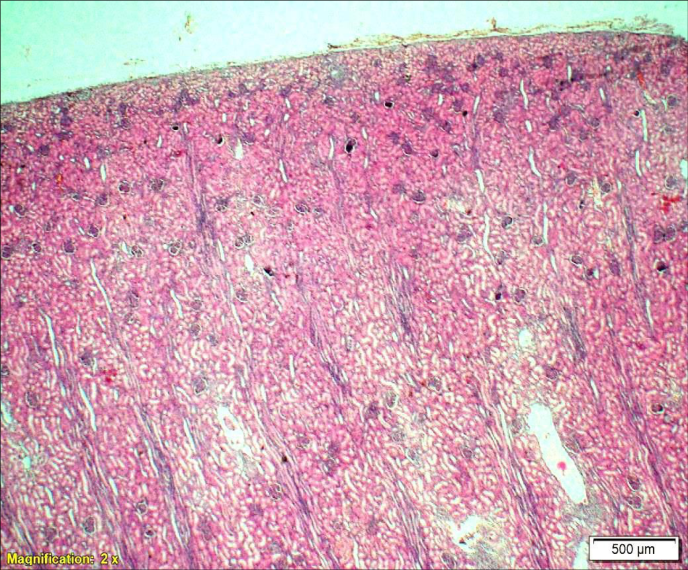 Figure 1
 Table 3
 Table 4
 Table 5
 Table 6
Introduction
The highly stratified mammalian kidney is a vital organ and exhibits significant cellular complexity and functional diversity. The newborn kidney is functionally non-efficient with low glomerular filtration rate, limited capacity to reabsorb sodium and a low ability to concentrate urine. The knowledge of age-related changes in renal corpuscle (RC) has important clinical significance as they are associated with a declining renal function. Future studies may permit manipulation of observed alterations and help in retardation of premature renal aging. The present study was aimed to obtain anatomical information about age related postnatal morphometrical changes of renal corpuscle in the kidney of pig as it is now being used extensively in urological research.
Materials and Methods
The present investigation was carried out in the Department of Veterinary Anatomy, College of Veterinary Science, Rajendranagar, Hyderabad, India. Eighteen pairs of fresh kidney specimens were collected from three age groups viz., Group I (0-4 weeks), Group II (4-8 weeks) and Group III (>10 weeks) of pigs at regular weekly intervals. The following micrometrical observations were made using ocular and stage micrometers under light microscope after routine paraffin processing. 1. Size of the Bowman's capsule in 'µm' was noted in all three zones of renal cortex in all three postnatal groups. 2. Size of the glomerulus in 'µm' was recorded in all three zones of renal cortex in all three postnatal groups.
3. Number of renal corpuscles per unit area was recorded in three zones of Groups II and III.
The collected data was analysed statistically using one way ANOVA and the means were tested for significance by Turkey's HSD test using SPSS (2009) [16] Version 16.0.
The present investigation and its experimental design were approved by the Institutional Animal Ethics Committee vide No.39/24/IAEC-Pig/ C.V.Sc./ Hyd. Dt: 12.06.2021.
Results
The renal corpuscles were arbitrarily divided into subcapsular, mid-cortical and juxtamedullary in position (Fig 1).
Subcapsular zone
The mean diameters of the RCs, glomeruli and urinary space in the subcapsular zone were significantly higher in III Group than in I and II. However, the diameters of the above mentioned parameters showed no significant variation between Groups I and II. The number of renal corpuscles were ennumerated in Groups II and III after the disappearance of nephrogenic zone in which fully formed nephrons were not present. There was a significant decrease in the number of renal corpuscles in Group III compared to Group II (Table 1).
| — | Group I | Group II | Group III |
|---|---|---|---|
| RC DIAMETER (µm) | 62.97±1.97a | 74.29±0.78a | 102.46±6.91b |
| GLOMERULUS DIAMETER (µm) | 54.86±1.43a | 63.49±0.93a | 85.90±5.94b |
| URINARY SPACE (µm) | 8.15±1.27a | 10.79±0.88a | 16.55±1.82b |
| NUMBER OF RC | 11.28±0.33a | 6.5±0.44b |
Table text extracted from the original PDF; superscript letters are shown inline. The original table image is below.
View original table image
Midcortical zone
The mean diameters of the RCs, glomeruli and urinary space in the midcortical zone were higher in Group III than in Groups I and II. No significant variation was observed in the diameters between Groups I and II. However significant decrease was observed in the number of RC per unit area of midcortical region in Group III than in Group II (Table 2).
| — | Group I | Group II | Group III |
|---|---|---|---|
| RC DIAMETER (µm) | 68.75±1.82a | 77.34±1.30a | 112.81±7.80b |
| GLOMERULUS DIAMETER (µm) | 59.55±1.24a | 65.92±1.22a | 94.72±7.18b |
| URINARY SPACE (µm) | 9.20±1.19a | 11.42±0.86a | 18.08±1.68b |
| NUMBER OF RC | 7.11±0.25a | 5.55±0.43b |
Table text extracted from the original PDF; superscript letters are shown inline. The original table image is below.
View original table image
Juxtamedullary zone
Significant increase was observed in the mean diameters of the RCs, glomeruli and urinary space in the juxtamedullary zone in Group III. No significant variation was observed in their diameters between Groups I and II. No significant variation was recorded in the number of RC per unit area between Groups II and III in the juxtamedullary zone. The diameters of RC, glomeruli and urinary space increased in the juxtamedullary zone as age advanced while the number of RCs were constant in the juxtamedullary zone. (Table 3).
| — | GROUP I | GROUP II | GROUP III |
|---|---|---|---|
| RC DIAMETER (µm) | 70.14±1.45a | 80.59±1.24a | 124.28±9.61b |
| GLOMERULUSDIAMETER (µm) | 60.12±0.1a | 68.02±1.13a | 102.40±8.19b |
| URINARY SPACE (µm) | 10.01±1.39a | 12.57±0.97a | 21.88±2.41b |
| NUMBER OF RC | 4.89±0.21a | 4.39±0.14a |
Table text extracted from the original PDF; superscript letters are shown inline. The original table image is below.
View original table image
Group I
Diameter of the RCs varied in the three zones of renal cortex in Group I. The diameters of RCs were significantly higher in juxtamedullary zone in Group I. The diameters of RCs in the midcortical region were comparable with both subcapsular and juxtamedullary zones of Group I. The glomerular diameters were significantly higher in midcortical and juxtamedullary zones when compared to subcapsular zones in Group I. There was no statistically significant variation in the glomerular diameters between midcortical and juxtamedullary zones. However, the urinary space diameter remained constant in all the zones of Group I (Table 4).
| — | SCZ | MCZ | JMZ |
|---|---|---|---|
| RC DIAMETER (µm) | 62.97±1.97a | 68.75±1.82ab | 70.14±1.42b |
| GLOMERULUS DIAMETER (µm) | 54.86±1.43a | 59.55±1.24b | 60.12±0.81b |
| URINARY SPACE (µm | 8.15±1.27a | 9.20±1.19a | 10.01±1.39a |
Table text extracted from the original PDF; superscript letters are shown inline. The original table image is below.
View original table image
Group II
Diameter of the RCs also varied in the three zones of renal cortex of Group II. The diameters of RCs and glomeruli were slightly larger in juxtamedullary zone followed by midcortical and subcapsular zones in Group II. The diameters of RCs and glomeruli in the midcortical zones were comparable with the subcapsular and juxtamedullary zones of Group II. There was no significant variation in the urinary space between the three zones of Group II. The number of RCs per unit area varied significantly among the three zones of Group II. Highest number of renal corpuscle were observed in the subcapsular zone followed by midcortical and subcapsular zones (Table 5).
| — | SCZ | MCZ | JMZ |
|---|---|---|---|
| RC DIAMETER (µm) | 74.29±0.78a | 77.34±1.30ab | 80.59±1.24b |
| GLOMERULUS DIAMETER (µm) | 63.49±0.93a | 65.92±1.22ab | 68.02±1.13b |
| URINARY SPACE (µm) | 10.79±0.88a | 11.42±3.68a | 12.57±0.97a |
| NUMBER OF RC | 11.28±0.33a | 7.11±0.25b | 4.89±0.21c |
Table text extracted from the original PDF; superscript letters are shown inline. The original table image is below.
View original table image
Group III
There was no significant change in the diameter of RCs, glomeruli and urinary space in between the three regions of the renal cortex in Group III. However, the number of RCs per unit area decreased significantly in the juxtamedullary zone of Group III (Table 6).
| — | SCZ | MCZ | JMZ |
|---|---|---|---|
| RC DIAMETER(µm) | 102.46±6.91a | 112.81±7.80a | 124.28±9.61a |
| GLOMERULUS DIAMETER (µm) | 85.90±5.94a | 94.72±7.18a | 102.40±8.19a |
| URINARY SPACE (µm) | 16.55±1.82a | 18.08±1.68a | 21.88±2.41a |
| NUMBER OF RC | 6.5±0.44a | 5.55±0.43ab | 4.39±0.14b |
Table text extracted from the original PDF; superscript letters are shown inline. The original table image is below.
View original table image
Discussion
Kriz and Kaissling (1992) [10] in mammals and Al-Jeboril et al. (2014) [1] in white rabbits divided the RCs into cortical, mid-cortical and juxtamedullary renal corpuscles based on their distribution from capsule to the medulla which is akin to our classification in the present study.
Between zones
The mean diameters of the RCs, glomeruli and urinary space in the subcapsular, midcortical and juxtamedullary zones were significantly higher in Group III than in I and II whereas the diameters of the above mentioned parameters showed no significant variation between Groups I and II. These findings concur with Kittelson (1917) [9] who reported that there was a constant increase in average diameter of renal corpuscles from three weeks to the adult rats. These records further concord with observations of Arataki (1926) [2] , Webb (1968) [17] and Stanchev et al. (2018) [15] who reported that there was a progressive increase in the size of glomeruli with age in both superficial and juxtamedullary regions in rat kidney. In line with these reports, Ichikawa et al. (1979) [8] have also reported that increase in the glomerular surface area available for filtration contributed to the rise in the ultrafiltration coefficient which rises with age in rats. Olivetti et al. (1980) [13] reported that urinary space diameter increased as age advanced in rats. However there was a significant decrease in the number of renal corpuscles in Group III compared to Group II in both subcapsular and midcortical zones which is contrary to findings of Bonvalet et al., (1972) [3] who reported that the number of glomeruli increased markedly until 100 days of age and remained fairly constant afterwards in rat kidneys. However consistent with our observations, Horster et al. (1971) [6] documented that the total number of glomeruli seemingly declined during the postnatal development of kidney due to the increase in cortical volume with age in dogs. No significant variation was recorded in the number of RC per unit area between Groups II and III in the juxtamedullary zone. Similarly, no significant change was observed in the number of corpuscles from three weeks of age to maturity in rats (Kittelson. 1917) [9] and in the developing canine kidney (Eisenbrandt and Phemister 1979) [4] .
Between groups
Diameter of the RCs and glomeruli varied in the three zones of renal cortex in Group I and II while was no significant change was observed in Group III. The diameters of RCs were significantly higher in juxtamedullary zone in Groups I and II. The diameters of RCs in the midcortical region were comparable with both subcapsular and juxtamedullary zones of Group I and II. The glomerular diameters were significantly higher in juxtamedullary zone than in the subcapsular zone of Group I and II. Similar observations were made by Olivetti et al. (1980) [13] in rats Ichii et al. (2006) [7] in rodents, Seal (2019) in guinea pigs and Al-Jeboril et al. (2014) [1] in rabbits. They stated that the juxtamedullary RCs were largest among the three zones. In contrary, Mbassa (1988) [11] reported that superficial renal corpuscles were larger than the juxtamedullary ones in Bos taurus. Yadava and Calhoun (1955) [18] further reported that the glomeruli were larger in juxtamedullary region than the cortical region in the pig, horse, dog, and cat. However, the diameters in midcortical zone was significantly higher than those in the subcapsular zone in Group I while they were comparable with subcapsular and juxtamedullary zones in Group II. There was no statistically significant variation in the glomerular diameters between midcortical and juxtamedullary zones in Group I. There was no significant change in the diameter of RCs, glomeruli and urinary space in between the three regions of the renal cortex in Group III. This is in line with the findings of Olbing et al. (1973) [12] who stated that the glomeruli in the inner zone were larger than those in the outer zone but this difference vanished as the kidney grew in size in dogs. The urinary space diameter remained constant in all the zones of Group I, II and III. In contrary, Olivetti et al., (1980) [13] reported that the bowmans space was higher in renal corpuscles of juxtamedullary zones than the subcapsular and midcortical zones in young and adult rats. The number of RCs per unit area varied significantly among the three zones of Group II and III. Highest number of renal corpuscle were observed in the subcapsular zone followed by midcortical and juxtamedullary zones (Table 5). These findings concurred with the reports of Kriz and Kaissling (1992) [10] in mammals, Al-Jeboril et al., (2014) [1] and Fayez et al., (2014) [5] in rabbits. However these findings disagree with the observations of Horster et al., (1971) [6] who stated that the fraction of total number of glomeruli were lowest in the subcapsular zone and highest in the midcortical zone in dogs.
Conclusion
RC and glomerular diameters in all the three zones increased as age advanced due to increase in demand for filtration. Larger RCs and glomeruli were seen in the juxtamedullary zone of groups I and II. The presence of fully formed larger glomeruli in the juxtamedullary zone and immature nephrons in the subcapsular zone in the early postnatal life confirms that nephrogenesis proceeds centrifugally. There was no significant change in the mean diameters of RCs and glomeruli between the three zones of Group III. Renal corpuscles were numerously detected in the subcortical zones of the kidneys in Groups II and III. Number of RCs decreased as age advanced in the subcapsular and midcortical zones while no significant change was observed in the juxtamedullary zone. Decrease in the number of RCs might be due to the increase in other cortical components like interstitium and other tubular components with age.
Acknowledgement
AcknowledgementI would place on record my gratitude towards P.V Narsimha Rao Telangana Veterinary University, Hyderabad, for providing all the necessities during my investigation to prosecute my Doctorate studies.
References
18 in the original paper- Al-Jeboril JGA, Al-Badri AM, Jassim BA. Study of the anatomical and histomorphological description of the kidney in adult white rabbits female New Zealand strain. World J Pharm. Pharm. Sciences. 2014;3(6):4051.
- Arataki M. On The Postnatal Growth of The Kidney, With Special Reference to the number and size of The Glomeruli (Albino Rat) Am. J Anat. 1926;36(3):399436.
- Bonvalet IP, Champion M, Wanstock F, Berjal G. Compensatory renal hypertrophy in young rats: Increase in the number of nephrons. Kidney Int. 1972;(1):391-402.
- Eisenbrandt DL, Phemister RD. Postnatal Development of the Canine Kidney: Quantitative and Qualitative Morphology. Am. J Anat. 1979;154:179-194.
- Fayez SE, Ahmed AS, Abo-Ghanema II, Elnasharty MA. Morphogenesis of Rabbit Kidney Pre-and Postnatal. Alex. J of Vet. Sci. 2014;41:47-61.
- Horster M, Kemler BJ, Valtin H. Intracortical Distribution of Number and Volume of Glomeruli during Postnatal Maturation in the Dog. J Clin. Investig. 1971;50:796-800.
- Ichii O, Yabuki A, Ojima T, Matsumoto M, Suzuki S. Rodent renal structure differs among species. J Vet. Med. Sci. 2006;68(5):439-445.
- Ichikawa I, Maddox DA, Brenner BM. Maturational development of glomerular ultrafiltration in the rat. Am. J Physiol. 1979;236:465-471.
- Kittelson JA. The postnatal growth of the kidney of the albino rat, with observations on adult human kidney. Anat. Rec. 1917;13(6):385-408
- Kriz W, Kaissling B. Structural organization of mammalian kidney. The kidney: Physiology and pathophysiology. 1992;(2):707-777.
- Mbassa GK. Comparative histology of the kidney of Bos Taurus and Bosindicus cattle. Anat. Histol. Embryol. 1988;17(2):157-163.
- Olbing H, Blaufox MD, Aschinberg LC, Silkalns GI, Bernstein J, Spitzer A, et al. Postnatal changes in renal glomerular blood flow distribution in puppies. J. Clin. Investig. 1973;52:2885-2895.
- Olivetti G, Anversa P, Melissari M, Loud AV. Morphometry of the renal corpuscle during postnatal growth and compensatory hypertrophy. Kidney Int. 1980;17:438-454.
- Seal T. Gross microanatomical studies on the kidneys of postnatal male guinea pigs (Cavia porcellus). Thesis submitted to Tamil Nadu Veterinary and Animal Sciences University, 2019.
- Stanchev S, Iliev A, Malinova L, Landzhov B. The Aging Kidney -A Quantitative Study on Superficial and Juxtamedullary Nephrons in Wistar Rats. Acta Morphol Anthropol. 2018;25:1-2.
- SPSS. Statistical Packages for Social Sciences. 2009 Ver.12 SPSS Inc., Linois, USA.
- Webb DG. The postnatal development of the kidney in the albino mouse. Thesis submitted to the University of Arizona for the degree of Master of Science. 1968, p. 36-41.
- Yadava RR, Calhoun ML. Comparative histology of the kidney of domestic animals. Am. J Vet. Res. 1958;19(73):958-68.