
Research article · 2024 · Full text
International Journal of Agriculture Extension and Social DevelopmentConstruction of a scale for measuring consequences of farmer producer company on its beneficiaries
Volume 7(4) · Pages 435–400 · DOI: 10.33545/26180723.2024.v7.i4f.559 ↗
Research areasAgriculture Market Analysis Ukraine
Abstract
Author-writtenThe present study aimed to develop and standardize a scale to measure the consequences of Farmer Producer Company on its beneficiaries in the Marathwada region. The summated rating method, developed by Likert (1932) and Edwards (1969), was employed for this purpose. Out of 54 statements, 48 were selected based on their t-values, with greater than 1.75 and highest ‘t’ value were finally selected for inclusion in the scale. The reliability of the scale was assessed using the reliability coefficient (Cronbach's alpha), which was found to be 0.83. The validity of the scale was evaluated through expert judgments. The reliability and validity results indicate the consistency and precision of the scale's outcomes. The final set of 48 statements was administered on a five-point continuum, where scores for positive statements ranged from 'Strongly Agree' to 'Strongly Disagree' (5 to 1), and for negative statements, the scoring was reversed.
Summary
Source-checkedPlain-language reading of the full paper, prepared with AI and checked against the text. Each point links to the authors' own words.
Why it matters
- Agriculture is essential for livelihood security in rural India and serves as the backbone of the national economy. View evidence ↗
- A vast majority of Indian farmers, approximately 86%, are classified as small or marginal, typically managing land holdings of 2.00 hectares or less. View evidence ↗
- Farmer Producer Companies (FPCs) are used as tools to help small farmers improve their market participation, productivity, and overall profitability. View evidence ↗
The question
- The study aimed to create and standardize a measurement scale to evaluate the impact of Farmer Producer Companies on their beneficiaries within the Marathwada region. View evidence ↗
What they did
- The researchers used the summated rating method, based on the work of Likert and Edwards, to construct the scale. View evidence ↗
- To test relevancy, 95 initial statements were reviewed by 100 responding judges from various agricultural universities and institutes. View evidence ↗
- The study used the top and bottom 25% of respondents as criterion groups to evaluate the ability of individual statements to differentiate between high and low groups. View evidence ↗
What they found
- Based on relevancy weightage (>0.66), percentage (>66%), and mean score (>2.00), 54 statements were retained from the original 95. View evidence ↗
- The final scale was reduced to 48 statements after selecting those with a 't' value greater than 1.75. View evidence ↗
- The reliability coefficient (Cronbach's alpha) for the scale was determined to be 0.83. View evidence ↗
What it means
- The authors conclude that they have successfully developed a standardized 48-statement tool to measure the impact of FPCs on beneficiaries. View evidence ↗
- The authors recommend the scale as a crucial tool for policymakers to gain insights for informed decision-making regarding agricultural initiatives. View evidence ↗
Visual summary
1 visualsIllustrations explain the paper; they do not show study data.
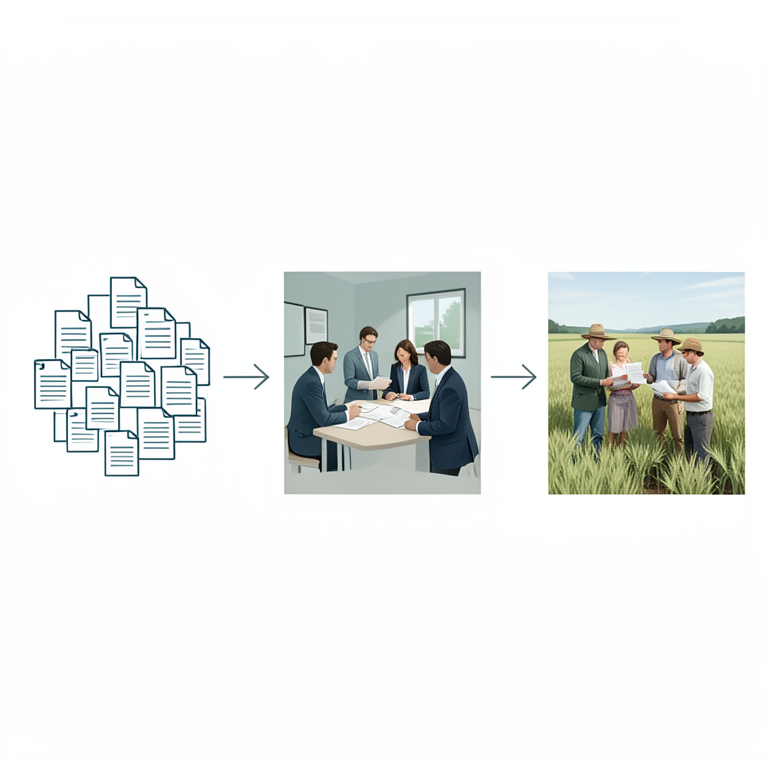
Scale Development Workflow
AI-generated conceptual illustration (Indian farmers and agricultural university experts). It explains the idea and does not show study data.
View source evidence ↗Figures & tables
From the original paper Table 1
 Table 2
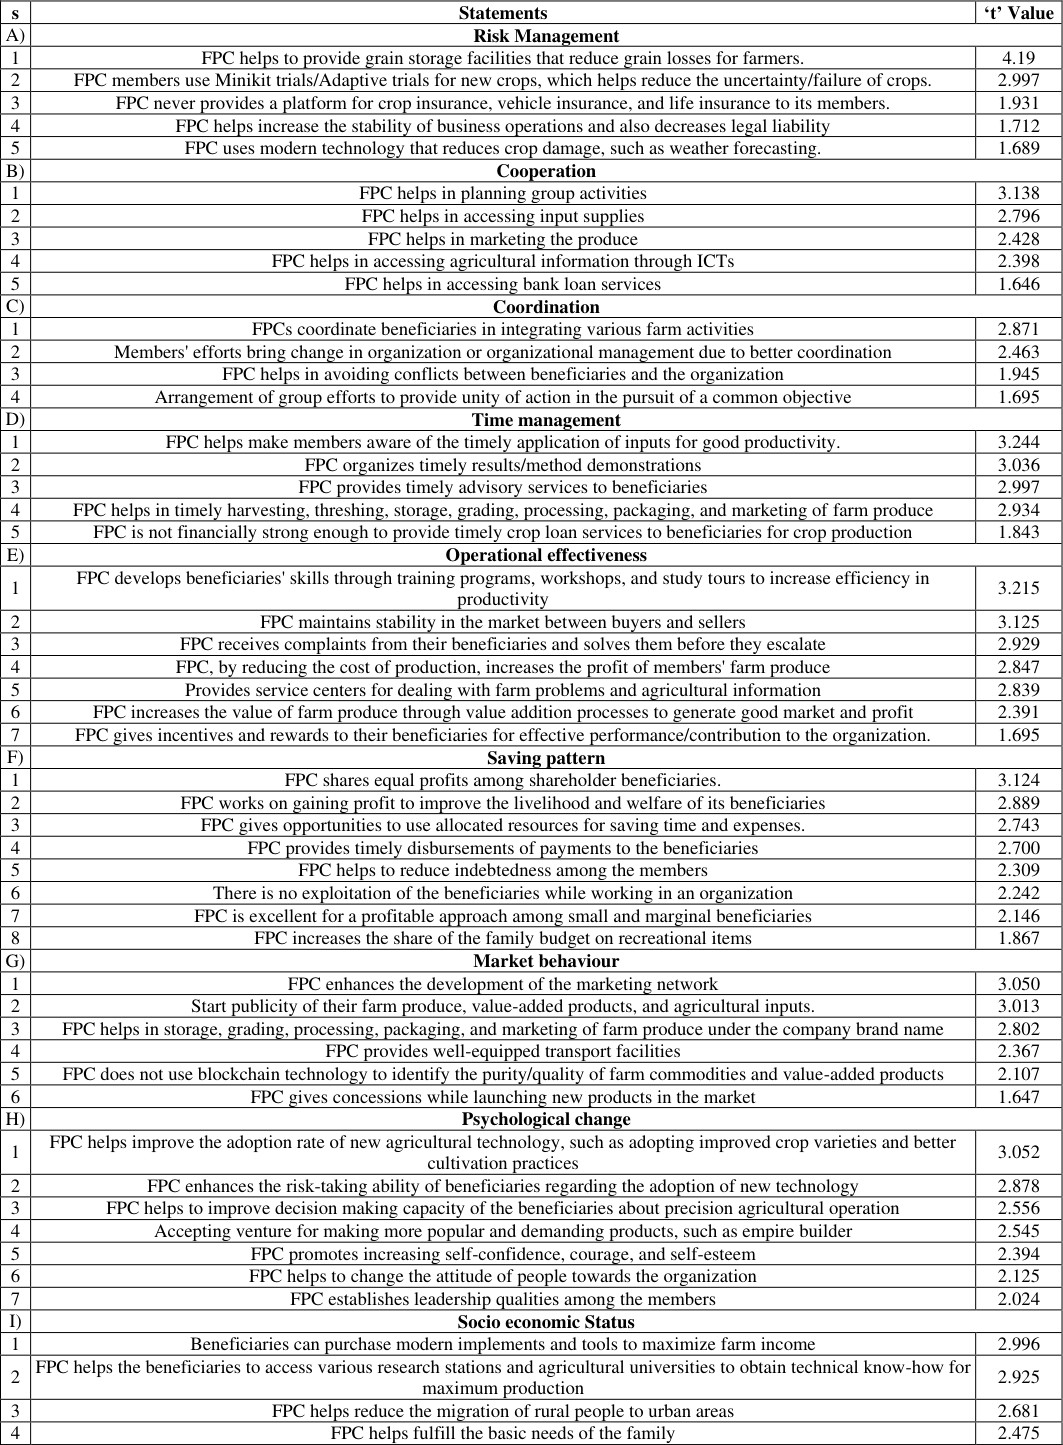 Table 3
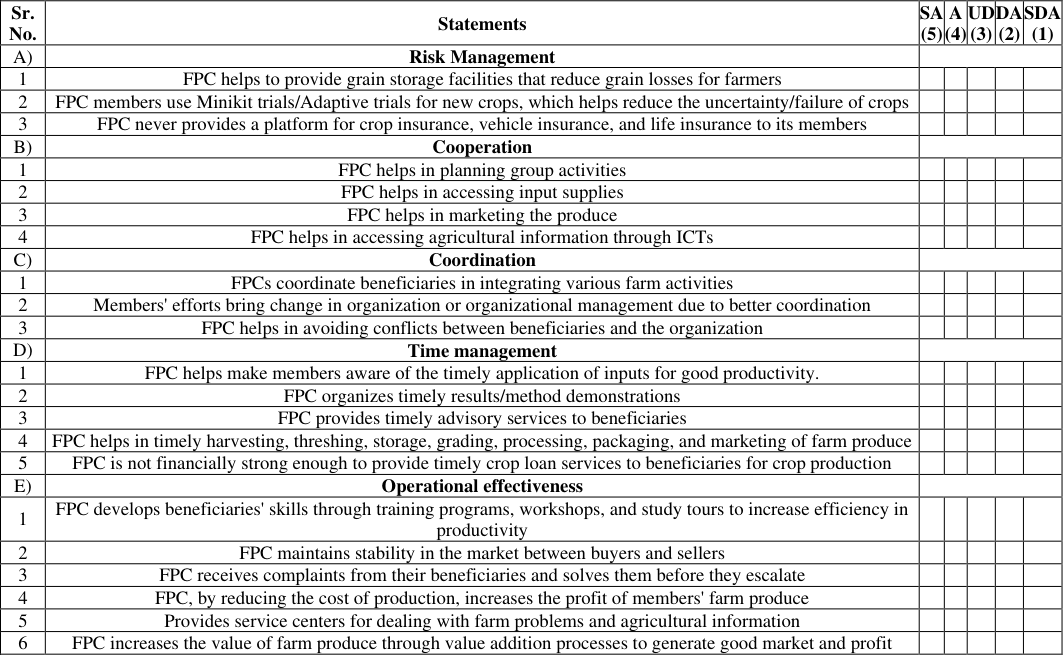 Table 4
Introduction
Agriculture, serving as the backbone of the Indian economy, plays a pivotal role in ensuring livelihood security, especially in rural areas where farm-related sources dominate. Livelihoods in these regions encompass a mix of on-farm and off-farm activities, providing diverse strategies for acquiring both food and cash (Frankenberger, 1998) [3] . This crucial sector contributes a substantial 18.3 per cent to the GDP and offers employment to 58.3 per cent of the country's population (PIB, 2023). In the present context of rapid changes, the agriculture sector in India faces severe challenges such as declining per capita agricultural land availability (due to increased fragmentation of land holdings), a decline in the natural resources base, increased demand for land for non-agricultural purposes due to urbanization and industrialization, and the disinterest of the youth towards agriculture. More than 40.00 per cent of rural youth wish to quit farming. In Indian farming, the majority of farmers are small and marginal. Specifically, 86 per cent of farmers fall into the categories of small farmers (with land between 1.01 ha and 2.00 ha) or marginal farmers (with less than 1.00 ha of land). On average, each of these farmers takes care of about 1.16 ha of land. This smallholding pattern is more noticeable now than ever before in Indian agriculture. Farmers' Producer Company is a powerful tool for small farmers to enhance their participation in the market, leading to improved agricultural production, productivity, and profitability. This collaborative approach addresses key challenges in agriculture by providing small farmers with better access to investments, technology, inputs, and markets. The primary goal of FPO is to ensure that individual farmers can achieve better income by organizing themselves, particularly crucial for those with limited resources to benefit from economies of scale. In the agricultural marketing landscape, FPC mitigates issues arising from a complex chain of non-transparent middlemen, enabling primary producers to receive a more significant share of the value that consumers pay. Through this collective effort, farmers gain the advantages of economies of scale, enhancing their bargaining power with bulk buyers and suppliers. Recognizing that the success of small-scale, resource-poor farmers is closely tied to increased productivity, specialization, and higher income, FPC emerges as a vital catalyst for positive transformation in the agricultural sector (Jose et al, 2023) [4] .
Specific objective of the study
To develop scale to measure consequences of farmer producer company on its beneficiaries
Methodology
An attempt has been made in the present investigation to develop a scale to measure consequences of farmer producer company on its beneficiaries, It refers to consequences are changes that occurrence to an individual or social system as a result of the adoption or rejection of an innovation. The method of Summated Rating suggested by Likert (1932) [5] and Edwards (1969) [2] were followed in the construction of scale. This method was followed through six stages viz., identification of dimensions, collection and edition of items, relevancy test, item analysis, selection of statements and www.extensionjournal.com administration of final scale, reliability and validity.
Identification of Dimensions
Farmer Producer Company is the dimension related to consequences of farmer Producer Company on its beneficiaries in this investigation which is identified based on review of literature and discussion with research guide, expert in the field of extension education.
Collection and edition of items
Ninety five (95) statements expressing the consequences of farmer producer company on its beneficiaries have been collected from available literature, websites and in consultation with research guide, expert in the field of extension education and they were edited on the basis of 14 criterion suggested by Thurstone (1946) [7] , Likert (1932) [5] and Edward (1957) [2] . Out of one hundred thirteen (113) statements, ninety five (95) statements were retained after editing. These statements were found to be non-ambiguous and non-factual.
Relevancy of the statements
The selected 95 statements were sent to 160 judges, including assistant professors, associate professors, scientists, and extension personnel from State Agricultural Universities, Deemed Universities, and National Institutes such as MANAGE and ICAR institutes. They were provided with appropriate instructions to critically judge the items for their relevancy in measuring the consequences of a farmer producer company on its beneficiaries. Each judge was asked to carefully assess the relevance of each statement using a three-point continuum: Most Relevant (MR), Relevant (R), and Not Relevant (NR), with corresponding scores of 3, 2, and 1 respectively. Additionally, their opinion about the inclusion of the statements in the final scale was solicited. A total of 100 judges responded to the appeal and returned the duly filled schedules. Based on the responses received, the relevancy weightage, relevancy percentage, and mean relevancy score for each statement were calculated using the appropriate formulas, and the computed values are presented in Table 1.
| Sr. No. | Particulars | Number of judges contacted | Number of appropriate responses received |
|---|---|---|---|
| 1 | Dean, Head of Extension Education discipline | 22 | 13 (13.00) |
| 2 | Professor/equivalent | 28 | 16 (16.00) |
| 3 | Associate Professor/equivalent | 40 | 20 (20.00) |
| 4 | Assistant Professor/equivalent | 70 | 51 (51.00) |
| Total number of judges = | 160 | 100 (100.00) |
Table text extracted from the original PDF; superscript letters are shown inline. The original table image is below.
View original table image
Selection of Items
The responses of the judges were tabulated, and the data were analyzed to calculate the Relevancy Weightage (RW), Relevancy Percentage (RP), and Mean Relevancy Score (MRS) for all the statements as follows.
Relevancy Weightage
It was obtained by the standard formula which is given below. Where, MRS = Mean Relevancy Score MRR = Most Relevant Response RR = Relevant Response NRR = Not Relevant Response Using these three criteria, the items were screened for their relevancy. Taking into consideration the overall values, items with a relevancy weightage of more than 0.66, a relevancy percentage of more than 66.00 percent, and a mean relevancy score of more than 2.00 were considered for inclusion in the item analysis. Consequently, 54 statements were retained out of the initial 95 statements.
Calculation of 't' value (Item Analysis)
The critical ratio, which is the 't' value measuring the extent to which a given statement differentiates between the high and low groups of respondents for each statement, was calculated using the formula suggested by Edward (1957) [2] . These 54 statements underwent item analysis to determine their relevance in analyzing the consequences of a farmer producer company on its beneficiaries in Maharashtra state. For this, 40 beneficiaries of the FPC were selected from a non-sampling survey area. Warneshwar Agro Producer Company Limited, located at At. Warna Tq. Jintur Dist.
Parbhani, was chosen for the non-sampling survey. From this FPC, four villages were selected based on the maximum number of beneficiaries. Ten beneficiaries were then selected from each of these villages, resulting in a total of 40 respondent beneficiaries for the non-sampling survey. The respondents were asked to provide their responses to each statement on a five-point continuum ranging from 'Strongly agree' to 'Strongly disagree'. The scoring pattern adopted was 5 for a 'Strongly agree' response, 4 for 'Agree', 3 for 'Undecided', 2 for 'Disagree', and 1 for 'Strongly disagree' responses for positive statements. For negative statements, the scoring pattern was reversed. Based on the total scores, the respondents were arranged in descending order. The top 25.00 percent of respondents with their total scores were considered as the high group, while the bottom 25.00 percent were considered as the low group. These two groups were utilized as criterion groups to evaluate individual statements, as suggested by Edwards (1957). Thus, out of the 40 beneficiaries of the FPC to whom the items were administered for item analysis, 10 beneficiaries with the lowest scores and 10 with the highest scores were used as criterion groups for evaluating individual items. The critical ratio, denoted as the 't' value, serves as a measure of the extent to which a given statement distinguishes between the high and low groups of respondents for each statement. This ratio was calculated using the formula proposed by Edward (1957) [2] .
Where, (X H -X H ) 2 After computing the 't' value for all 54 items, statements with a value greater than 1.75 and the highest 't' value were finally selected, resulting in 48 statements for inclusion in the scale. The list of statements and their corresponding 't' values are presented in Table 3.
| s | Statements | ‘t’ Value |
|---|---|---|
| A) | Risk Management | |
| 1 | FPC helps to provide grain storage facilities that reduce grain losses for farmers. | 4.19 |
| 2 | FPC members use Minikit trials/Adaptive trials for new crops, which helps reduce the uncertainty/failure of crops. | 2.997 |
| 3 | FPC never provides a platform for crop insurance, vehicle insurance, and life insurance to its members. | 1.931 |
| 4 | FPC helps increase the stability of business operations and also decreases legal liability | 1.712 |
| 5 | FPC uses modern technology that reduces crop damage, such as weather forecasting. | 1.689 |
| B) | Cooperation | |
| 1 | FPC helps in planning group activities | 3.138 |
| 2 | FPC helps in accessing input supplies | 2.796 |
| 3 | FPC helps in marketing the produce | 2.428 |
| 4 | FPC helps in accessing agricultural information through ICTs | 2.398 |
| 5 | FPC helps in accessing bank loan services | 1.646 |
| C) | Coordination | |
| 1 | FPCs coordinate beneficiaries in integrating various farm activities | 2.871 |
| 2 | Members' efforts bring change in organization or organizational management due to better coordination | 2.463 |
| 3 | FPC helps in avoiding conflicts between beneficiaries and the organization | 1.945 |
| 4 | Arrangement of group efforts to provide unity of action in the pursuit of a common objective | 1.695 |
| D) | Time management | |
| 1 | FPC helps make members aware of the timely application of inputs for good productivity. | 3.244 |
| 2 | FPC organizes timely results/method demonstrations | 3.036 |
| 3 | FPC provides timely advisory services to beneficiaries | 2.997 |
| 4 | FPC helps in timely harvesting, threshing, storage, grading, processing, packaging, and marketing of farm produce | 2.934 |
| 5 | FPC is not financially strong enough to provide timely crop loan services to beneficiaries for crop production | 1.843 |
| E) | Operational effectiveness | |
| 1 | FPC develops beneficiaries' skills through training programs, workshops, and study tours to increase efficiency in productivity | 3.215 |
| 2 | FPC maintains stability in the market between buyers and sellers | 3.125 |
| 3 | FPC receives complaints from their beneficiaries and solves them before they escalate | 2.929 |
| 4 | FPC, by reducing the cost of production, increases the profit of members' farm produce | 2.847 |
| 5 | Provides service centers for dealing with farm problems and agricultural information | 2.839 |
| 6 | FPC increases the value of farm produce through value addition processes to generate good market and profit | 2.391 |
| 7 | FPC gives incentives and rewards to their beneficiaries for effective performance/contribution to the organization. | 1.695 |
| F) | Saving pattern | |
| 1 | FPC shares equal profits among shareholder beneficiaries. | 3.124 |
| 2 | FPC works on gaining profit to improve the livelihood and welfare of its beneficiaries | 2.889 |
| 3 | FPC gives opportunities to use allocated resources for saving time and expenses. | 2.743 |
| 4 | FPC provides timely disbursements of payments to the beneficiaries | 2.700 |
| 5 | FPC helps to reduce indebtedness among the members | 2.309 |
| 6 | There is no exploitation of the beneficiaries while working in an organization | 2.242 |
| 7 | FPC is excellent for a profitable approach among small and marginal beneficiaries | 2.146 |
| 8 | FPC increases the share of the family budget on recreational items | 1.867 |
| G) | Market behaviour | |
| 1 | FPC enhances the development of the marketing network | 3.050 |
| 2 | Start publicity of their farm produce, value-added products, and agricultural inputs. | 3.013 |
| 3 | FPC helps in storage, grading, processing, packaging, and marketing of farm produce under the company brand name | 2.802 |
| 4 | FPC provides well-equipped transport facilities | 2.367 |
| 5 | FPC does not use blockchain technology to identify the purity/quality of farm commodities and value-added products | 2.107 |
| 6 | FPC gives concessions while launching new products in the market | 1.647 |
| H) | Psychological change | |
| 1 | FPC helps improve the adoption rate of new agricultural technology, such as adopting improved crop varieties and better cultivation practices | 3.052 |
| 2 | FPC enhances the risk-taking ability of beneficiaries regarding the adoption of new technology | 2.878 |
| 3 | FPC helps to improve decision making capacity of the beneficiaries about precision agricultural operation | 2.556 |
| 4 | Accepting venture for making more popular and demanding products, such as empire builder | 2.545 |
| 5 | FPC promotes increasing self-confidence, courage, and self-esteem | 2.394 |
| 6 | FPC helps to change the attitude of people towards the organization | 2.125 |
| 7 | FPC establishes leadership qualities among the members | 2.024 |
| I) | Socio economic Status | |
| 1 | Beneficiaries can purchase modern implements and tools to maximize farm income | 2.996 |
| 2 | FPC helps the beneficiaries to access various research stations and agricultural universities to obtain technical know-how for maximum production | 2.925 |
| 3 | FPC helps reduce the migration of rural people to urban areas | 2.681 |
| 4 | FPC helps fulfill the basic needs of the family | 2.475 |
Table text extracted from the original PDF; superscript letters are shown inline. The original table image is below.
View original table image
Reliability
Reliability refers to the precision or accuracy of a measurement or score. A well-made scientific instrument should yield accurate results both at present and over time.
Test-retest method
The final set of 48 statements, representing the consequences of a farmer producer company on its beneficiaries in the Marathwada region of Maharashtra state, was administered on a five-point continuum to a fresh group of 40 beneficiaries who were not included in the original sample. Surya Farmer Producer Company Limited, located at At. Satephal Tq. Basmat Dist. Hingoli, was selected for the test-retest method. From this FPC, four villages were chosen based on the maximum number of beneficiaries. Ten beneficiaries were then selected from each of these villages, resulting in a total of 40 beneficiaries for the test-retest method. After a period of 15 days, the scale was administered again to the same respondents, thus yielding two sets of scores. The 'r' value (0.83) was found to be significant at the 0.01 level of probability, indicating that the consequences of a farmer producer company on its beneficiaries scale was suitable for administration to extension personnel. This suggests that the scale was stable and dependable in its measurement.
Validity of the scale
The validity of a test refers to the accuracy with which it measures what it is intended to measure. In the case of the present scale, its validity was assessed through a content validity test.
Content validity
The content validity of the scale was established in two ways. Firstly, the selection of various main and sub-items for inclusion in the scale was based on an extensive literature review from various studies. Secondly, the opinions of a panel of 100 judges, who were experts in the field of extension education, were obtained to determine whether the suggested items were relevant for inclusion in the scale.
Results and Discussion
The final scale comprises 48 statements. Responses were recorded on a five-point continuum representing "Strongly agree," "Agree," "Undecided," "Disagree," and "Strongly disagree," with scores of 5, 4, 3, 2, and 1 respectively for positive statements, and vice versa for negative statements.
The score for each respondent can be calculated by summing the scores obtained by them on all the items.
Conclusion
The study has successfully developed a practical tool a standardized scale with 48 statements to gauge the impact of farmer producer companies on their beneficiaries. This scale is crucial for policymakers, providing them with valuable insights to make informed decisions. Through rigorous testing, we have identified key items that are reliable, valid, and statistically significant, strengthening the scale's effectiveness. Importantly, the scale can differentiate between different types of farmers, showcasing its ability to measure behavioral aspects accurately. Overall, this development represents a significant stride in understanding the role of farmer producer companies in agriculture, offering a comprehensive framework for decision-makers, researchers, and practitioners to improve agricultural initiatives' effectiveness and sustainability.
Figures and tables from the paper
| Statement | Response Category | — | Low group | — | — | — | High group | — | — |
|---|---|---|---|---|---|---|---|---|---|
| X | f | fX | fX2 | X | f | fX | fX2 | ||
| FPC helps to provide grain storage facilities that reduce grain losses for farmers | Strongly Agree | 5 | 0 | 0 | 0 | 5 | 2 | 10 | 50 |
| Agree | 4 | 0 | 0 | 0 | 4 | 3 | 12 | 48 | |
| Undecided | 3 | 0 | 0 | 0 | 3 | 1 | 3 | 9 | |
| Disagree | 2 | 5 | 10 | 20 | 2 | 4 | 8 | 16 | |
| Strongly Disagree | 1 | 5 | 5 | 5 | 1 | 0 | 0 | 0 | |
| ∑ | 10 | 15 | 25 | ∑ | 10 | 33 | 123 | ||
| nL | ∑XL | ∑XL2 | nH | ∑XH | ∑XH2 |
Table text extracted from the original PDF; superscript letters are shown inline. The original table image is below.
View original table image
References
3 in the original paper- Frankenberger TR, McCaston MK. The household livelihood security concept. Food Nutr Agric. 1998;12(3):30-35.
- Jose AE, Jayalekshmi G, Lade AH, Karde R. Sociopsychological constructs and perceived economic variables on entrepreneurial behavior among Farmer Producer Organization members in Kerala: A comprehensive analysis. Asian J Agric Ext Econ Soc. 2023;41(9):241-250.
- Press Information Bureau, Government of India. Livelihood of farmers. New Delhi, India: Ministry of Agriculture and Farmers Welfare; c2023 [cited 2023]. Available from: https://pib.gov.in/PressReleaseIframePage.aspx?PRID= 1906888
Cited by 1
From OpenAlex, OpenCitations and reference lists read by Scinovex
- Construction of a scale for measuring the level of satisfaction of the members of Farmer Producer Organizations (FPOs)
Harihara Tripathy, Gopika Somanath, Soumya Ranjan Behera, Neethu JS · International Journal of Agriculture Extension and Social Development · 2025
The study aimed to develop and standardize a scale to measure the level of satisfaction of the members of Farmer Producer Organizations (FPOs). The summated rating method, developed by Likert (1932) and Edwards (1969), was used for this purpose. A total of 85 statements related to the level of satisfaction of the members of Farmer Producer Organizations (FPOs) were collected from literature and experts working with FPOs. After editing, 50 statements were retained as clear & non-ambiguous. Out of these, 37 statements were selected based on a relevancy score of over 85%, and finally, a total of