
Research article · 2024 · Full text
International Journal of Agriculture Extension and Social DevelopmentProduction performance and potential of major spices of Northeast Region, India
Volume 7(4S) · Pages 108–112 · DOI: 10.33545/26180723.2024.v7.i4sb.553 ↗
Research areasAgricultural Economics and PracticesAgricultural Science and Fertilization
Abstract
Author-writtenIndia's North East region is known as a significant spice hub. The study was carried out to analyze the growth rate, instability in area and production of spices in NER of India and evaluated the effect of area, yield and their interaction in increasing the production. The result shows that the almost all the states have a positive significant growth rate of spice production in the NER and as well as low to medium instability index. The decomposition analysis showed that the yield effect is more responsible for increasing production of ginger, black pepper and large cardamom with contribution of 49.83 percent, 60.34 percent and 43.36 percent respectively, while for turmeric the area effect (59.9%) has more contribution than the yield effect. With the right emphasis on infrastructure and targeted research, the full potential of the region’s spice can be tapped. Focusing on agro-processing units is crucial for post-harvest management and value addition of products and it is also advised to set up farmer cooperatives and groups both locally and regionally.
Summary
Source-checkedPlain-language reading of the full paper, prepared with AI and checked against the text. Each point links to the authors' own words.
Why it matters
- Spices are high-value commercial crops that contribute significantly to India's agricultural economy. View evidence ↗
- India's Northeast Region (NER) is recognized for the high market demand and export potential of spices such as ginger, turmeric, black pepper, and large cardamom. View evidence ↗
- Cultivating high-value spices in the NER has the potential to significantly increase incomes for small-scale farmers. View evidence ↗
The question
- The study aimed to examine spice production performance in the NER and use decomposition analysis to identify factors that increase production. View evidence ↗
What they did
- The researchers analyzed 10 years of secondary data for four major spices: ginger, turmeric, black pepper, and large cardamom. View evidence ↗
- Data regarding production and area were sourced from the Spices Board of India, state government websites, and 'Spices Statistics at a Glance (2021)'. View evidence ↗
- The study employed Compound Annual Growth Rate (CAGR) analysis and the Cuddy-Della Valle Adjusted Instability Index to measure growth and volatility. View evidence ↗
- Decomposition analysis was used to determine how much of the production increase was due to the area effect, yield effect, or their interaction. View evidence ↗
What they found
- The overall Northeast region experienced moderate growth, with a CAGR of 2.65% for area and 2.38% for production. View evidence ↗
- For ginger production, Manipur showed the highest growth rate at 48.51%, followed by Tripura at 11.9%. View evidence ↗
- Sikkim had the highest significant growth rate in turmeric production at 18.73%. View evidence ↗
- For black pepper, the overall Northeast Region saw growth rates of 1.11% for area and 5.01% for production. View evidence ↗
- Combined growth rates for large cardamom in the Northeast were non-significant, at 4.31% for area and 5.92% for production. View evidence ↗
- Yield was the primary driver for production increases in black pepper (60.34%), ginger (49.83%), and large cardamom (43.36%). View evidence ↗
- Unlike other spices, turmeric production increases were primarily driven by the area effect (59.9%) rather than the yield effect (26.67%). View evidence ↗
What it means
- The authors conclude that government policies should prioritize targeted research and infrastructure development to maximize premium spice production. View evidence ↗
- The authors recommend focusing on agro-processing units to improve post-harvest management and add value to export-potential spices. View evidence ↗
Visual summary
2 visualsIllustrations explain the paper; charts are replotted from the paper's own table values.
Drivers of Spice Production
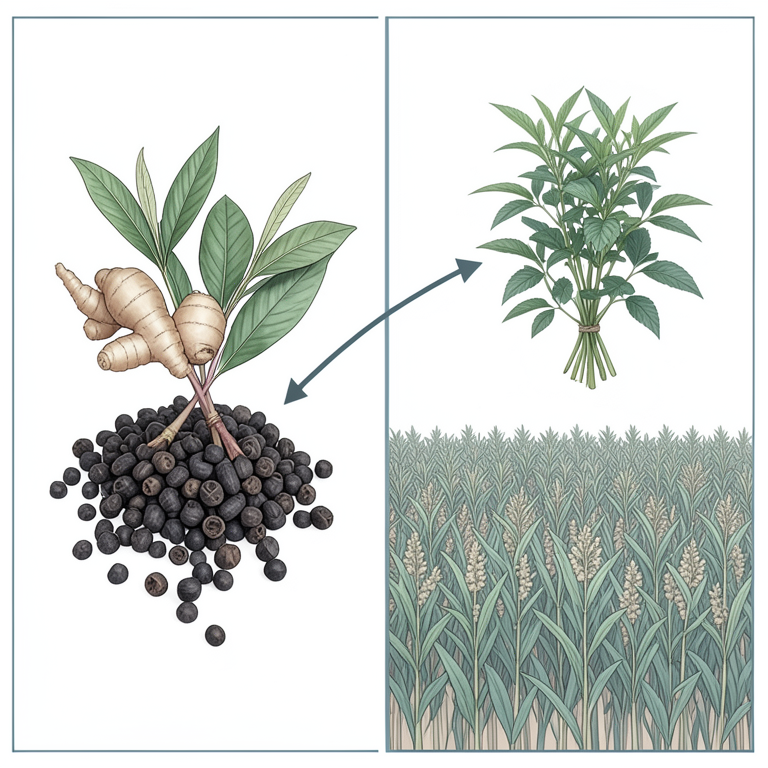
AI-generated conceptual illustration (Ginger, black pepper, large cardamom, and turmeric plants). It explains the idea and does not show study data.
View source evidence ↗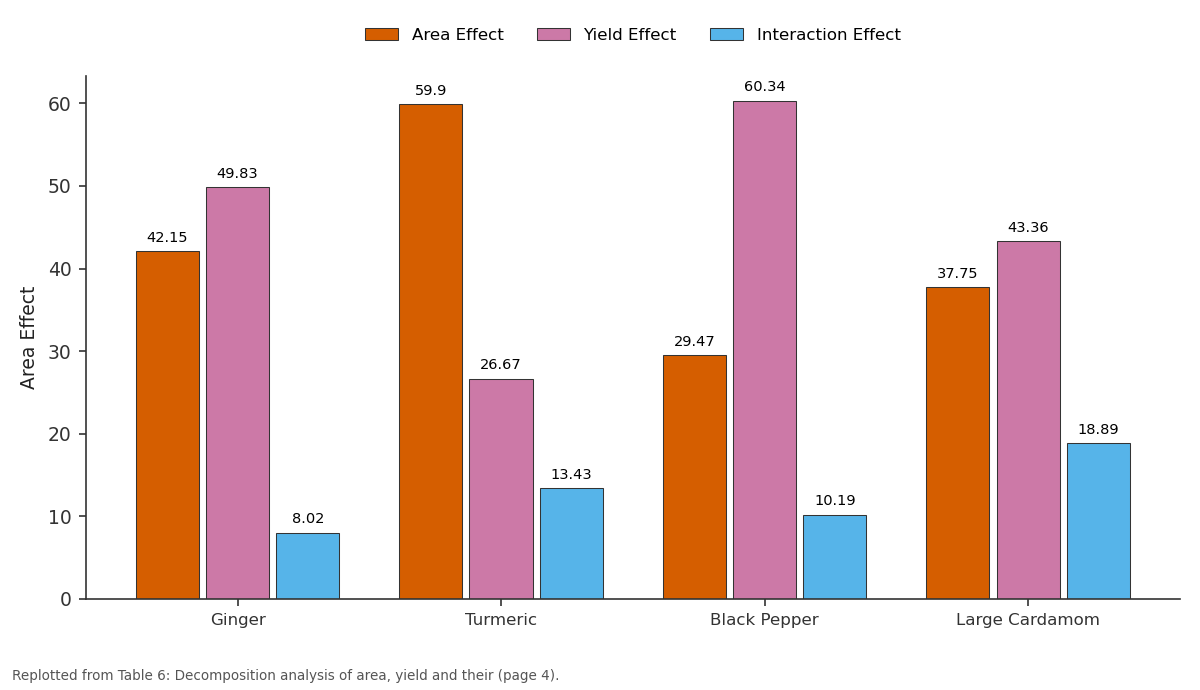
Area Effect and Yield Effect and more: Ginger vs Turmeric vs Black Pepper vs Large Cardamom
Replotted from Table 6 (page 4) of the original paper. Every bar is the paper's own table value.
View source evidence ↗Figures & tables
From the original paper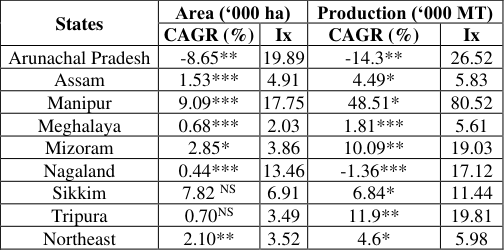 Table 2
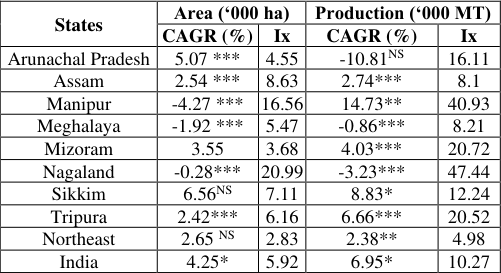 Table 1
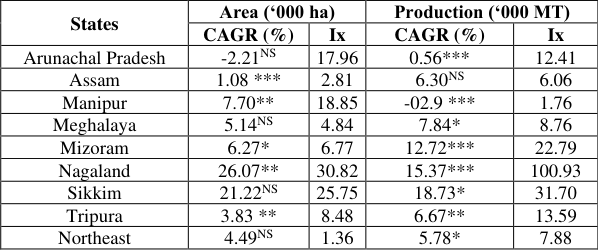 Table 3
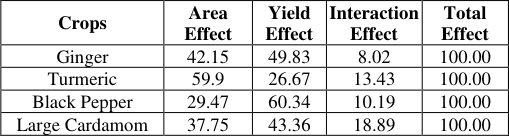 Table 6
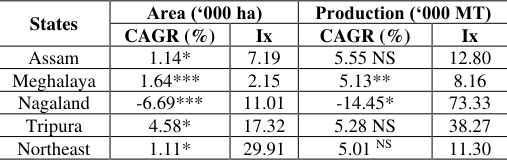 Table 4
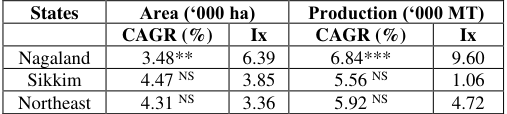 Table 5
Introduction
Spices are high-value commercial crops with low volume, significantly contributing to the agricultural economy of the country Singh et al., 2020 [15] and a highly traded agricultural commodity globally (Thomas and Sanil, 2019) [20] . Spices play a significant role in the economy, domestically and internationally, with India being a major player in production, consumption, and export, contributing significantly to the global market (Sarma et al., 2014; Pradhan, 2018) [12,9] . As the abode of rich spices, India has an age-old trade drive with ancient Chinese and Roman civilizations (Chaitra & Sonnad, 2019) [1] . The International Organization for Standardization lists 109 spices, of which 75 are produced in India and 54 are exported (Joshi et al., 2015) [7] . Spices like ginger, turmeric, cinnamon, and garlic have been found to possess various pharmacological activities, including anti-inflammatory, antioxidant, antibacterial, and antiviral effects (Broek et al., 2018) [22] . Almost all the states in the country produce one spice or another and in 2020-21, India produced around 106.79 lakh MT from an estimated area of 45.28 lakh ha. Among the different states, Rajasthan occupies the largest spice area due to the cultivation of seed spices, followed by Gujarat, Madhya Pradesh, Uttar Pradesh, Karnataka, Andhra Pradesh, Kerala, etc. (Spice Statistics at a Glance, 2021). India's NER comprises of eight states; they include Arunachal Pradesh, Assam, Manipur, Meghalaya, Nagaland, Sikkim and Tripura. The Northeast region's diverse agroclimatic and geophysical features provide ample crop cultivation opportunities (Devi and Raj, 2021) [2] . Assam is the leading producer of spice in the Northeast, followed by Sikkim, Mizoram and Meghalaya. The Northeast Region of India is renowned for its high market demand and export potential of major spices like large cardamom, ginger, turmeric, black pepper, chilli, and bay leaf (Momin et al., 2018) [8] . The region is also well-known for its unique spice crops such as Lakadong turmeric, Bird's eye chilli, Nadia ginger and Naga King chilli (Selvan et al., 2009) [13] . India is the world's largest producer of large cardamom, with more than 85 percent of production in India coming from Sikkim alone (Jha et al., 2017) [6] . The spice production in the NEHR holds excellent potential for commercialization and value-addition (Ralte and Ekhe, 2022) [11] of various valueadded products such as oil and oleoresins, powdered form, paste made from ginger and turmeric, pepper and ginger in brine, turmeric curcumin, as well as capsanthin and capsaicin from chillies (Singh et al., 2024) [16] . Majority of the spices grown in the Northeast region are for domestic consumption, however it is a key contributor to rural household cash incomes. There is wide scope for exports of spices in the region such as ginger, turmeric and large cardamom which were grown organically (Sharma, 2015) [14] . Northeast Region has great potential for cultivating high-value spices, which could greatly increase the income of the small-scale farmers. Therefore, this study was carried out to examine the performance of spice production in Northeast Region and decomposition analysis to analyzed the factors increasing the production of spice. www.extensionjournal.com
Materials and Methods
The study was based on the secondary data collected for the period of 10 years. The major of the Northeast region such as ginger, turmeric, black pepper and large cardamom were selected for the study based on the availability of secondary data. Data on area and production of the major spices were collected from Spices Statistics at a Glance (2021), Spices Board of India and other state government websites and published source.
Statistical analysis Compound annual growth rate analysis
Where, Log y = area, production, productivity, export quantity and export value. a = intercept b = regression coefficient t = year
The percent compound growth rate (g) was derived using the relationship,
Cuddy-Della Valle instability index
In order to measure the instability associated with the rate of increase in area and production of major spices crops in the Northeast Region, Adjusted Instability Index proposed by Cuddy-Della Valle is used.
Decomposition analysis
The effect of area, productivity and their interaction in increasing the production as given by Sharma (2015) [14] was used. The change in production was taken as the effect of three factors such as yield effect, area effect and interaction effect.
Results and Discussion
Table 1 provides the calculated CAGR and Instability Index on the area and production of spices from 2011-12 to 2020-21 for various states in the Northeast Region of India.
| States | Area (‘000 ha) | — | Production (‘000 MT) | — |
|---|---|---|---|---|
| CAGR (%) | Ix | CAGR (%) | Ix | |
| Arunachal Pradesh | 5.07 *** | 4.55 | -10.81NS | 16.11 |
| Assam | 2.54 *** | 8.63 | 2.74*** | 8.1 |
| Manipur | -4.27 *** | 16.56 | 14.73** | 40.93 |
| Meghalaya | -1.92 *** | 5.47 | -0.86*** | 8.21 |
| Mizoram | 3.55 | 3.68 | 4.03*** | 20.72 |
| Nagaland | -0.28*** | 20.99 | -3.23*** | 47.44 |
| Sikkim | 6.56NS | 7.11 | 8.83* | 12.24 |
| Tripura | 2.42*** | 6.16 | 6.66*** | 20.52 |
| Northeast | 2.65 NS | 2.83 | 2.38** | 4.98 |
| India | 4.25* | 5.92 | 6.95* | 10.27 |
Table text extracted from the original PDF; superscript letters are shown inline. The original table image is below.
View original table image
Arunachal Pradesh: The area under spice cultivation in Arunachal Pradesh has decreased by 10.81 percent annually, while production has increased significantly by 5.07 percent annually. The instability index for area was low (4.55) while production showed medium instability (16.11) respectively.
Assam:
The cultivation of spice in Assam showed that both the area and production have showed a significant positive growth rate with CAGR values of 2.54 percent (area) and 2.74 percent (production). The instability index depicted a low instability in both area (8.63) and production (8.1). This indicates steady growth in both area and production of spices in Assam.
Manipur:
The area under spice cultivation in Manipur has decreased slightly with a negative CAGR of 4. 27 percent and whereas production has significantly increased with CAGR values of 14.73 percent. The instability index showed medium to high instability both area and production.
Meghalaya:
The spice cultivation in Meghalaya has a negative growth rate of both area and production with a CAGR of -1.92 percent and -0.86 percent respectively. While the instability index showed low instability for both area and production. Similar findings were reported by Gupta (2022) [3] .
Mizoram: Both area (3.55%) and production (4.03%) have shown positive growth rates, while the instability index showed low instability in area and medium instability in production (20.72).
Nagaland: Similar to Meghalaya, Nagaland also has a negative growth rate of both area and production with a CAGR of -0.28 percent and -3.23 percent respectively. The instability index showed medium to high instability both area (20.99) and production (47.44).
Sikkim: Both area and production have increased, with slightly higher growth rates for production compared to area, as indicated by the positive CAGR values and also low instability index.
Tripura: Both area and production have shown consistent growth, with production increasing at a faster pace (CAGR of 6.66%) compared to the area under cultivation. Similarly, the instability index also showed low instability for both area and production.
Northeast: Overall, the Northeast region shows moderate growth in both area and production of spices, with CAGR values of 2.65 percent and 2.38 percent, respectively. www.extensionjournal.com Likewise, a low instability index for both area and production of spices. The instability index for the area is lowest in the Northeast combined and highest in Nagaland. This shows that there is erratic growth in the area and production of spices in Nagaland, which means that there is presence of high volatility for the same.
Ginger:
The CAGR and instability index of area and production of ginger in Northeast Region from 2011-12 to 2020-21 were calculated and presented in Table 2. It was evident that almost all the states of the region showed a positive and significant growth in area under ginger except Arunachal Pradesh (-8.65%). Similar observation was also reported by Singh et al., (2022) [17] . The highest growth rate in area was seen Manipur (9.09%) followed by Sikkim (7.82%), Mizoram (2.85%), Assam (1.53%), Tripura (0.70%), Meghalaya (0.68%) and Nagaland (0.44%), respectively. Similarly, the same trend was observed in case of production where all the states of the region experienced a positive and significant growth rate except Arunachal Pradesh (-14.3%) and Nagaland (-1.36%). The reason for the declining growth rate in both states may be due to rhizome diseases and soft rot that have affected almost all NER regions (Rahman et al., 2009) [10] . This prompts farmers to abandon ginger cultivation and switch to other commercial crops. The highest growth rate was observed in Manipur (48.51%), Tripura (11.9%), Mizoram (10.09%), Sikkim (6.84%), Assam (4.49%) and Meghalaya (1.81%), respectively. The reason for the high positive growth of ginger in Manipur can be accredited due to the establishment of MOMA (Manipur Organic Mission Agency) for ginger. The instability index was low to medium instability for all the states in NER and Northeast overall, and highest with the exception of Manipur. This shows that the growth rate of ginger in Manipur was unstable and irregular as shown in Table 2.
| States | Area (‘000 ha) | — | Production (‘000 MT) | — |
|---|---|---|---|---|
| CAGR (%) | Ix | CAGR (%) | Ix | |
| Arunachal Pradesh | -8.65** | 19.89 | -14.3** | 26.52 |
| Assam | 1.53*** | 4.91 | 4.49* | 5.83 |
| Manipur | 9.09*** | 17.75 | 48.51* | 80.52 |
| Meghalaya | 0.68*** | 2.03 | 1.81*** | 5.61 |
| Mizoram | 2.85* | 3.86 | 10.09** | 19.03 |
| Nagaland | 0.44*** | 13.46 | -1.36*** | 17.12 |
| Sikkim | 7.82 NS | 6.91 | 6.84* | 11.44 |
| Tripura | 0.70NS | 3.49 | 11.9** | 19.81 |
| Northeast | 2.10** | 3.52 | 4.6* | 5.98 |
Table text extracted from the original PDF; superscript letters are shown inline. The original table image is below.
View original table image
Turmeric:
The CAGR and instability analysis of Turmeric for all the states in the NER is presented in Table 3. The result showed that all the states attained a positive growth rate in area except Arunachal Pradesh (-2.21%). The high production costs may be one of the causes encouraging the farmers to switch to crops with lower production costs. The highest significance growth rate in area was observed in Nagaland (26.07%) followed by Sikkim (21.22%), Manipur (7.70%), Mizoram (6.27%), Meghalaya (5.14%), Tripura (3.83%) respectively. Similarly, Sikkim (18.73%) recorded the highest significant growth rate in production of turmeric followed by Nagaland (15.37%), Mizoram (12.72%), Meghalaya (7.84%), Tripura (6.67%) and Assam (6.30%). Similar observation was also reported by Singh et al., (2022) [17] . The increase in growth can be due to the increase in area during the reference period and implementation of different schemes for horticulture sector (Temsusenla and Konwar, 2022) [19] . While Manipur experienced a negative growth rate of -02.9 percent in production of turmeric. The negative growth can be due to the lack of availability of good planting material or farmer shifting to other commercials crops. The instability index for both area (30.82%) and production (100.93%) were highest in Nagaland and lowest instability index in Northeast as a whole for area (1.36%) and (1.76) in production which shows that the production of turmeric became stable with the passage of time.
| States | Area (‘000 ha) | — | Production (‘000 MT) | — |
|---|---|---|---|---|
| CAGR (%) | Ix | CAGR (%) | Ix | |
| Arunachal Pradesh | -2.21NS | 17.96 | 0.56*** | 12.41 |
| Assam | 1.08 *** | 2.81 | 6.30NS | 6.06 |
| Manipur | 7.70** | 18.85 | -02.9 *** | 1.76 |
| Meghalaya | 5.14NS | 4.84 | 7.84* | 8.76 |
| Mizoram | 6.27* | 6.77 | 12.72*** | 22.79 |
| Nagaland | 26.07** | 30.82 | 15.37*** | 100.93 |
| Sikkim | 21.22NS | 25.75 | 18.73* | 31.70 |
| Tripura | 3.83 ** | 8.48 | 6.67** | 13.59 |
| Northeast | 4.49NS | 1.36 | 5.78* | 7.88 |
Table text extracted from the original PDF; superscript letters are shown inline. The original table image is below.
View original table image
Black Pepper
In Table 4, the CAGR and instability Index of the area and production of black pepper in the Northeast were calculated. The study revealed that Tripura (4.58%) and Meghalaya (1.64%) had the highest positive significant growth in area. Similarly, Assam (5.55%) followed by Tripura (5.28%) experienced highest growth rate in production, both of which are insignificant. Nagaland had a negative significant growth in both area (-6.69%) and production (-14.45%). The declining growth in area can due to small scale of cultivation and decrease in the area leading to the decrease in production. The area and production growth rates in the overall Northeast Region were 1.11 percent and 5.01 percent respectively. In production Nagaland (73.33%) has the highest instability Index, followed by Tripura (38.27%). In area the Northeast Region as a whole (29.91%) had the highest instability index respectively, while the other states had low to medium instability.
| States | Area (‘000 ha) | — | Production (‘000 MT) | — |
|---|---|---|---|---|
| CAGR (%) | Ix | CAGR (%) | Ix | |
| Assam | 1.14* | 7.19 | 5.55 NS | 12.80 |
| Meghalaya | 1.64*** | 2.15 | 5.13** | 8.16 |
| Nagaland | -6.69*** | 11.01 | -14.45* | 73.33 |
| Tripura | 4.58* | 17.32 | 5.28 NS | 38.27 |
| Northeast | 1.11* | 29.91 | 5.01 NS | 11.30 |
Table text extracted from the original PDF; superscript letters are shown inline. The original table image is below.
View original table image
Large cardamom
The CAGR and instability index of area and production of large cardamom in the NER states is presented in Table 5. It was observed that Nagaland and Sikkim reported a positive growth rate for both area and production under large cardamom. Higher growth rate was seen in Nagaland for production (6.84%) and Sikkim showed higher rate for area (4.47%). Similar result was also observed by Gurung and Choubey (2021) [4] . Area and production growth rates in Northeast combined were non-significant at 4.31 percent and 5.92 percent respectively. The instability Index ranged from 1.06 to 18.87 and revealed low to medium instability. The overall instability index indicates how the production of large cardamom stabilized over time. The largest supplier of large cardamom in India is Sikkim and the farming methods used there are entirely organic.
| States | Area (‘000 ha) | — | Production (‘000 MT) | — |
|---|---|---|---|---|
| CAGR (%) | Ix | CAGR (%) | Ix | |
| Nagaland | 3.48** | 6.39 | 6.84*** | 9.60 |
| Sikkim | 4.47 NS | 3.85 | 5.56 NS | 1.06 |
| Northeast | 4.31 NS | 3.36 | 5.92 NS | 4.72 |
Table text extracted from the original PDF; superscript letters are shown inline. The original table image is below.
View original table image
Decomposition analysis
Decomposition analysis was calculated and is shown in Table 6 to determine the proportion contribution of area and yield to the production of spices in the Northeast region.
| Crops | Area Effect | Yield Effect | Interaction Effect | Total Effect |
|---|---|---|---|---|
| Ginger | 42.15 | 49.83 | 8.02 | 100.00 |
| Turmeric | 59.9 | 26.67 | 13.43 | 100.00 |
| Black Pepper | 29.47 | 60.34 | 10.19 | 100.00 |
| Large Cardamom | 37.75 | 43.36 | 18.89 | 100.00 |
Table text extracted from the original PDF; superscript letters are shown inline. The original table image is below.
View original table image
The study showed that all three effects are positive for spices. As a result, area, yield, and their interactions had a favourable impact on the growth of the region's spice production. However, the yield effect had a more significant impact in increasing production in ginger, black pepper, and large cardamom, with respective yield effects of 49.83 percent, 60.34 percent and 43.36 percent respectively. This is may be the result of effective management techniques. However, in the case of turmeric the yield effect only accounts for 26.67 percent of the production of turmeric, the area effect contributes a significant 59.9 percent of the total increase in production. Similar observation was also reported by Singh et al., (2022) [17] .
Conclusion
Spices is an important commercials crop in the all the states of the Northeast Region and many small and marginal farmers depend their livelihood on spices. Therefore, to harness the full potential of spices production in region, government policies should emphasis more on infrastructural development and targeted research to maximize the region's potential for premium spice production. Publicprivate collaboration should be encouraged to increase scientific knowledge in production of important spices across the region. It is also suggested that focus on agro-processing units is crucial for postharvest management and value addition of spice products that have high potential for exports. Training exposure and setting of farmer co-operatives like FPOs and groups both locally and regionally are recommended to be motivated and for sustaining the livelihood of the farmers in the region.
References
22 in the original paper- Chaitra GB, Sonnad JS. Export performance of chilli and cumin from India: An empirical analysis. RJPP. 2019;8(2):2014-2020.
- Devi AR, Raj NM. Spices in North East India: strength and opportunities. Ind. J Arecanut Spices Med Plants. 2021;22(2):3.
- Gupta MD. Growth trend and potential of horticulture in Northeast India. J Hort. Sci. 2022;17(2):530-542.
- Gurung R, Choubey M. Growth and instability analysis of Large Cardamom production in Sikkim. Indian J Hill Farming. 2021;34:17-21.
- Hnamte V, Chatterjee R, Chattopadhyay PK, Pariari A. Spices scenario in the North Eastern States of India with special reference to production and marketing. J Crop Weed. 2012;8(2):109-112.
- Jha AK, et al. Spices for income enhancement in NE Region: needs and focus. Training Manual on Entrepreneurship and Skill Development on Market Driven Production and Processing of High Value Crops www.extensionjournal.com of NEH Region. ICAR Research Complex for NEH Region. 2017:32-41.
- Joshi D, Singh HP, Gurung B. Stability Analysis of Indian Spices Export -A Markov Chain Approach. EA. 2015;60(2):257-262. DOI: 10.5958/09764666.2015.00038.8
- Momin KC, Suresh CP, Singh YS, Momin BC. The promising spices of North East India: India's flavourful contribution to the world. In: Sharangi A, ed. Indian Spices: The Legacy, Production and Processing of India's Treasured Export. Springer, Cham. 2018:47-61.
- Pradhan K. Exploration and Extrapolation of Extension Strategy for Promotion of Spice Production and Processing in India. In: Sharangi A, ed. Indian Spices. Springer, Cham. 2018. https://doi.org/10.1007/978-3319-75016-3_16.
- Rahman H, Karruppaiyan R, Kishore K, Denzongpa R. Traditional practices of ginger cultivation in Northeast, India. Indian J Tradit Knowl. 2009;8(1):23-28.
- Ralte R, Ekhe B. Major spices of North Eastern Hill Region of India: A review. Pharma Innovation Journal. 2022;11(10):437-445.
- Sarma YR, Babu KN, Aziz S. Spices and aromatics. Encyclopedia of Agriculture and Food Systems. 2014:211-234. https://doi.org/10.1016/B978-0-44452512-3.00153-4
- Selvan MT, Cheriyan H, Manojkumar K. Spices production in India-Potential of North Eastern states in Spices production. SYMSAC-V: Harnessing the potential of North Eastern states for spices production. 2009:44-51.
- Sharma A. Trend of area, production and productivity of spices in the Northeastern Region. JOSAC. 2015;24(2):112-118.
- Singh R, et al. Value chain analysis of lakadong turmeric in Meghalya: a micro -level study. Agri Econ Res Rev. 2020;33(2):239-249.
- Singh R, Feroze SM, Kumar S, Singh NA. Organic spices production. Published by: Biotech Books. 2024:1-334.
- Singh SP, et al. Growth, instability and sources of output growth of ginger and turmeric: A state-wise analysis in North East Region of India. Pharma Innovation Journal. 2022;11(2):1429-1435.
- Spices Board of India. Trade Information and Statistics. www.indianspices.com. Accessed on 14 th . 2022.
- Temsusenla Ao S, Konwa D. Production productivities growth trend of major spices in Nagaland; A descriptive study. Int. J Creative Res Thought. 2022;10(8):65-74.
- Thomas L, Sanil PC. Competitiveness in spice export trade from India: a review. JOSAC. 2019;28(1):01-19.
- Tradologie. Spices. https://blog.tradologie.com/agricommodities/spices/. Accessed on Feb 15 th , 2022.
- Van den Broek K, Daniel M, Epple M, Kuhn H, Schaub J, Zielesny A. Spices: a particle-based molecular structure line notation and support library for mesoscopic simulation. J Cheminf. 2018;10:1-10.