
Research article · 2024 · Full text
International Journal of Agriculture Extension and Social DevelopmentExtent of Vulnerability amongst the Farmwomen in Odisha
Volume 7(4) · Pages 292–295 · DOI: 10.33545/26180723.2024.v7.i4d.541 ↗
Research areasAgricultural risk and resilience
Abstract
Author-writtenVulnerability of farmwomen may exist in different aspects of life which may seem susceptible towards further decree or under threat making them living their life under constant pressure. Here in this study, the researcher has endeavoured to generalise these different aspects of threat or challenges considering as the most common vulnerabilities under the given situation. The present study was conducted to assess the extent of vulnerability of farmwomen in Odisha under ten selected variables (Indicators) in three districts with sample size of three hundred respondents. The result indicated that, amongst those variables, the health vulnerability, climatic vulnerability and vulnerability at workplace showed the most alarming vulnerability and need to be taken care of for the upliftment of farmwomen as a whole. All the other variables also showed regressive outcome here.
Summary
Source-checkedPlain-language reading of the full paper, prepared with AI and checked against the text. Each point links to the authors' own words.
Why it matters
- India's economy is heavily agrarian, with approximately 54.6% of the total workforce in agriculture and 80% of rural women employed in this sector. View evidence ↗
- Farmwomen often lack recognition for their work and are denied rights to finance, property, or land, while bearing a disproportionate burden of unpaid labor and dual roles. View evidence ↗
- Vulnerability is defined as a systemic flaw in policy or procedure that makes an individual or organization susceptible to risk. View evidence ↗
The question
- The study aimed to determine the extent and various dimensions of vulnerability among farmwomen in three districts of Odisha. View evidence ↗
What they did
- The researchers purposively selected three districts in Odisha, Debagarh (North), Puri (Central), and Gajapati (South), to represent different administrative zones. View evidence ↗
- Vulnerability was measured across ten dimensions: socio-personal, technological, health, housing/shelter, protection, financial, food, educational, climatic, and workplace. View evidence ↗
- A five-point scale ranging from -2 (Strongly Disagree) to +2 (Strongly Agree) was used to calculate a Vulnerability Index for each of the ten dimensions. View evidence ↗
What they found
- A plurality of respondents reported moderate vulnerability regarding health (46.80%) and technological factors (36.67%). View evidence ↗
- High percentages of respondents perceived positive vulnerability in workplace (99%), climatic (95%), food (81.33%), financial (70.65%), and education (63.68%) dimensions. View evidence ↗
- Moderate vulnerability was specifically noted by 56% of respondents for the workplace and 41.34% for climate. View evidence ↗
- The lowest levels of vulnerability were reported for socio-economic (43.67% perceived no vulnerability) and housing (38.25% perceived no vulnerability) factors. View evidence ↗
- Correlation analysis showed that overall vulnerability was strongly related to socio-personal, housing, health, financial, technological, and workplace factors. View evidence ↗
What it means
- The authors conclude that health, technological, climatic, and workplace vulnerabilities are the most alarming and must be addressed to uplift farmwomen. View evidence ↗
- The study recommends focusing on the root-level challenges faced by women in agriculture instead of solely attempting to improve living standards. View evidence ↗
- The authors state that further research is needed to provide more grounded information and conceptual development on this topic. View evidence ↗
Visual summary
3 visualsIllustrations explain the paper; charts are replotted from the paper's own table values.
Dimensions of Farmwomen Vulnerability
AI-generated conceptual illustration (Indian farmwomen in Odisha). It explains the idea and does not show study data.
View source evidence ↗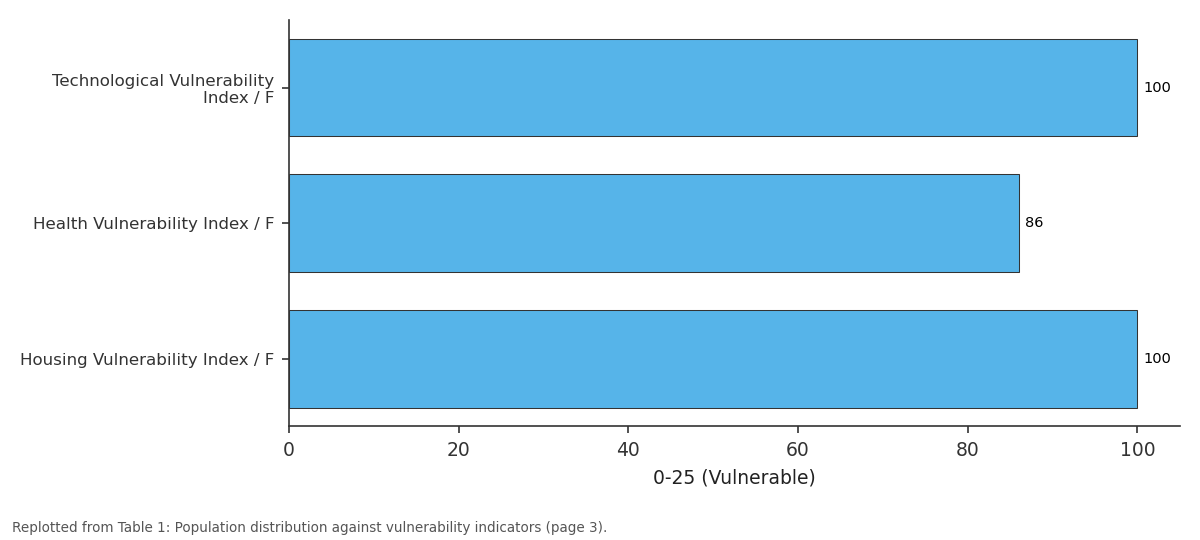
0-25 (Vulnerable): Technological... vs Health Vulnerability... vs Housing Vulnerability...
Replotted from Table 1 (page 3) of the original paper. Every bar is the paper's own table value.
View source evidence ↗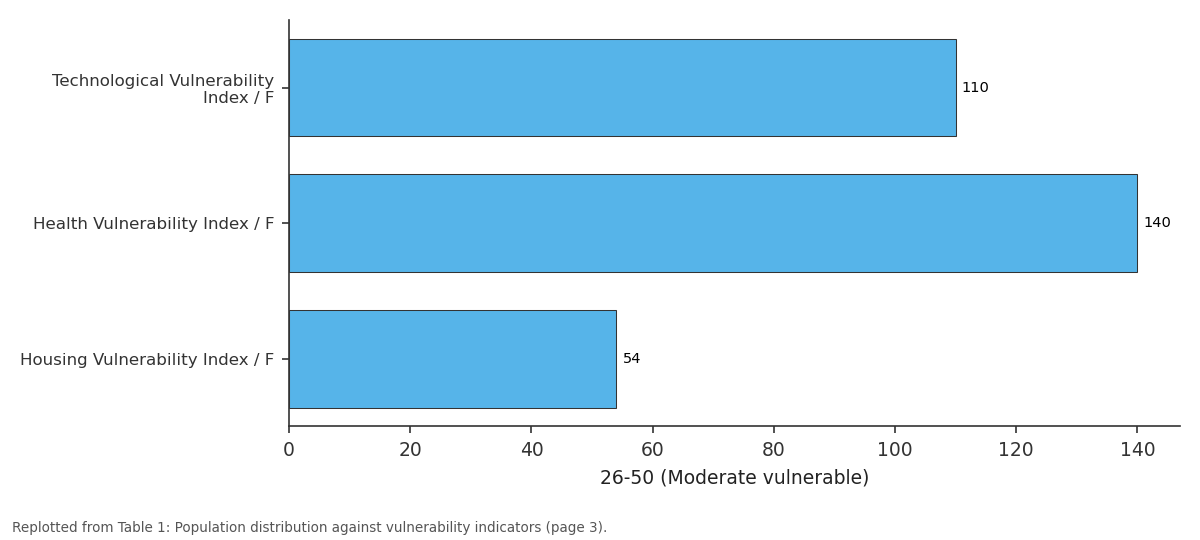
26-50 (Moderate vulnerable): Technological... vs Health Vulnerability... vs Housing Vulnerability...
Replotted from Table 1 (page 3) of the original paper. Every bar is the paper's own table value.
View source evidence ↗Figures & tables
From the original paper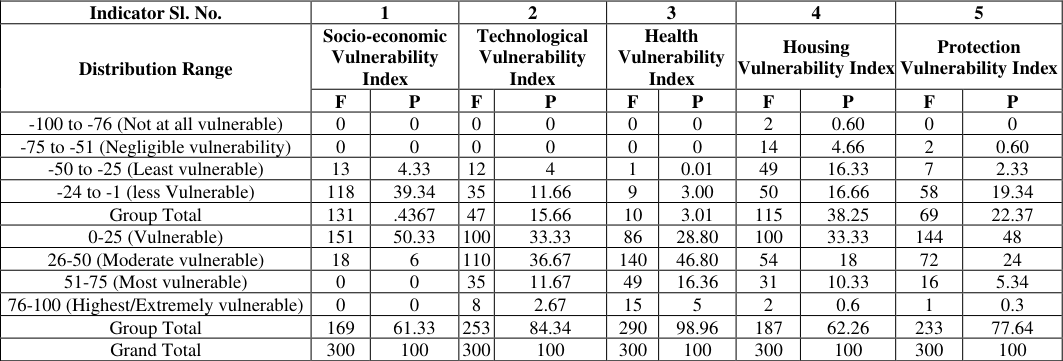 Table 1
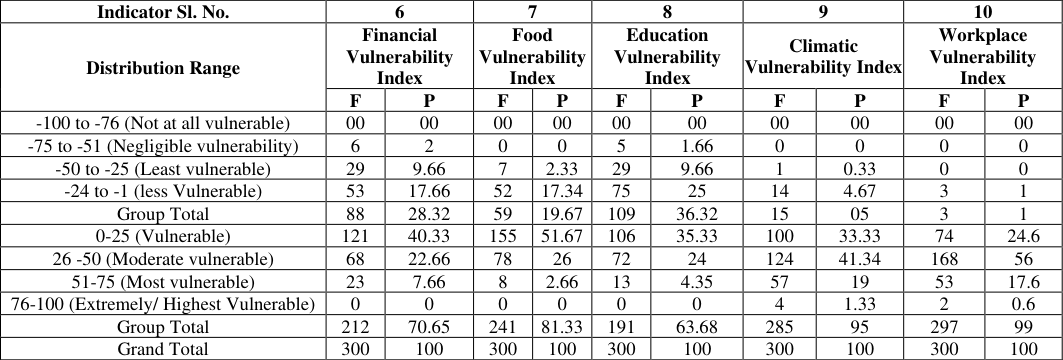 Table 1
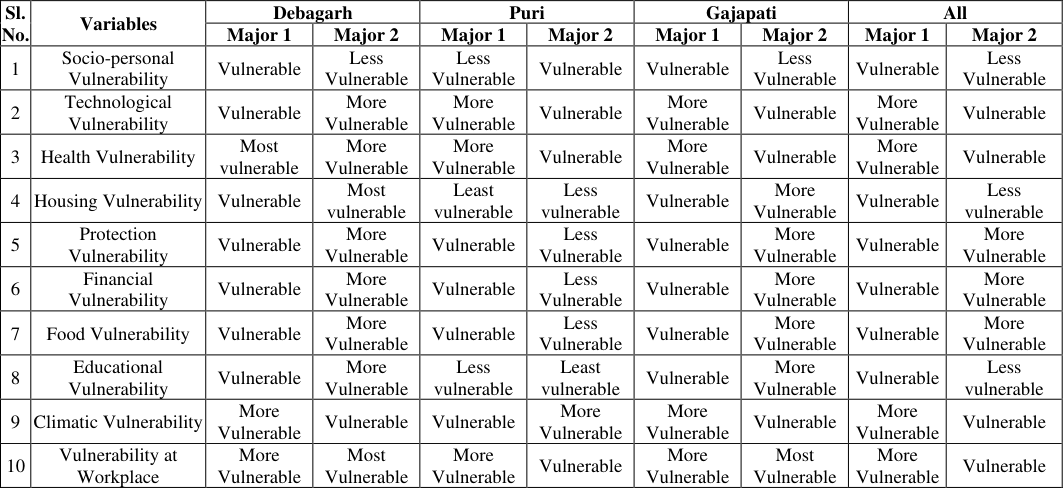 Table 2
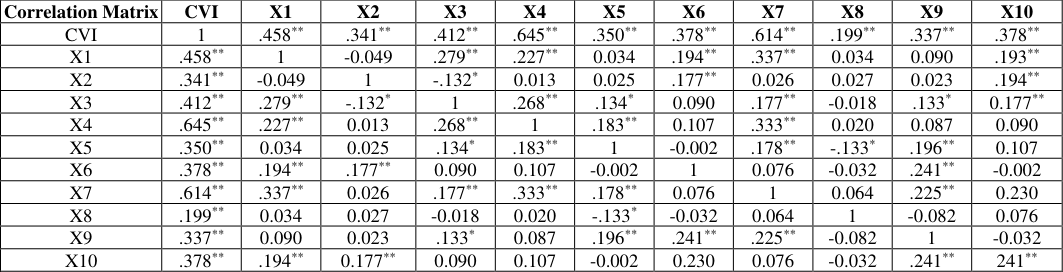 Table 3
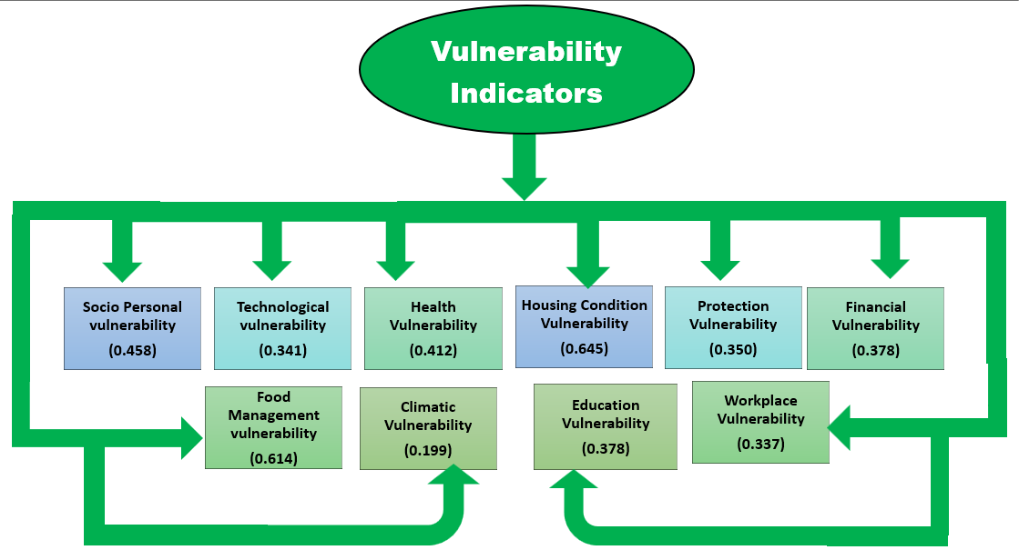 Figure 1
Introduction
India is an agrarian economy with about 54.6 percent of total workforce engaged in agriculture and allied activities as per Census 2011. About 80% rural women are employed in agriculture sector. Moreover, the workforce participation rate for females in rural areas is significantly higher at 41.8 percent whereas urban women participation rate is of 35.31 percent as per the data of MoSPI, 2017. Farm women play very important role in sowing, preparing seeds-beds, transplanting seedlings, thrashing, storing the grains, harvesting, winnowing, picking the cotton pods, shelling the pods, hand thrashing, caring of cattle, scaring the birds, milking, application of fertilizer and transport of water etc. (Devadas, Muthu and Thangamani, 1972) [3] . But unfortunately, the farm-women never get their recognition of their work and due rights in finance, properties or agricultural land. Rather women are disproportionately burdened with dual role for farm and home along with unpaid labour like pre-harvesting and post-harvest activities, livestock management, fetching water and collecting fuel, cooking and taking care of children and other members at home. Farm women lacked of scientific knowledge of farm operations and distance of farms, social bondage and social prestige perceived as constraint by them for their livelihood (Nikhade and Nimje, 1989) [2] . Women in rural area of Bangladesh are considered as a vulnerable group and the poorest of the poor in rural region (Sultana et al. 1990) [5] . Vyas and Nalwaya (2013) [1] revealed that access to financial services can play an important role in reducing farm women's vulnerability and expenditure shock for a holistic improvement in their lifestyle. Vulnerability is a kind of flaw in the system and application, policy or procedure, which makes an organization or individual prone to attack or risk. When measuring the vulnerability of farmwomen; different aspects of life should be critically assessed. The present study has been conducted in three districts of Odisha with the broad objective to ascertain the extent of vulnerability among farm women and different dimensions of it.
Materials and Methods
The study was conducted in three districts of Odisha belonging to three different administrative zones of the state. Three districts namely, Debagarh, Puri and Gajapati (one each from each three administrative Zones of the state of Odisha namely, North, Central and South zone respectively) were selected purposively. From each district two blocks were selected randomly for the study purpose. Fifty farm women were selected randomly from each block making the number of total respondents three hundred. The present research study comes within the purview of "Ex-post-facto" as well as exploratory in nature. Qualitative, quantitative and behavioral attributes of the respondents have been studied with the help of a semi-structured interview schedule. Variables have been measured by using standard social science scale. Suitable statistical tools like, percentage, mean, standard deviation, Index value calculation and correlation have been used for generalization of collected data. www.extensionjournal.com
The Index Value was calculated by the following formula, Index Value = {Score obtained / Score Max} X 100 After calculating the indices, the population has been distributed in eight different class intervals of index value. These are as follows, -100 -76 (not at all vulnerable), -75 to -51 (negligible vulnerability), -50 to -25 (least vulnerable), -24 to -0 (less vulnerable), 0 to 25 (vulnerable), 26 to 50 (moderate vulnerable), 51-75 (most vulnerable) and 76-100 (extremely vulnerable). Vulnerability variable is a regressive indicator for development of farmwomen in our study. Therefore, scoring was done with negative integer and maximum negative score indicated the lowest vulnerability. Here it must be noted that negative affirmations in the form of statements have been framed to indicate the vulnerability level of the sample population. That means if they are strongly agreeing to these sentences, they are extremely vulnerable to the situation. This implies that higher the score or more positive the score indicates more vulnerability while negative score may imply less vulnerability. The vulnerability indicators were assessed through 10 dimensions; those were socio-personal vulnerability, technological vulnerability, health vulnerability, housing / shelter condition vulnerability, protection vulnerability, financial vulnerability, food vulnerability, educational vulnerability, climatic vulnerability and vulnerability at workplace. Vulnerability Index separately for each ten dimensions was calculated for each respondents from their responses against selected statements for each ten dimensions in a five point scale with corresponding score of -2 (Strongly Disagree) to +2 (Strongly Agree) through -1 (Disagree), 0 (Undecided) and +1 (Agree) in between.
Results and Discussion
While presenting the results possible index value has been taken into consideration. In a five-point scale containing -2, -1, 0, +1, +2 scores, the possible index vale will range from -100 to +100. Negative Index value depicts lower level of vulnerability with various degree of scores (intensity) ranging from -100 to 0. On the positive side it can range from 0 to +100. Distribution of respondents in these two basic groups of index values, negative and positive, has been critically studied and results are presented in following tables. The distribution of total respondents against each major dimensions of vulnerability has been presented in table 1. From the negative Index Value group total in table 1 it can be observed that a considerable percentage of respondents perceived no vulnerability (Index Value negative) in case of socio economic (43.67%) and housing vulnerability (38.25%). Table 1 also depicts that 50.33%, 33.33% and 48% of the respondents perceived vulnerable (Index value ranges from 0 to 25) in case of socio-economic, housing and protection aspects. Further, majority of the respondents perceived moderate vulnerability (Index value ranging from 26 to 50) in case of technological (36.67%) and health vulnerability (46.80%); followed by 33.33% and 28.80% perceived vulnerable (Index value ranges from 0 to 25) respectively. Again 33.33% were found perceived vulnerable in case of housing vulnerability followed by 18% perceived moderate vulnerability. In case of protection vulnerability it was found that 48% of the respondent perceived vulnerable followed by 24% perceived moderate level of vulnerability. In case of dimensions like, financial, food, education, climatic and work place related vulnerability; 28.32%, 19.67%, 3.32%, 5% and 1% of the respondents respectively perceived no vulnerability (Index Value negative). However, 70.65%, 81.33%, 63.68%, 95%, and 99% of the respondents perceived financial, food, education, climatic and work place related vulnerability positively with various degree. Majority of the respondents of positive index value group, like, 40.33%, 51.67%, and 35.33% respectively for the dimensions like, financial, food, and education perceived as vulnerable for their livelihood. Moreover, 41.34% & and 56% of the respondents perceived moderate vulnerable in case of climate and work place vulnerability.
| Indicator Sl. No. | 6 | — | 7 | — | 8 | — | 9 | — | 10 | — |
|---|---|---|---|---|---|---|---|---|---|---|
| Distribution Range | Financial Vulnerability Index | Food Vulnerability Index | Education Vulnerability Index | Climatic Vulnerability Index | Workplace Vulnerability Index | |||||
| F | P | F | P | F | P | F | P | F | P | |
| -100 to -76 (Not at all vulnerable) | 00 | 00 | 00 | 00 | 00 | 00 | 00 | 00 | 00 | 00 |
| -75 to -51 (Negligible vulnerability) | 6 | 2 | 0 | 0 | 5 | 1.66 | 0 | 0 | 0 | 0 |
| -50 to -25 (Least vulnerable) | 29 | 9.66 | 7 | 2.33 | 29 | 9.66 | 1 | 0.33 | 0 | 0 |
| -24 to -1 (less Vulnerable) | 53 | 17.66 | 52 | 17.34 | 75 | 25 | 14 | 4.67 | 3 | 1 |
| Group Total | 88 | 28.32 | 59 | 19.67 | 109 | 36.32 | 15 | 05 | 3 | 1 |
| 0-25 (Vulnerable) | 121 | 40.33 | 155 | 51.67 | 106 | 35.33 | 100 | 33.33 | 74 | 24.6 |
| 26 -50 (Moderate vulnerable) | 68 | 22.66 | 78 | 26 | 72 | 24 | 124 | 41.34 | 168 | 56 |
| 51-75 (Most vulnerable) | 23 | 7.66 | 8 | 2.66 | 13 | 4.35 | 57 | 19 | 53 | 17.6 |
| 76-100 (Extremely/ Highest Vulnerable) | 0 | 0 | 0 | 0 | 0 | 0 | 4 | 1.33 | 2 | 0.6 |
| Group Total | 212 | 70.65 | 241 | 81.33 | 191 | 63.68 | 285 | 95 | 297 | 99 |
| Grand Total | 300 | 100 | 300 | 100 | 300 | 100 | 300 | 100 | 300 | 100 |
Table text extracted from the original PDF; superscript letters are shown inline. The original table image is below.
View original table image
| Indicator Sl. No. | 1 | — | 2 | — | 3 | — | 4 | — | 5 | — |
|---|---|---|---|---|---|---|---|---|---|---|
| Distribution Range | Socio-economic Vulnerability Index | Technological Vulnerability Index | Health Vulnerability Index | Housing Vulnerability Index | Protection Vulnerability Index | |||||
| F | P | F | P | F | P | F | P | F | P | |
| -100 to -76 (Not at all vulnerable) | 0 | 0 | 0 | 0 | 0 | 0 | 2 | 0.60 | 0 | 0 |
| -75 to -51 (Negligible vulnerability) | 0 | 0 | 0 | 0 | 0 | 0 | 14 | 4.66 | 2 | 0.60 |
| -50 to -25 (Least vulnerable) | 13 | 4.33 | 12 | 4 | 1 | 0.01 | 49 | 16.33 | 7 | 2.33 |
| -24 to -1 (less Vulnerable) | 118 | 39.34 | 35 | 11.66 | 9 | 3.00 | 50 | 16.66 | 58 | 19.34 |
| Group Total | 131 | .4367 | 47 | 15.66 | 10 | 3.01 | 115 | 38.25 | 69 | 22.37 |
| 0-25 (Vulnerable) | 151 | 50.33 | 100 | 33.33 | 86 | 28.80 | 100 | 33.33 | 144 | 48 |
| 26-50 (Moderate vulnerable) | 18 | 6 | 110 | 36.67 | 140 | 46.80 | 54 | 18 | 72 | 24 |
| 51-75 (Most vulnerable) | 0 | 0 | 35 | 11.67 | 49 | 16.36 | 31 | 10.33 | 16 | 5.34 |
| 76-100 (Highest/Extremely vulnerable) | 0 | 0 | 8 | 2.67 | 15 | 5 | 2 | 0.6 | 1 | 0.3 |
| Group Total | 169 | 61.33 | 253 | 84.34 | 290 | 98.96 | 187 | 62.26 | 233 | 77.64 |
| Grand Total | 300 | 100 | 300 | 100 | 300 | 100 | 300 | 100 | 300 | 100 |
Table text extracted from the original PDF; superscript letters are shown inline. The original table image is below.
View original table image
Consolidated distribution of respondents over different vulnerability indicators
Table 2 depicts the consolidated distribution of respondents over selected ten dimensions of vulnerability separately for three study districts and for the total respondents. This is consolidated on the results presented in table. In this table intensity of vulnerability over ten selected dimensions have been presented in two categories for each district and total; these are Majority 1 and Majority2, on the basis of concentration of respondents over ten dimensions. Highest concentration of respondents (% ge) are represented as Majority 1 with corresponding scale value (e.g. Less Vulnerable, Vulnerable, More vulnerable etc.) and second highest concentration of respondents (% ge) has been considered as Majority 2. From the table it can be observed that perception of the respondents about the extent of vulnerability over ten selected dimensions mostly varies between vulnerable and moderate vulnerable category of vulnerability with little variation at district levels. In most of the cases of different dimensions respondents found to be concentrated in vulnerable and moderate vulnerable as Major 1 and Major 2. That amply says about the dimensions and extent of vulnerability of farm women that restrict themselves from a better livelihood. Vulnerability dimension like, technological, health related, finance and work place vulnerability are the crucial dimensions of overall vulnerability of farm women.
| Sl. No. | Variables | Debagarh | — | Puri | — | Gajapati | — | All | — |
|---|---|---|---|---|---|---|---|---|---|
| Major 1 | Major 2 | Major 1 | Major 2 | Major 1 | Major 2 | Major 1 | Major 2 | ||
| 1 | Socio-personal Vulnerability | Vulnerable | Less Vulnerable | Less Vulnerable | Vulnerable | Vulnerable | Less Vulnerable | Vulnerable | Less Vulnerable |
| 2 | Technological Vulnerability | Vulnerable | More Vulnerable | More Vulnerable | Vulnerable | More Vulnerable | Vulnerable | More Vulnerable | Vulnerable |
| 3 | Health Vulnerability | Most vulnerable | More Vulnerable | More Vulnerable | Vulnerable | More Vulnerable | Vulnerable | More Vulnerable | Vulnerable |
| 4 | Housing Vulnerability | Vulnerable | Most vulnerable | Least vulnerable | Less vulnerable | Vulnerable | More Vulnerable | Vulnerable | Less vulnerable |
| 5 | Protection Vulnerability | Vulnerable | More Vulnerable | Vulnerable | Less Vulnerable | Vulnerable | More Vulnerable | Vulnerable | More Vulnerable |
| 6 | Financial Vulnerability | Vulnerable | More Vulnerable | Vulnerable | Less Vulnerable | Vulnerable | More Vulnerable | Vulnerable | More Vulnerable |
| 7 | Food Vulnerability | Vulnerable | More Vulnerable | Vulnerable | Less Vulnerable | Vulnerable | More Vulnerable | Vulnerable | More Vulnerable |
| 8 | Educational Vulnerability | Vulnerable | More Vulnerable | Less vulnerable | Least vulnerable | Vulnerable | More Vulnerable | Vulnerable | Less vulnerable |
| 9 | Climatic Vulnerability | More Vulnerable | Vulnerable | Vulnerable | More Vulnerable | More Vulnerable | Vulnerable | More Vulnerable | Vulnerable |
| 10 | Vulnerability at Workplace | More Vulnerable | Most Vulnerable | More Vulnerable | Vulnerable | More Vulnerable | Most Vulnerable | More Vulnerable | Vulnerable |
Table text extracted from the original PDF; superscript letters are shown inline. The original table image is below.
View original table image
Correlation amongst vulnerability indicators and cumulative vulnerability index (CVI)
Correlation analysis was employed to find out the association amongst vulnerability index and the concerned ten variables. Most of the vulnerability indicators were found to be strongly contributing towards the result which were significant both at 0.01 level and at 0.05 level. The analysis indicated that vulnerability was greatly impacted and had strong relation with socio-personal vulnerability, housing condition vulnerability, health, financial, technological and workplace vulnerability though all the variables had some impact. The variables were also significantly related to each other as obtained from the result and could be perceived from the following table. A diagram (Figure -1) also represents the relationship in a lucid way. www.extensionjournal.com
Conclusion
Considering the results obtained, amongst the selected variables like, health vulnerability, technological vulnerability, climatic vulnerability and vulnerability at workplace showed the most alarming vulnerability and need to be taken care of for upliftment of the farmwomen as a whole. All the other variables also showed regressive outcome regarding the extent of vulnerability. Therefore, the study suggests looking deeper in to the challenges of women in agriculture at grass root level rather than only improving the standards of living. Further research in this topic is expected by the researcher for bringing more conceptual development and grounded information.
Figures and tables from the paper
| Correlation Matrix | CVI | X1 | X2 | X3 | X4 | X5 | X6 | X7 | X8 | X9 | X10 |
|---|---|---|---|---|---|---|---|---|---|---|---|
| CVI | 1 | .458** | .341** | .412** | .645** | .350** | .378** | .614** | .199** | .337** | .378** |
| X1 | .458** | 1 | -0.049 | .279** | .227** | 0.034 | .194** | .337** | 0.034 | 0.090 | .193** |
| X2 | .341** | -0.049 | 1 | -.132* | 0.013 | 0.025 | .177** | 0.026 | 0.027 | 0.023 | .194** |
| X3 | .412** | .279** | -.132* | 1 | .268** | .134* | 0.090 | .177** | -0.018 | .133* | 0.177** |
| X4 | .645** | .227** | 0.013 | .268** | 1 | .183** | 0.107 | .333** | 0.020 | 0.087 | 0.090 |
| X5 | .350** | 0.034 | 0.025 | .134* | .183** | 1 | -0.002 | .178** | -.133* | .196** | 0.107 |
| X6 | .378** | .194** | .177** | 0.090 | 0.107 | -0.002 | 1 | 0.076 | -0.032 | .241** | -0.002 |
| X7 | .614** | .337** | 0.026 | .177** | .333** | .178** | 0.076 | 1 | 0.064 | .225** | 0.230 |
| X8 | .199** | 0.034 | 0.027 | -0.018 | 0.020 | -.133* | -0.032 | 0.064 | 1 | -0.082 | 0.076 |
| X9 | .337** | 0.090 | 0.023 | .133* | 0.087 | .196** | .241** | .225** | -0.082 | 1 | -0.032 |
| X10 | .378** | .194** | 0.177** | 0.090 | 0.107 | -0.002 | 0.230 | 0.076 | -0.032 | .241** | 241** |
Table text extracted from the original PDF; superscript letters are shown inline. The original table image is below.
View original table image
References
6 in the original paper- Vyas R, Nalwaya N. MFI -A study of socio economic indicators of women SHGs in south Rajasthan with perspective of financial sustainability. Int Mon Ref J Res Manag Technol. 2013;2:65-71.
- Nikhade K, Nimje Y. Regional Variations in Agricultural Employment: An Exploratory Analysis. Econ Polit Wkly. 1989;21(1):9.
- Muthu S, Thomas PS. Participation of Adolescent Girls in Home-Making Activities. Indian J Home Sci. 1972;6(2):77.
- Muthuraja S. Participation of Adolescent Girls in Home-Making Activities. Indian J Home Sci. 1990;6(2):77.
- Swaminanthan MS. Forward of Indian Farming. Takahshi N. Women Wages in Japan and the Question of Equal Pay. Int Labour Rev. 1975;3(1):60-61.
- Shebeer M, Jeesh S. Vulnerable tribal groups in Kerala. South Econ. 2015 Mar;53(21):16-20.