
Research article · 2024 · Full text
International Journal of Advanced Biochemistry ResearchImpact of nitrogen rates and plant population on growth and Phenological parameters of okra [Abelmoschus esculentus (L). Moench]
Volume 8(4) · Pages 382–387 · DOI: 10.33545/26174693.2024.v8.i4e.977 ↗
Research areasAgricultural Practices and Plant GeneticsAgricultural Science and FertilizationAgronomic Practices and Intercropping Systems
Abstract
Author-writtenOkra is one of the most important crops in Madhya Pradesh States. Okra production and yield maximization has not been attained due to lack of appropriate production practices such as optimum plant spacing and fertilizer use. Therefore, the research was conducted to assess the effect of sources of nitrogen and plant population, on growth and yield components of Okra (Abelmoschus esculentus (L). Moench). The treatments were factorial combinations of Six sources of nitrogen (Control, 100% N through urea (150:75:75 NPK/ha), 100% N through vermicompost, 100% N through FYM, 50% N through urea + 50% N through vermicompost and 50% N through urea + 50% N through FYM) four spacings (40 x 30 cm, 50 x 30 cm, 60 × 30 cm and 80 × 30 cm). The experiment was laid out in randomized block design factorial arrangement with three replications. Results indicated that, sources of nitrogen and plant population had significance influence on growth and yield components of okra. Maximum number of branches (2.93), number of leaves (15.95) and pod length (29.01 cm) was obtained from the interaction of sources of nitrogen through 50% N through urea + 50% N through vermicompost and 40 cm × 30 cm spacing. The highest fresh pod yield (46.14 t ha-1) and above ground biomass yield (119.34 t ha-1) was obtained from sources of nitrogen through 50% N through urea + 50% N through vermicompost and 60 cm × 30 cm spacing.
Summary
Source-checkedPlain-language reading of the full paper, prepared with AI and checked against the text. Each point links to the authors' own words.
Why it matters
- Okra is a highly significant crop in the Indian state of Madhya Pradesh. View evidence ↗
- The potential for maximizing okra yield has not been reached because of a lack of optimal fertilizer use and plant spacing practices. View evidence ↗
- Nitrogen is a critical nutrient for okra as it is essential for chlorophyll, proteins, and enzymes, thereby boosting growth and foliage. View evidence ↗
The question
- The study aimed to evaluate how different nitrogen sources and plant populations affect the growth and yield components of okra. View evidence ↗
What they did
- The field experiment took place at AKS University in Satna, Madhya Pradesh, during the Rabi seasons of 2021-2023. View evidence ↗
- The study used a factorial design combining six nitrogen sources (including urea, vermicompost, FYM, and mixed sources) and four plant spacings (40x30, 50x30, 60x30, and 80x30 cm). View evidence ↗
- The researchers employed a randomized block design with three replications for the factorial arrangement. View evidence ↗
- The measured parameters included plant height, the number of leaves and branches per plant, and the time taken to reach 50% flowering. View evidence ↗
What they found
- At 90 days, the maximum plant height (95.11 cm) was achieved using 50% urea + 50% vermicompost at 60x30 cm spacing, while the minimum (70.13 cm) occurred with 100% vermicompost at 80x30 cm spacing. View evidence ↗
- The maximum number of internodes at 90 days (23.73) was observed with 50% urea + 50% vermicompost at 60x30 cm spacing, and the minimum (13.47) with 100% vermicompost at 80x30 cm spacing. View evidence ↗
- The highest number of branches at 90 days (12.98) was recorded for 50% urea + 50% vermicompost at 60x30 cm spacing, while the lowest (6.07) was for 100% vermicompost at 80x30 cm spacing. View evidence ↗
- The fastest time to 50% flowering (42.90 days) was achieved with 50% urea + 50% vermicompost at 60x30 cm spacing, whereas the slowest (49.19 days) was with 100% vermicompost at 80x30 cm spacing. View evidence ↗
What it means
- The authors conclude that optimal nutrient management and plant spacing are essential for promoting the vegetative growth and development of okra. View evidence ↗
- The authors suggest that future research should investigate other factors affecting okra growth to provide more comprehensive agricultural guidelines. View evidence ↗
Visual summary
3 visualsIllustrations explain the paper; charts are replotted from the paper's own table values.
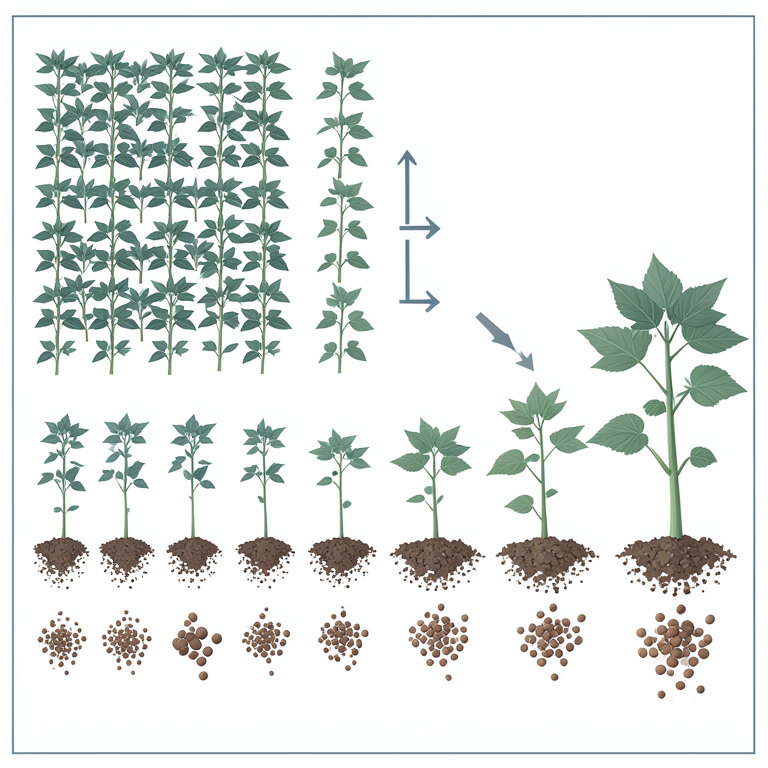
Experimental Setup Concept
AI-generated conceptual illustration (okra plants (Abelmoschus esculentus)). It explains the idea and does not show study data.
View source evidence ↗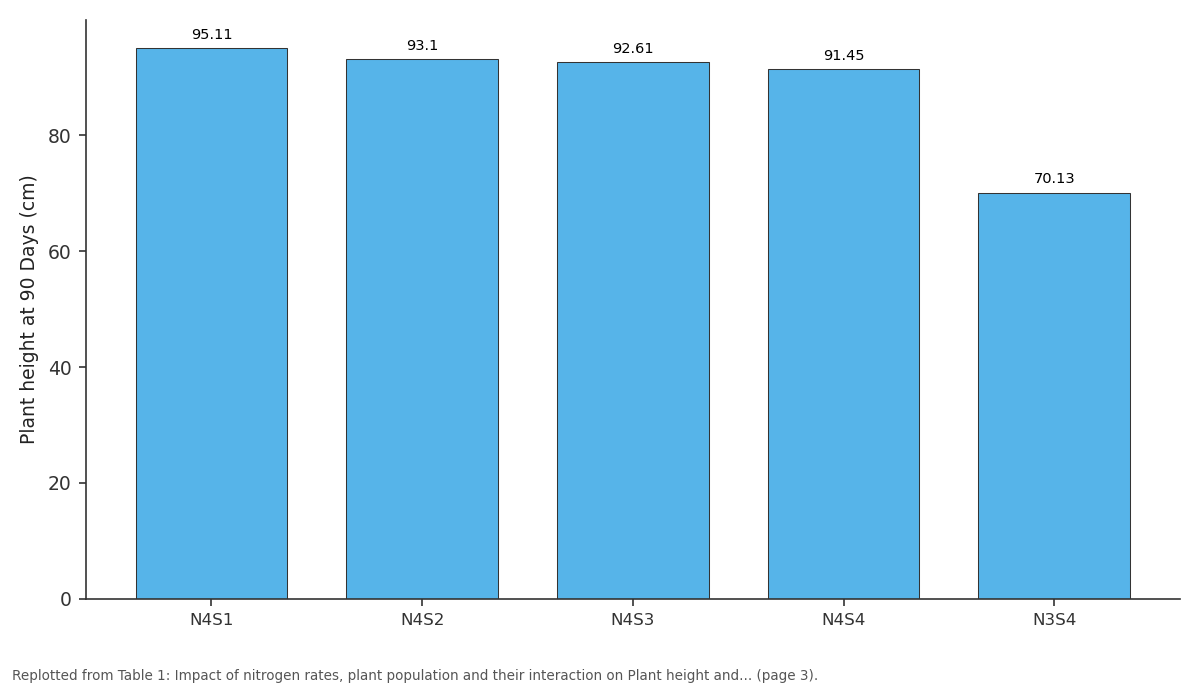
Pooled: N4S1 vs N4S2 vs N4S3 vs N4S4 vs N3S4
Replotted from Table 1 (page 3) of the original paper. Every bar is the paper's own table value.
View source evidence ↗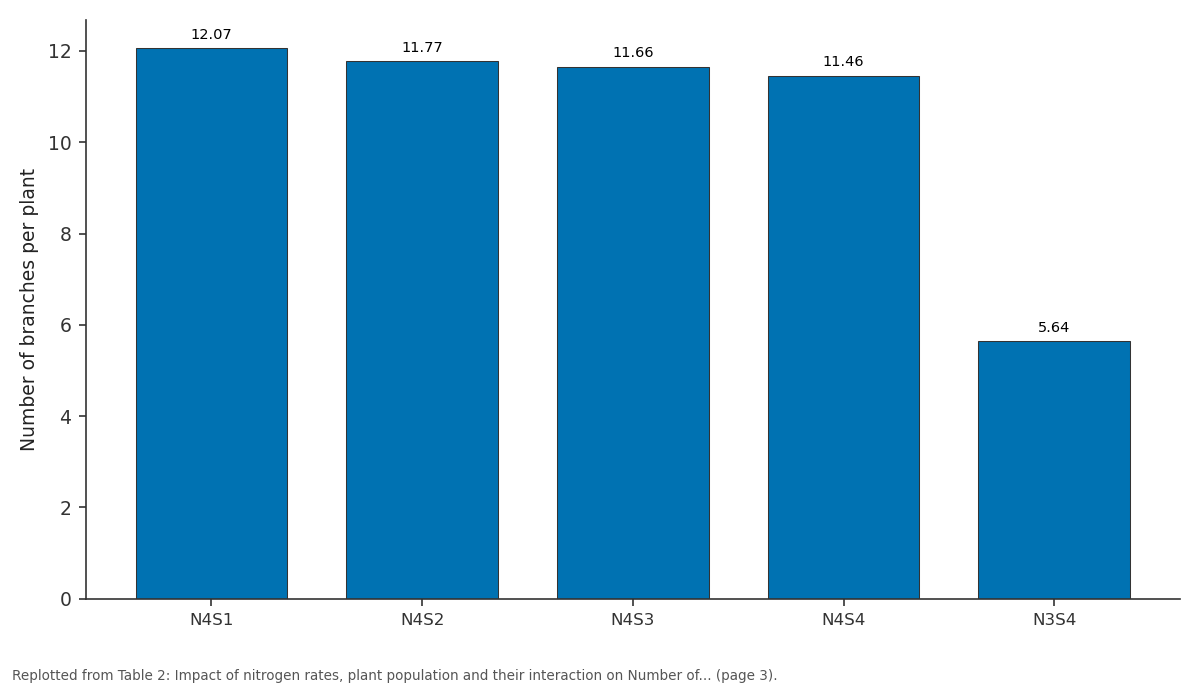
2022-2023: N4S1 vs N4S2 vs N4S3 vs N4S4 vs N3S4
Replotted from Table 2 (page 3) of the original paper. Every bar is the paper's own table value.
View source evidence ↗Figures & tables
From the original paper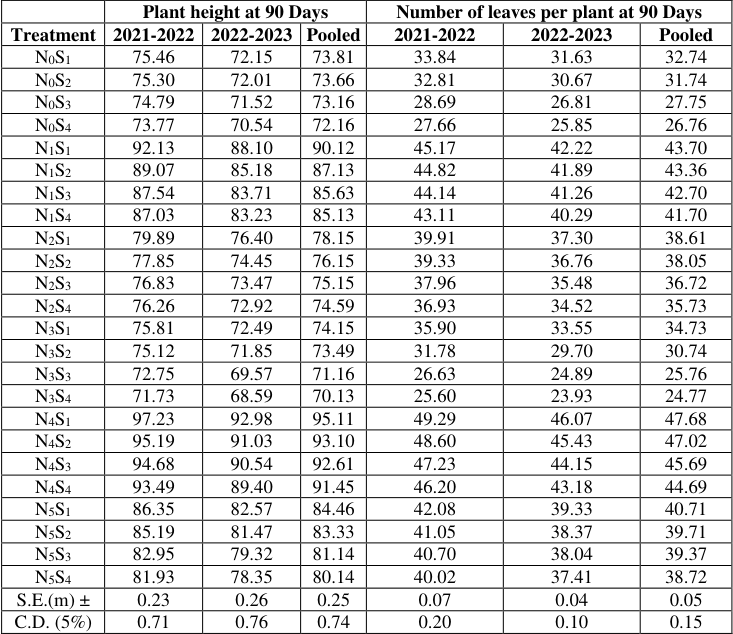 Table 1
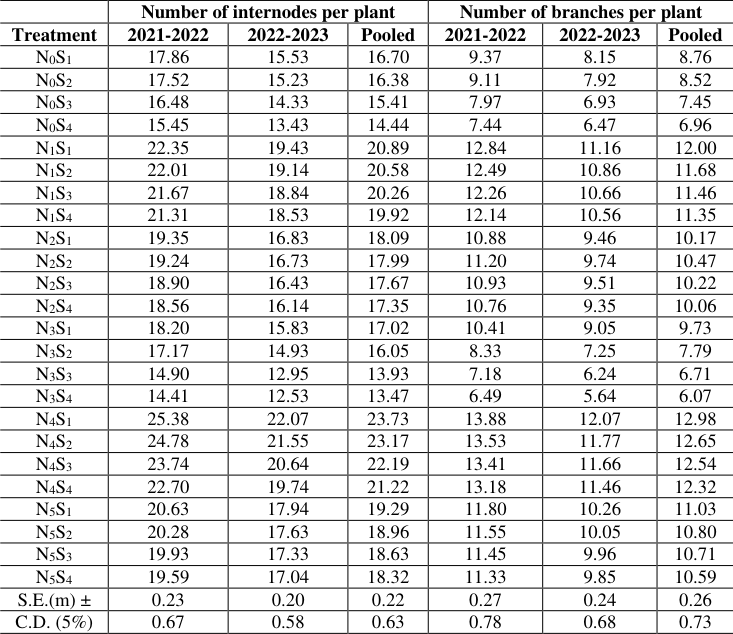 Table 2
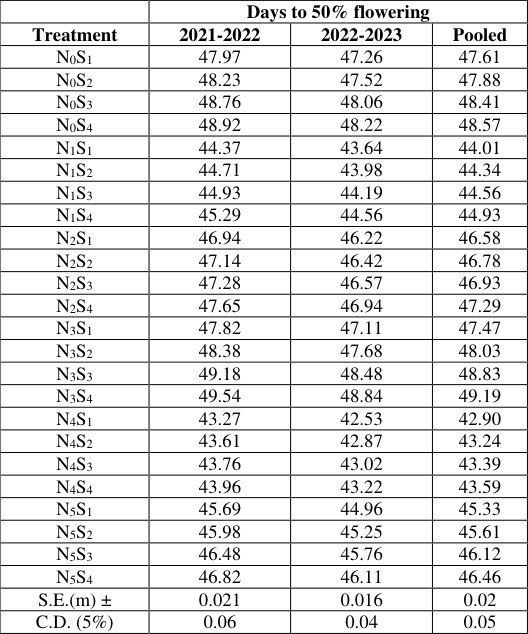 Table 3
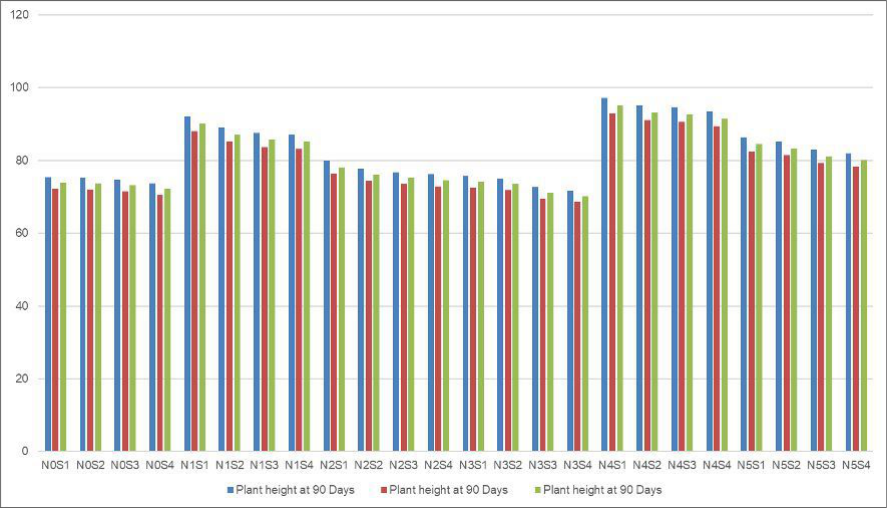 Fig. 1
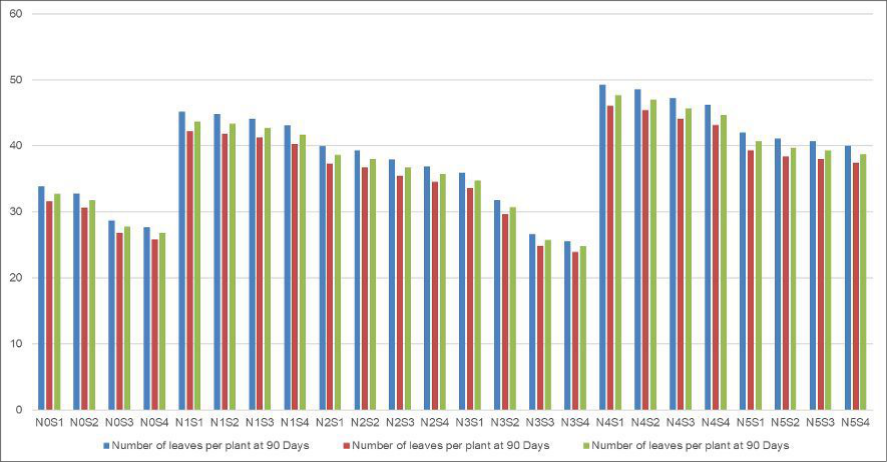 Fig. 2
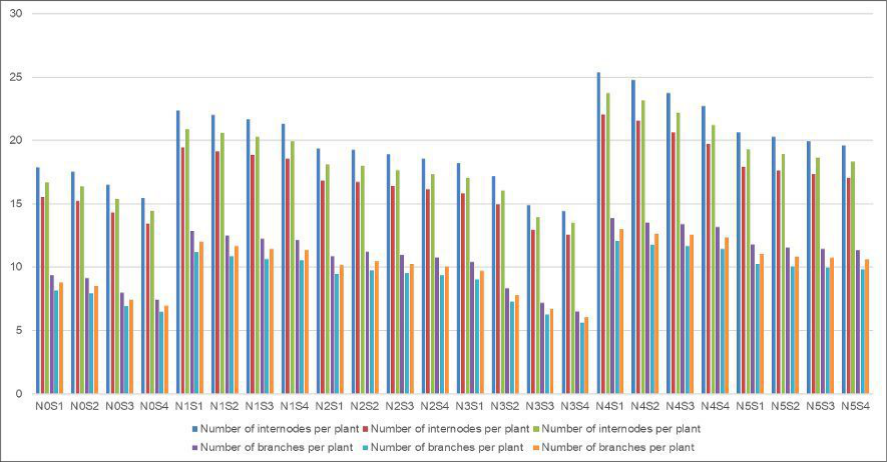 Fig. 3
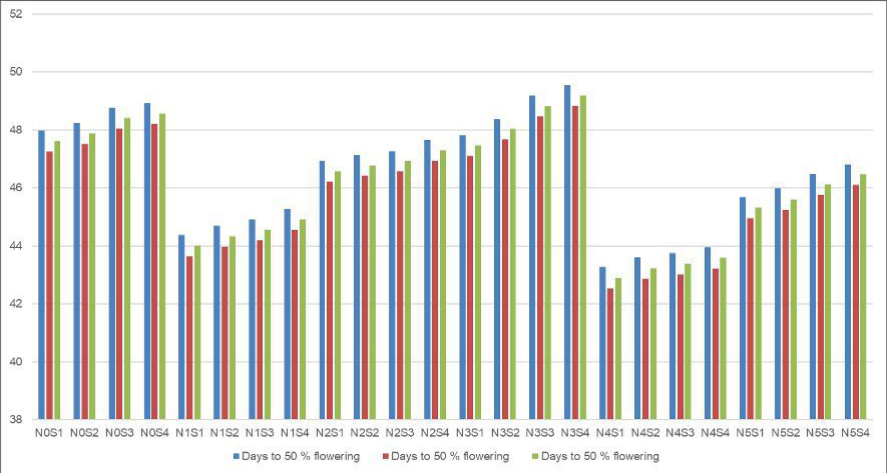 Fig. 4
Introduction
Okra (Ablemoschus esculentus L. Moench) commonly known as Lady's finger. It is one of the most well known and utlized species of the family Malvaceae. It is one of the essentially consumable crop of India, immature and tender pods can be consumed as the boiled and fried vegetable or could be utilized as it may be added to salads soups and stews. Nitrogen is one of the most important major nutrients. It encourage the plant foliage and boosts plant growth at every stage, because it is an integral part of the chlorophyll, all proteins, enzymes and structural materials (Tiwari et al. 2012) [13] . The optimum spacing between the plants is very important for higher productivity of okra per unit area (Mamta Kumari and Singh, 2006) [7] . The optimum spacing avoids the strong competition between plants for growth factors such as space, solar radiation, moisture and nutrients (Singh, 2018) [11] . Planting patterns play an important role in enhancing overall productivity of crops as it is likely to affect interception, absorption, penetration and utilization of incoming solar radiation. Plant density is another important character, which can be manipulated to attain the maximum production from per unit land area. The optimum plant density with proper geometry of planting is dependent on variety, its growth habit and agro climatic conditions. It is also a fact that specified varieties do not exhibit the same phenotypic characteristics in all the environmental conditions. Improved cultivar is an important tool, which have geared production in many countries of the world. In addition to many other factors, cultivars with higher yield potential and a wide range of adaptability to edaphic and climatic conditions is essential for increasing yield per unit area, ultimately boosting up total production (Kaur and Singh, 2011) [6] . Several new varieties have been developed which needs location specific evaluation with regard to agro-input management in which plant spacing is the most important factor (Sondhiya et al., 2019) [12] . Such information is acking under the existing agro-climatic conditions of Kymore plateau. Maintaining optimum spacing or plant population and nitrogen fertilization dose are most important elements in improving productivity of okra. Optimum plant density is the key element for higher yield of okra, as plant growth, yield and quality are affected by inter and intra-row spacing (Amjad et al., 2002; Paththinige et al., 2008) [2,9] . With increasing plant population, yield per unit area increases until a certain limit, beyond which yield decreases due to limitation of environmental resources required for plant growth (Amjad et al., 2002) [2] .
Materials and Methods
A field experiment entitled "Impact of nitrogen rates and plant population on growth and yield of okra [Abelmoschus esculentus (L). Moench]" The present experiment was conducted during the Rabi season of 2021-2023 at the experimental field, department of horticulture, faculty of agriculture, AKS University, Sherganj, Satna (M.P.). The treatments were factorial combinations of Six sources of nitrogen (Control, 100% N through urea (150:75:75 NPK/ha), 100% N through vermicompost, 100% N through FYM, 50% N through urea + 50% N through vermicompost and 50% N through urea + 50% N through FYM) four spacings (40 x 30 cm, 50 x 30 cm, 60 × 30 cm and 80 × 30 cm). The experiment was laid out in randomized block design factorial arrangement with three replications The observations were recorded viz., plant height (cm), number of leaves per plant, Number of branches / plants and Days to 50% flowering. The data were statistically analysed according to the method suggested by Fisher (1950) [5] .
Results and Discussion
Results and Discussion
Growth Parameters Plant height
The data in revealed that the statistical analysis, effect of nitrogen rates, plant population and their interaction was found significant. It is evident from pooled data that the maximum plant height at 90 Days (95.11 cm) was recorded with the treatment N 4 S 1 (50% N through urea + 50% N through vermicompost and 60 x 30 cm 55,555 plants) followed by N 4 S 2 (50% N through urea + 50% N through vermicompost and 50 x 30 cm 66,666 plants) in both year, while the minimum plant height at 90 Days both year (70.13 cm) was recorded under the treatment N 3 S 4 (100% N through vermicompost and 80 x 30 cm 41,666 plants). (Table 1 andFig 1). The favourable effect of spacing and nitrogen in promoting the growth of plant in terms of height of plant might be due to the fact that, closer plant spacing have higher plant density which creates competition among the population for light and resulted into increased in plant height (Birbal et al. 1975, Ambare et al. 2005) [4,1] .
| — | Plant height at 90 Days | — | — | Number of leaves per plant at 90 Days | — | — |
|---|---|---|---|---|---|---|
| Treatment | 2021-2022 | 2022-2023 | Pooled | 2021-2022 | 2022-2023 | Pooled |
| N0S1 | 75.46 | 72.15 | 73.81 | 33.84 | 31.63 | 32.74 |
| N0S2 | 75.30 | 72.01 | 73.66 | 32.81 | 30.67 | 31.74 |
| N0S3 | 74.79 | 71.52 | 73.16 | 28.69 | 26.81 | 27.75 |
| N0S4 | 73.77 | 70.54 | 72.16 | 27.66 | 25.85 | 26.76 |
| N1S1 | 92.13 | 88.10 | 90.12 | 45.17 | 42.22 | 43.70 |
| N1S2 | 89.07 | 85.18 | 87.13 | 44.82 | 41.89 | 43.36 |
| N1S3 | 87.54 | 83.71 | 85.63 | 44.14 | 41.26 | 42.70 |
| N1S4 | 87.03 | 83.23 | 85.13 | 43.11 | 40.29 | 41.70 |
| N2S1 | 79.89 | 76.40 | 78.15 | 39.91 | 37.30 | 38.61 |
| N2S2 | 77.85 | 74.45 | 76.15 | 39.33 | 36.76 | 38.05 |
| N2S3 | 76.83 | 73.47 | 75.15 | 37.96 | 35.48 | 36.72 |
| N2S4 | 76.26 | 72.92 | 74.59 | 36.93 | 34.52 | 35.73 |
| N3S1 | 75.81 | 72.49 | 74.15 | 35.90 | 33.55 | 34.73 |
| N3S2 | 75.12 | 71.85 | 73.49 | 31.78 | 29.70 | 30.74 |
| N3S3 | 72.75 | 69.57 | 71.16 | 26.63 | 24.89 | 25.76 |
| N3S4 | 71.73 | 68.59 | 70.13 | 25.60 | 23.93 | 24.77 |
| N4S1 | 97.23 | 92.98 | 95.11 | 49.29 | 46.07 | 47.68 |
| N4S2 | 95.19 | 91.03 | 93.10 | 48.60 | 45.43 | 47.02 |
| N4S3 | 94.68 | 90.54 | 92.61 | 47.23 | 44.15 | 45.69 |
| N4S4 | 93.49 | 89.40 | 91.45 | 46.20 | 43.18 | 44.69 |
| N5S1 | 86.35 | 82.57 | 84.46 | 42.08 | 39.33 | 40.71 |
| N5S2 | 85.19 | 81.47 | 83.33 | 41.05 | 38.37 | 39.71 |
| N5S3 | 82.95 | 79.32 | 81.14 | 40.70 | 38.04 | 39.37 |
| N5S4 | 81.93 | 78.35 | 80.14 | 40.02 | 37.41 | 38.72 |
| S.E.(m) ± | 0.23 | 0.26 | 0.25 | 0.07 | 0.04 | 0.05 |
| C.D. (5%) | 0.71 | 0.76 | 0.74 | 0.20 | 0.10 | 0.15 |
Table text extracted from the original PDF; superscript letters are shown inline. The original table image is below.
View original table image
Number of leaves per plant
The data in revealed that the statistical analysis, effect of nitrogen rates, plant population and their interaction was found significant. It is evident from pooled data that the maximum Number of leaves per plant at 90 Days (47.68) was recorded with the treatment N 4 S 1 (50% N through urea + 50% N through vermicompost and 60 x 30 cm 55,555 plants) followed by N 4 S 2 (50% N through urea + 50% N through vermicompost and 50 x 30 cm 66,666 plants) in both year, while the minimum Number of leaves per plant at 90 Days in both year (24.77) was recorded under the treatment N 3 S 4 (100% N through vermicompost and 80 x 30 cm 41,666 plants). (Table 1 andFig 2). Amongst the nutrients, nitrogen has the property to enhance the vegetative growth and capacity of plants to utilize the greater amount of nitrogen with increasing dose. This might be due to the higher utilization of nitrogen but in the closer spacing there is no scope for horizontal spread so it might have resulted in the increase in Number of leaves (Ashish et al. 2006, Pal et al. 2016) [3,8] .
Number of internodes per plant
The data in revealed that the statistical analysis, effect of nitrogen rates, plant population and their interaction was found significant. It is evident from pooled data that the maximum Number of internodes per plant at 90 Days (23.73) was recorded with the treatment N 4 S 1 (50% N through urea + 50% N through vermicompost and 60 x 30 cm 55,555 plants) followed by N 4 S 2 (50% N through urea + 50% N through vermicompost and 50 x 30 cm 66,666 plants) in both year, while the minimum Number of internodes per plant at 90 Days in both year (13.47) was recorded under the treatment N 3 S 4 (100% N through vermicompost and 80 x 30 cm 41,666 plants). (Table 2 and Fig 3) [6] .
| — | Number of internodes per plant | — | — | Number of branches per plant | — | — |
|---|---|---|---|---|---|---|
| Treatment | 2021-2022 | 2022-2023 | Pooled | 2021-2022 | 2022-2023 | Pooled |
| N0S1 | 17.86 | 15.53 | 16.70 | 9.37 | 8.15 | 8.76 |
| N0S2 | 17.52 | 15.23 | 16.38 | 9.11 | 7.92 | 8.52 |
| N0S3 | 16.48 | 14.33 | 15.41 | 7.97 | 6.93 | 7.45 |
| N0S4 | 15.45 | 13.43 | 14.44 | 7.44 | 6.47 | 6.96 |
| N1S1 | 22.35 | 19.43 | 20.89 | 12.84 | 11.16 | 12.00 |
| N1S2 | 22.01 | 19.14 | 20.58 | 12.49 | 10.86 | 11.68 |
| N1S3 | 21.67 | 18.84 | 20.26 | 12.26 | 10.66 | 11.46 |
| N1S4 | 21.31 | 18.53 | 19.92 | 12.14 | 10.56 | 11.35 |
| N2S1 | 19.35 | 16.83 | 18.09 | 10.88 | 9.46 | 10.17 |
| N2S2 | 19.24 | 16.73 | 17.99 | 11.20 | 9.74 | 10.47 |
| N2S3 | 18.90 | 16.43 | 17.67 | 10.93 | 9.51 | 10.22 |
| N2S4 | 18.56 | 16.14 | 17.35 | 10.76 | 9.35 | 10.06 |
| N3S1 | 18.20 | 15.83 | 17.02 | 10.41 | 9.05 | 9.73 |
| N3S2 | 17.17 | 14.93 | 16.05 | 8.33 | 7.25 | 7.79 |
| N3S3 | 14.90 | 12.95 | 13.93 | 7.18 | 6.24 | 6.71 |
| N3S4 | 14.41 | 12.53 | 13.47 | 6.49 | 5.64 | 6.07 |
| N4S1 | 25.38 | 22.07 | 23.73 | 13.88 | 12.07 | 12.98 |
| N4S2 | 24.78 | 21.55 | 23.17 | 13.53 | 11.77 | 12.65 |
| N4S3 | 23.74 | 20.64 | 22.19 | 13.41 | 11.66 | 12.54 |
| N4S4 | 22.70 | 19.74 | 21.22 | 13.18 | 11.46 | 12.32 |
| N5S1 | 20.63 | 17.94 | 19.29 | 11.80 | 10.26 | 11.03 |
| N5S2 | 20.28 | 17.63 | 18.96 | 11.55 | 10.05 | 10.80 |
| N5S3 | 19.93 | 17.33 | 18.63 | 11.45 | 9.96 | 10.71 |
| N5S4 | 19.59 | 17.04 | 18.32 | 11.33 | 9.85 | 10.59 |
| S.E.(m) ± | 0.23 | 0.20 | 0.22 | 0.27 | 0.24 | 0.26 |
| C.D. (5%) | 0.67 | 0.58 | 0.63 | 0.78 | 0.68 | 0.73 |
Table text extracted from the original PDF; superscript letters are shown inline. The original table image is below.
View original table image
Number of branches per plant
The data in revealed that the statistical analysis, effect of nitrogen rates, plant population and their interaction was found significant. It is evident from pooled data that the maximum Number of branches per plant at 90 Days (12.98) was recorded with the treatment N 4 S 1 (50% N through urea + 50% N through vermicompost and 60 x 30 cm 55,555 plants) followed by N 4 S 2 (50% N through urea + 50% N through vermicompost and 50 x 30 cm 66,666 plants) in both year, while the minimum Number of branches per plant at 90 Days in both year (6.07) was recorded under the treatment N 3 S 4 (100% N through vermicompost and 80 x 30 cm 41,666 plants). (Table 2 andFig 3) [3] .
Days to 50% flowering
The data in revealed that the statistical analysis, effect of nitrogen rates, plant population and their interaction was found significant. It is evident from pooled data that the minimum Days to 50% flowering in both year (42.90) was recorded with the treatment N 4 S 1 (50% N through urea + 50% N through vermicompost and 60 x 30 cm 55,555 plants) followed by N 4 S 2 (50% N through urea + 50% N through vermicompost and 50 x 30 cm 66,666 plants) in both year, while the maximum Days to 50% flowering in both year (49.19) was recorded under the treatment N 3 S 4 (100% N through vermicompost and 80 x 30 cm 41,666 plants). (Table 3 andFig 4). Similar results were computed (Salvi et al. 2010) [10]
| — | Days to 50% flowering | — | — |
|---|---|---|---|
| Treatment | 2021-2022 | 2022-2023 | Pooled |
| N0S1 | 47.97 | 47.26 | 47.61 |
| N0S2 | 48.23 | 47.52 | 47.88 |
| N0S3 | 48.76 | 48.06 | 48.41 |
| N0S4 | 48.92 | 48.22 | 48.57 |
| N1S1 | 44.37 | 43.64 | 44.01 |
| N1S2 | 44.71 | 43.98 | 44.34 |
| N1S3 | 44.93 | 44.19 | 44.56 |
| N1S4 | 45.29 | 44.56 | 44.93 |
| N2S1 | 46.94 | 46.22 | 46.58 |
| N2S2 | 47.14 | 46.42 | 46.78 |
| N2S3 | 47.28 | 46.57 | 46.93 |
| N2S4 | 47.65 | 46.94 | 47.29 |
| N3S1 | 47.82 | 47.11 | 47.47 |
| N3S2 | 48.38 | 47.68 | 48.03 |
| N3S3 | 49.18 | 48.48 | 48.83 |
| N3S4 | 49.54 | 48.84 | 49.19 |
| N4S1 | 43.27 | 42.53 | 42.90 |
| N4S2 | 43.61 | 42.87 | 43.24 |
| N4S3 | 43.76 | 43.02 | 43.39 |
| N4S4 | 43.96 | 43.22 | 43.59 |
| N5S1 | 45.69 | 44.96 | 45.33 |
| N5S2 | 45.98 | 45.25 | 45.61 |
| N5S3 | 46.48 | 45.76 | 46.12 |
| N5S4 | 46.82 | 46.11 | 46.46 |
| S.E.(m) ± | 0.021 | 0.016 | 0.02 |
| C.D. (5%) | 0.06 | 0.04 | 0.05 |
Table text extracted from the original PDF; superscript letters are shown inline. The original table image is below.
View original table image
Conclusion
In conclusion, the study demonstrated significant effects of nitrogen rates and plant population on various growth parameters of okra. Analysis revealed notable variations in plant height, number of leaves, internodes, branches, and days to 50% flowering across different treatments. Maximum values for plant height, number of leaves, internodes, and branches were observed with specific combinations of nitrogen rates and plant population, suggesting the importance of optimal nutrient management and spacing for promoting vegetative growth and development in okra plants. These findings contribute valuable insights for agricultural practices aimed at enhancing okra yield and quality. Further research could explore additional factors influencing okra growth for comprehensive agricultural recommendations.
Figures and tables from the paper
References
12 in the original paper- Ambare TP, Gonge VS, Rewatkar SS, Mohariya A, Shelke TS. Influence of nitrogen levels and varieties on yield and quality of okra. Crop Res (Hisar). 2005;30(1):80-82.
- Amjad M, Sultan M, Anjum MA, Ayyub CM. Response of okra (Abelmoschus esculentus) to various doses of N & P and different plant spacings. Pakistan J Res (Sci). 2002;13(1):19-29.
- Ashish, Ranjan, Chaudhary V. Effect of integrated nutrient management on growth and yield of okra. J Appl Biol. 2006;16(1/2):11-13.
- Fisher RA. Statistical methods for research workers. Edinburgh, London: Oliver and Boyd; 1950.
- Kaur K, Singh H. Effect of levels and time of nitrogen application on grain and malt quality characteristics of barley varieties. Environ Ecol. 2011;29(2):542-545.
- Kumari M, Singh RK. Economics of hybrid okra. Int J Plant Sci (Muzaffarnagar). 2006;1(2):363-364.
- Pal Janki, Adhikari RS, Negi J. Effect of nitrogen phosphorus and potassium on growth and green herb yield of thymus serphyllus. 2016;5(1):406-410.
- Paththinige SS, Upashantha PSG, Ranaweera Banda RM, Fonseka RM. Effect of plant spacing on yield and fruit characteristics of okra (Abelmoschus esculentus). Trop Agric Res. 2008;20:336-342.
- Salvi VG, Shinde M, Dhane SS, Sawant P. Effect of integrated nutrient management on yield and quality of okra grown on lateritic soils of Konkon. J Maharashtra Agric Univ. 2010;35(3):466-469.
- Singh S, Singh TK, Namdeo KN. Effect of nitrogen and spacing on growth, yield and quality of tomato. Ann Plant Soil Res. 2018;20(3):313-315.
- Sondhiya R, Pandey R, Namdeo KN. Effect of plant spacings on growth, yield and quality of mustard (Brassica juncea L.). Ann Plant Soil Res. 2019;21(2):172-176.
- Tiwari V, Shrivastava A, Namdeo KN, Kumar M. Effect of sources and levels of nitrogen on growth, yield and quality of kalmagh. Ann Plant Soil Res. 2012;14(1):14-1.