
Research article · 2024 · Full text
International Journal of Agriculture Extension and Social DevelopmentExploring the prevalence of children with communication disorders and their academic performance
Volume 7(4) · Pages 186–192 · DOI: 10.33545/26180723.2024.v7.i4c.527 ↗
Research areasStuttering Research and Treatment
Abstract
Author-writtenCommunication is the active process of exchanging information, thoughts, desires and ideas. The capacities to receive, send, process and grasp ideas or spoken, nonverbal, and graphic symbol systems is impaired by a communication disorder. A communication issue may show up in speech, language or hearing functions. Our communication behaviour is mainly divided into two components – expressive behaviour (production of the sound, speech, language) and receptive behaviour (understanding and responding). Communication is important in children’s academic performance. Children with communication disorders took education in both inclusive and special education system. Therefore, to know their prevalence and academic performance, a study entitled “Exploring the prevalence of children with communication disorders and their academic performance”. The secondary data from office of the Samarga Siksha, Jorhat and school records revealed that a higher percentage of children with communication disorder (38.19%) were enrolled in Jorhat block. Most of the children with communication disorder under the study are found under the low performer category (40.4% and below).
Summary
Source-checkedPlain-language reading of the full paper, prepared with AI and checked against the text. Each point links to the authors' own words.
Why it matters
- Hearing, speech, and language skills are critical for a child's academic success and social development. View evidence ↗
- Communication disorders serve as an umbrella term for impairments in hearing, language, and speech that affect how verbal and non-verbal information is processed and expressed. View evidence ↗
- In a 2011 Indian census survey, hearing impairment (18.9%) and speech-language impairment (7.5%) were significant disabilities. View evidence ↗
The question
- The study aimed to determine the prevalence of children with communication disorders in inclusive and special education systems and evaluate their academic performance. View evidence ↗
What they did
- The research focused on 156 children in classes II–IX from inclusive and special schools in the Jorhat district of Assam who had hearing impairments or speech-language disabilities. View evidence ↗
- Prevalence data were obtained as secondary data from the office of Samarga Shiksha in Jorhat. View evidence ↗
- Academic records and background information for the 2022-23 year were collected from class teachers using a checklist. View evidence ↗
- Academic performance was categorized into three levels: High (61-100%), Average (41-60%), and Low (40% and below). View evidence ↗
What they found
- The highest prevalence of children with communication disorders in the district was found in the Jorhat block at 38.19%. View evidence ↗
- Among all children with communication disorders in the district, boys had a higher prevalence (59.2%) than girls (40.7%). View evidence ↗
- The highest percentages of children with communication disorders were in classes III (16.0%) and VII (15.4%), while the lowest were in classes IX (6.4%) and VIII (9.6%). View evidence ↗
- The largest group of children with communication disorders exhibited low academic performance (40.4%), while only 25% showed high performance. View evidence ↗
- Children with communication disorders tended to have high or average performance in primary classes, but performance shifted toward low in higher classes. View evidence ↗
What it means
- The authors conclude that providing an enriched school environment and high-quality assistive devices, such as hearing aids, is essential for the academic success of these children. View evidence ↗
Visual summary
3 visualsIllustrations explain the paper; charts are replotted from the paper's own table values.
Performance Trend by Grade Level
AI-generated conceptual illustration (school-aged children). It explains the idea and does not show study data.
View source evidence ↗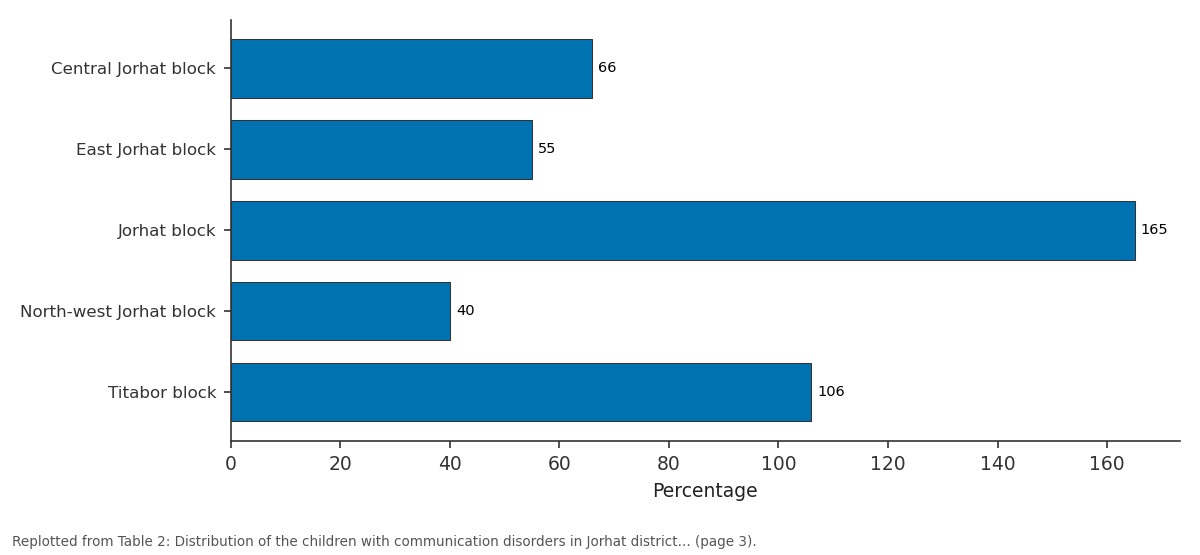
Total / Frequency: Central Jorhat block vs East Jorhat block vs Jorhat block vs North-west Jorhat block vs Titabor block
Replotted from Table 2 (page 3) of the original paper. Every bar is the paper's own table value.
View source evidence ↗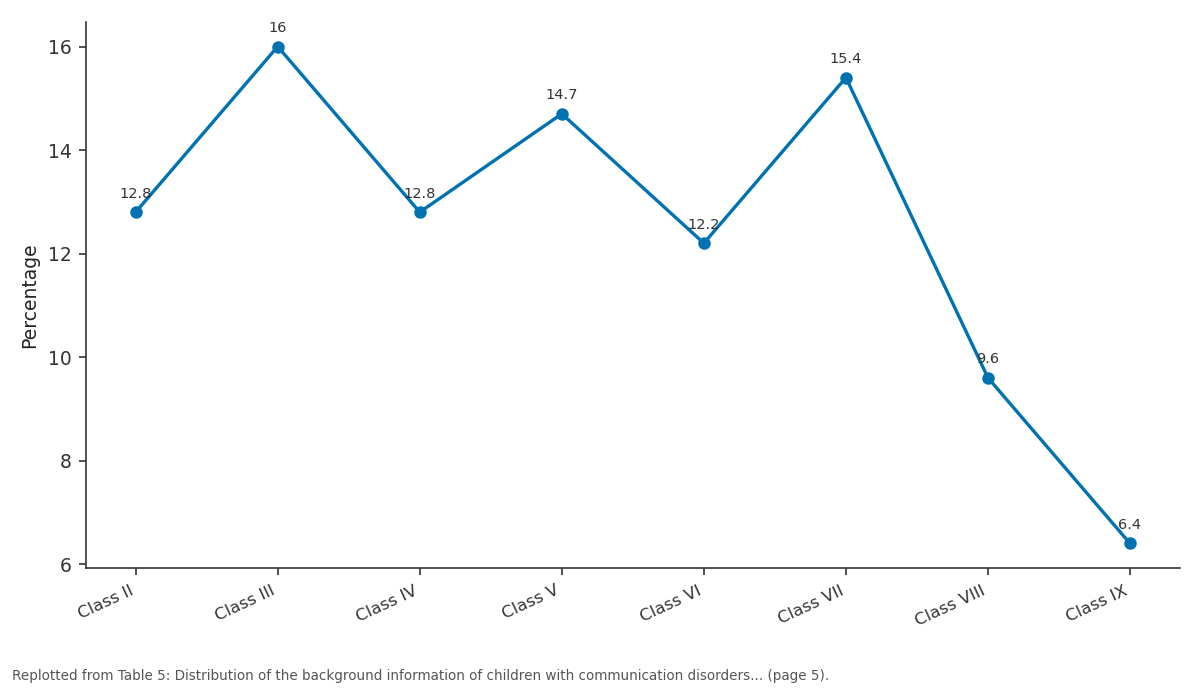
Percentage: Class II vs Class III vs Class IV vs Class V vs Class VI
Replotted from Table 5 (page 5) of the original paper. Every bar is the paper's own table value.
View source evidence ↗Figures & tables
From the original paper Table 1
 Table 2
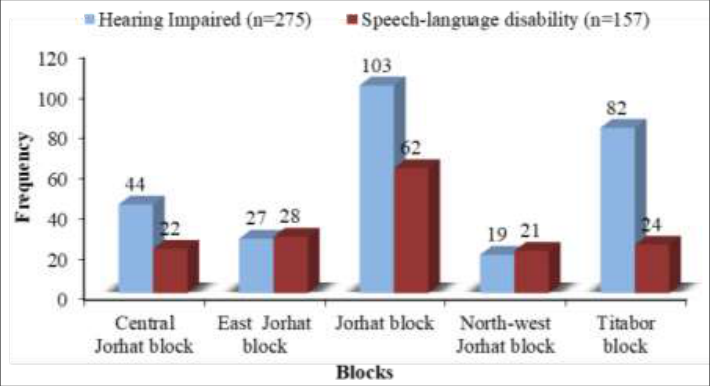 Figure 2
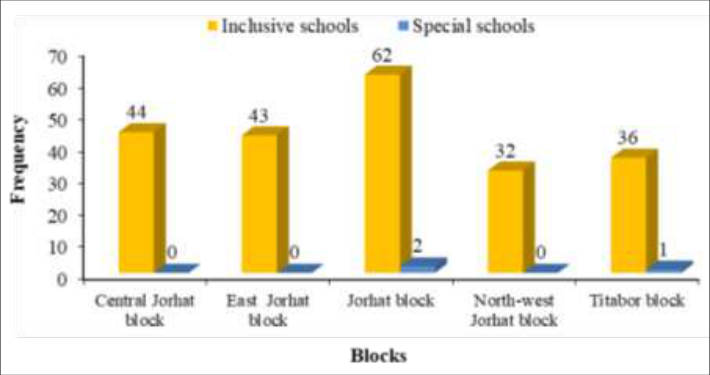 Figure 1
 Table 3
 Table 4
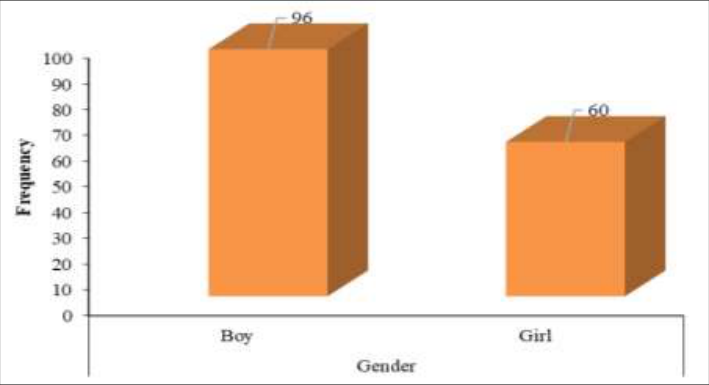 Figure 4
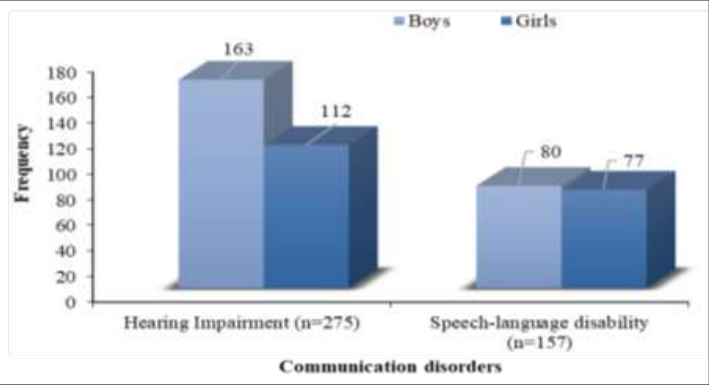 Figure 3
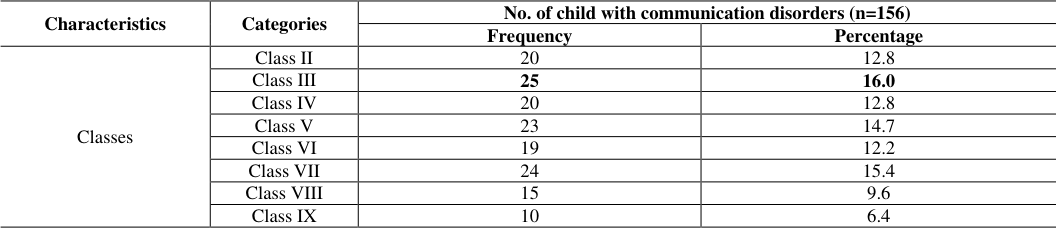 Table 5
 Table 6
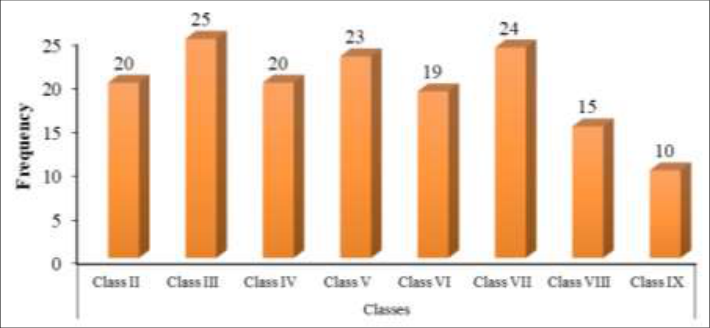 Figure 5
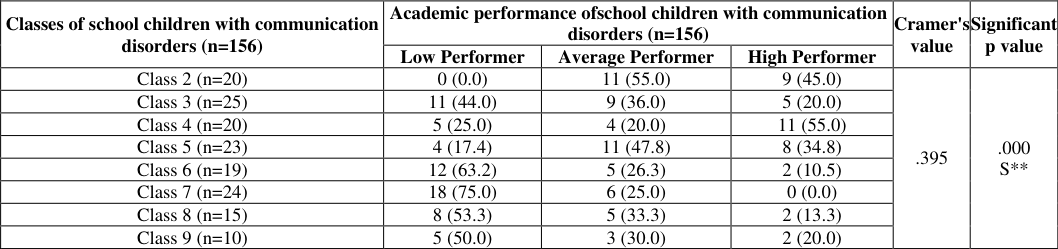 Table 7
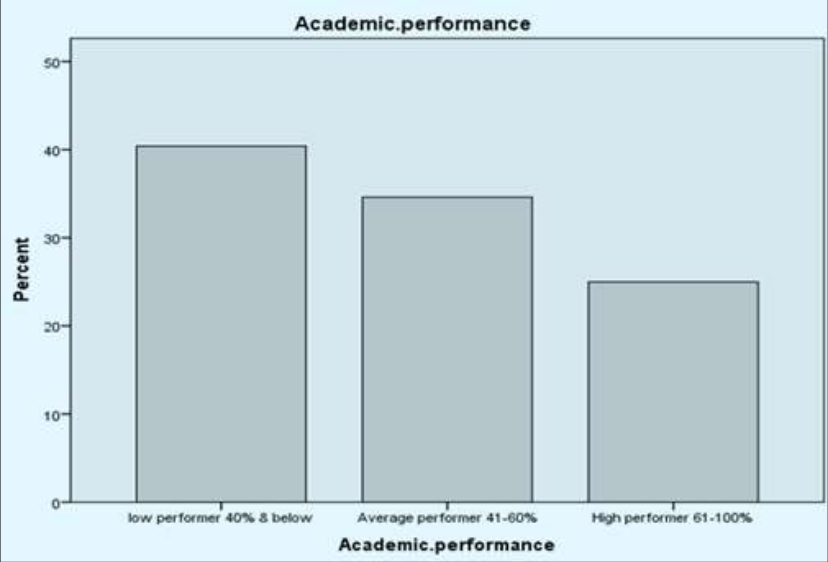 Figure 6
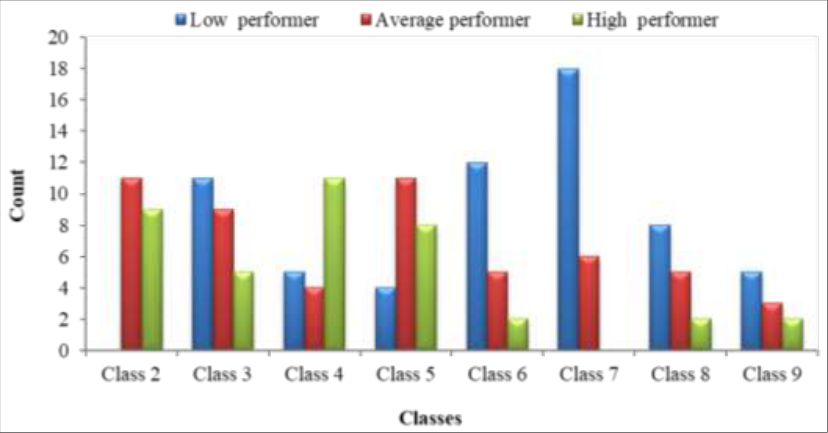 Figure 7
Introduction
Communication is the essence of human life through which we socialize in our day-to-day lives. The development of speech, language and hearing components is essential for verbal communication. Mangal et al., (2012) [9] learning takes place through the process of communication. Hearing, speech and language skills are absolutely essential to the social development and academic success of a child. Therefore, disturbances in terms of producing speech and language, along with their hearing and comprehension, may work as potent factors for creating communication disorders among children. Mangal et al., (2012) [9] communication disorders are an "umbrella'' term to describe hearing, language and speech disorders that create an impairment in the ability to receive, process, and express verbal and non-verbal information. Children with communication disorders are those who were identified with hearing impairment and speech-language disability under the rights of persons with disability Act, 2016 with a disability certificate (children with a minimum disability of 40%). Hearing impairment is characterized by difficulty hearing sound waves at 60 decibels or higher during conversation. Individuals who do not react to environmental sounds after birth and struggle with understanding speech or communicating may be considered hearing impaired according to the Rights of Persons with Disabilities Act (RPWD Act) of 2016. Speech-language disability encompasses conditions that hinder a person's ability to produce sounds effectively, while language disorders interfere with understanding or using language, including difficulties with grammar or vocabulary. According to National Educational Policy, NEP 2020 equitable and inclusive education aims to ensure that no child loses any opportunity to learn and excel together in the same school because of the circumstances of disabilities. Presently Samagra Siksha cover children with special need from class I-XII to promote in inclusive education. Special education known as special need education is the practice of educating students in a way that accommodates their individual differences, disabilities, special needs (Wikipedia). According to the Government of India's nationwide sample survey for the 2011 census, speech-language impairment (7.5%) came in fifth while hearing impairment (18.9%) was recognized as the second most common disability and only (61%) of special children aged 5 to 19 were likely to complete their education. While (12%) had previously attended, 27 per cent had never gone. Therefore, an attempt was made to observe the prevalence and academic www.extensionjournal.com performance of children with communication disorders. Objectives 1. To find out the prevalence of children with communication disorders in inclusive and special education system 2. To find out the prevalence of both the gender of children with communication disorders in inclusive and special education system 3. To find out the academic performance of children with communication disorders 4. To find out the academic performance of children with communication disorders in relation to their class
Review of Literature
The study entitled "Epidemiology of communication disorders and their role in rehabilitation" (Devadiga et al., 2014) [5] mentioned that the prevalence was higher for hearing disorders (62%) followed by language disorders (24%) and speech disorders (14%). According to Reddy et al., 2015 [7] mentioned that a total of 2010 primary school children had participated in the screening program for communication disorders. The results of the study revealed that around 11.5% of school children had some form of communication disorders. Among these, distribution of language disorders (7.4%) was in greater proportion when compared to speech disorders (3.8%). According to Adebayo et al. (2014) [2] , 18.8 percent of pupils had merits in the school end-of-term examination, 50 percent obtained pass grades, and 31.2 percent failed. This is a clear indication that the majority of the pupils with speech and language disorders performed at a lower level. The sample consisted of 48 pupils with speech and language disorders who were purposefully selected from six schools. The study was conducted by Konadath et al., (2013) [6] males showed a higher prevalence of communication disorders as compared to females.
Research design
Research design
Methodology
Researchers are bound by rules and ethics. As the researcher used some secondary data in the research, prior to the process of data collection, the researcher has taken due permission from the concerned authority in Samagra Shiksha, Jorhat and district social welfare office, Jorhat to conduct the study. After receiving the consent from the authorities, consent was sought from the principals of selected schools for data collection. Confidentiality of findings and privacy of the participants were protected. Secondary data on the prevalence of children with communication disorders in inclusive and special schools of Jorhat district were collected from concerned authority of office of the Samarga Shiksha, Jorhat. The next step was to visit the selected schools by the researcher and the previous year's (2022-23) academic record, background information of selected sample children with communication disorders were collected from the class teacher with the help of the prepared checklist.
Results and Discussion Prevalence of children with communication disorders in inclusive and special education system
This section of the study deals with the secondary data on prevalence of children with communication disorders in Jorhat district. 1 shows that a total of 220 no. of inclusive schools are present in Jorhat district. Among all blocks a higher number of inclusive schools (28.5%) were found in Jorhat block (Samagra Shiksha, Jorhat, Assam, 2021-2022). This may be due to the fact that inclusive schools are an important movement according to the National Educational Policy (NEP), which means "inclusion of all." The inclusive schools may also be situated near, which makes it convenient for children to visit school every day. This is supported by the findings of a report on a study of Kamrup and Kamrup (METRO) District" (Sishu Sarothi, 2017) [8] , which revealed that (52.2%) of people with disabilities went to inclusive schools and 6.4 per cent went to special schools. Results from Table 2 shows that in Jorhat district a total of 432 numbers of children with communication disorder were present in both inclusive and special schools. A higher percentage of children with communication disorders were found in Jorhat block (38.19%) (Samagra Shiksha, Jorhat, Assam, 2021-2022). This is supported by the findings on the total population of people with disabilities in Assam as per the 2011 census data, which revealed the hearing impairment was 101577 and the speech impairment was 39750. Results from Table 3 shows that the percentage of boys was higher (59.2%) as compared to girls (40.7%) among all children with communication disorders studied in different schools of Jorhat district (Samagra Shiksha, Jorhat, Assam, 2021-2022). This is supported by the findings of the 2011 census of India, where males outnumbered females in both hearing (males: 52.8%, females: 47.2%) and speech impairment (males: 56.25%, females: 43.8%). The findings from Table 4 shows that boys were found to be the highest (61.5%) as compared to girls (38.4%). This finding can be supported by the 2012 National Health Interview Survey. According to the report, boys (9.6%) are more likely to have communication disorders as compared to girls (5.7%). The findings of Table 5 indicated that among all children with communication disorders who studied in classes II-IX, a higher percentage of children were found to study in classes III (16.0%) and VII (15.4%), respectively, and the lowest percentage of children were observed in classes IX (6.4%) and VIII (9.6%), respectively. Findings of the study showed a gradual decline in the number of children attending upper classes. This may be due to the fact that the sample children with communication disorders may have difficulties studying the upper-level educational curriculum in the prevailing school environment under the study.
| Characteristics | Categories | No. of child with communication disorders (n=156) | — |
|---|---|---|---|
| Frequency | Percentage | ||
| Classes | Class II | 20 | 12.8 |
| Class III | 25 | 16.0 | |
| Class IV | 20 | 12.8 | |
| Class V | 23 | 14.7 | |
| Class VI | 19 | 12.2 | |
| Class VII | 24 | 15.4 | |
| Class VIII | 15 | 9.6 | |
| Class IX | 10 | 6.4 |
Table text extracted from the original PDF; superscript letters are shown inline. The original table image is below.
View original table image
| Characteristics | Categories | No. of child with communication disorders (n=156) | — |
|---|---|---|---|
| Frequency | Percentage | ||
| Gender | Boy | 96 | 61.5 |
| Girl | 60 | 38.4 |
Table text extracted from the original PDF; superscript letters are shown inline. The original table image is below.
View original table image
| Characteristics | Categories | No. of children with communication disorders in schools (N=432) | — | — | — |
|---|---|---|---|---|---|
| Hearing Impairment(n=275) | Speech-language disability(n=157) | ||||
| Frequency | Percentage | Frequency | Percentage | ||
| Gender | Boys | 163 | 59.2 | 80 | 50.9 |
| Girls | 112 | 40.7 | 77 | 49.0 |
Table text extracted from the original PDF; superscript letters are shown inline. The original table image is below.
View original table image
| Characteristics | Name of blocks | No. of children with communication disorder (N=432) | — | — | — | Total | — |
|---|---|---|---|---|---|---|---|
| Hearing Impaired(n=275) | Speech-language disability(n=157) | ||||||
| Frequency | Percentage | Frequency | Percentage | Frequency | Percentage | ||
| Blocks | Central Jorhat block | 44 | 16.3 | 22 | 14.0 | 66 | 15.27 |
| East Jorhat block | 27 | 9.8 | 28 | 17.8 | 55 | 12.73 | |
| Jorhat block | 103 | 37.4 | 62 | 39.4 | 165 | 38.19 | |
| North-west Jorhat block | 19 | 6.9 | 21 | 13.3 | 40 | 9.2 | |
| Titabor block | 82 | 29.8 | 24 | 15.2 | 106 | 24.53 | |
| Total | 275 | 63.6 | 157 | 36.3 | 432 | 100.0 |
Table text extracted from the original PDF; superscript letters are shown inline. The original table image is below.
View original table image
Academic performance of children with communication disorders
The academic performance is the measurement of student accomplishment in terms of marks across various academic subjects of instructional environment specifically in educational institute. Results from Table 6 revealed that a higher percentage of children with communication disorders were in the lowperformance group (40.4%), and only 25 percent were found to be in the high-performance group. This may be due to the fact that communication disorders in children affect academic performance because of difficulty hearing and expressing themselves. A study by Hardman, Drew, and Egan (2002) [11] reported that children with speech and language disorders did not frequently perform as expected at grade level because of their continuous struggles with reading and low achievements in tests. www.extensionjournal.com Findings in table 7 shows the results where the cramer's value is .395 which indicated a strong effect size between the variables-academic performance of school children with communication disorders and their class. The significant value is .000 at 1% level of significance which is less than 0.05. This indicated that there exists significant relationship between academic performance of school children with communication disorders and their class. High academic performance and average academic performance of children with communication disorders seen in primary classes and low academic performance were seen in higher classes. It may be due to the reason that as the class gradually become higher the content of the curriculum also increases. The children with communication disorders initially can adjust with the syllabus in primary classes but as soon as the syllabus got tough the ability to understand become slower because of their communication and hearing disorders. Study in this area reported that there was a significant difference in the academic achievement of students from large and small classes. www.extensionjournal.com
| Characteristics | Categories | No. of children (n=156) | — |
|---|---|---|---|
| Frequency | Percentage | ||
| Academic performance | Low performance (40% & below) | 63 | 40.4 |
| Average performance (41-60%) | 54 | 34.6 | |
| High performance (61-100%) | 39 | 25.0 |
Table text extracted from the original PDF; superscript letters are shown inline. The original table image is below.
View original table image
Conclusion
The study revealed that a total of 220 no. of inclusive schools are present in Jorhat district. In Jorhat district a total of 432 numbers of children with communication disorder were present in both inclusive and special schools. The percentage of boys was higher (59.2%) as compared to girls (40.7%) among all children with communication disorders studied in different schools in Jorhat district. Prevalence of children with communication disorder in the Jorhat block of Jorhat district where a higher number of inclusive schools (28.5 percent) were found in Jorhat block. A higher percentage of children with communication disorders were also found in Jorhat Block (38.19%). According to the background information of respondents (sample of Jorhat block only), boys were found to be the highest (61.5%) as compared to girls (38.4%). A higher percentage of children with communication disorders were in the low-performance group (40.4%). A higher percentage of children with communication disorders were found to study in classes III (16.0%) and VII (15.4%) respectively and the lowest percentage of children were observed in classes IX (6.4%) and VIII (9.6%), respectively. The Cramer's value .395 indicated a strong effect size between the variables and significant relationship between academic performance of school children with communication disorders and their class. The study suggested that an enriched school environment with good-quality assistive devices such as hearing aids etc. are also important for the academic accomplishment of children with communication disorders. New technologies and emerging practices have created new requirements for educational buildings. As a result, new approaches to building learning environments must be developed that both create better spaces for children and increase the efficiency of investments in educational infrastructure (Barrett et al., 2019) [3] .
Figures and tables from the paper
| Characteristics | Name of blocks | No. of schools (N=220) | — | — | — |
|---|---|---|---|---|---|
| Inclusive schools (n=217) | Special schools (n=3) | ||||
| Frequency | Percentage | Frequency | Percentage | ||
| Blocks | Central Jorhat block | 44 | 20.2 | 0 | 0.0 |
| East Jorhat block | 43 | 19.8 | 0 | 0.0 | |
| Jorhat block | 62 | 28.5 | 2 | 66.6 | |
| North-west Jorhat block | 32 | 14.7 | 0 | 0.0 | |
| Titabor block | 36 | 16.5 | 1 | 33.3 |
Table text extracted from the original PDF; superscript letters are shown inline. The original table image is below.
View original table image
References
6 in the original paper- Adebayo AS, Mabuku M. The Impact of Speech and Language Disorders on Pupils' Learning and Socialization in Schools of Kalomo District-Zambia. Eur J Educ Sci. 2014;2:141-152.
- Census of India. Ministry of Home Affairs, Government of India. 2011. [Accessed: 01-Feb-2022]. Available from: https://censusindia.gov.in/.
- Devadiga D, Varghese A, Bhat J. Epidemiology of communication disorders and their role in rehabilitation. Int J Innov Res Dev. 2014;3(13):469473.
- Konadath S, Suma C, Jayaram G, Sandeep M, Mahima G, Shreyank PS. Prevalence of Communication Disorders in a Rural Population of India. J Hear Sci. 2013;3(2):41-49.
- Shanbal JC, Arunraj K, Reddy MS. Distribution of communication disorders in primary school children. J All Indian Inst Speech-Hear. 2015;34:128-133.
- Mangal SK. Educating Exceptional Children: An Introduction to special education. 2nd ed. PHI Learning. 2023;9-19; 247-248; 285-296; 300; 440-442.