
Research article · 2024 · Full text
International Journal of Agriculture Extension and Social DevelopmentCost and return analysis of tomato cultivation in Central Brahmaputra Valley Zone of Assam
Volume 7(4) · Pages 200–205 · DOI: 10.33545/26180723.2024.v7.i4c.529 ↗
Research areasAgricultural Economics and Practices
Abstract
Author-writtenVegetables are considered as a very important source of nutrients, vitamins and minerals. Cultivation of vegetables can create employment generation for the rural youths as well as the farmers. The farmers of Assam cultivate tomato which can fulfill the requirement of the state. The farmers in the state hardly maintain records on cost and return of the farming practices. Therefore, a study was conducted during 2020-21 to know about the farming experience in vegetable growers and to estimate the economics of tomato production in different categories of farms. To know the demographic pattern and vegetable farming experience the statistical tools like percentage, mean was used. The economics of tomato cultivation in the study area was estimated as per the standard cost concept. The study revealed that 92 percent farmers had vegetable farming experience more than five years. The average cost C2 per hectare for all farmers’ groups was calculated as Rs.1,40,416 per hectare. The per hectare average net return of all farms over cost C2 was calculated as Rs. 1,15,142. The average all farm B:C ratio was computed as 1.82. The cultivation of tomato could be considered as a profitable and a good enterprise for income generation.
Summary
Source-checkedPlain-language reading of the full paper, prepared with AI and checked against the text. Each point links to the authors' own words.
Why it matters
- Vegetables are a critical source of dietary micronutrients, including vitamins and minerals. View evidence ↗
- Growing vegetables can offer higher farm gate income and better employment opportunities for rural youth compared to cereals, pulses, and oilseeds. View evidence ↗
- Farmers in Assam generally do not keep formal records of the costs and returns associated with their farming practices. View evidence ↗
The question
- The study aimed to determine the farming experience of vegetable growers and estimate the economics of tomato production in the region. View evidence ↗
What they did
- The study purposively selected 150 respondent farmers from five villages across two Agriculture Development Officer circles in the Nagaon district of the Central Brahmaputra Valley Zone. View evidence ↗
- The economic analysis of tomato cultivation followed standard cost concepts, ranging from Cost A1 to Cost C3. View evidence ↗
What they found
- A vast majority of the farmers (92%) had more than five years of experience in vegetable farming. View evidence ↗
- Only 27.33% of the respondents (41 out of 150) were engaged in tomato cultivation. View evidence ↗
- The low preference for tomato cultivation among farmers is attributed to the prevalence of Late Blight disease. View evidence ↗
- The average net return over Cost C2 was Rs. 1,15,142 per hectare, with Group III achieving the highest return of Rs. 1,24,983. View evidence ↗
- The average benefit-cost (B:C) ratio for the zone was 1.82, peaking at 1.87 for Group III farmers. View evidence ↗
- Hired human labour (17.30%) and fertilizers (17.11%) were the largest components of working capital relative to Cost C2. View evidence ↗
What it means
- The authors conclude that tomato cultivation is a profitable enterprise for generating income. View evidence ↗
- The authors recommend that the government implement policies providing training and demonstrations to help farmers improve production and profitability. View evidence ↗
Visual summary
1 visualsIllustrations explain the paper; they do not show study data.
Economic Comparison of Farmer Groups
AI-generated conceptual illustration (tomato plants in a field). It explains the idea and does not show study data.
View source evidence ↗Figures & tables
From the original paper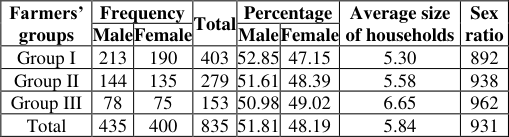 Table 1
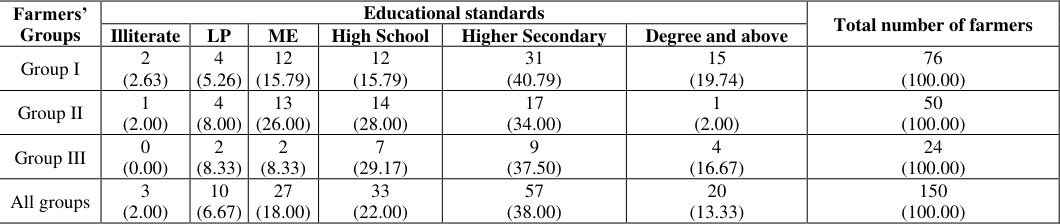 Table 2
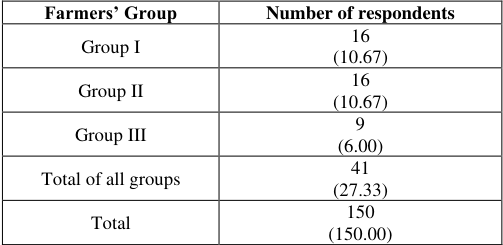 Table 3
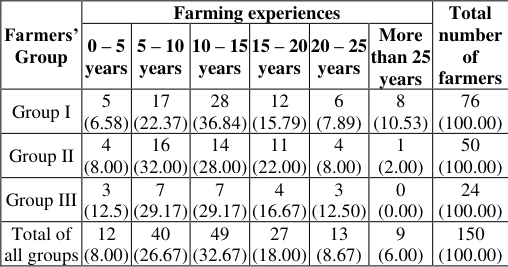 Table 4
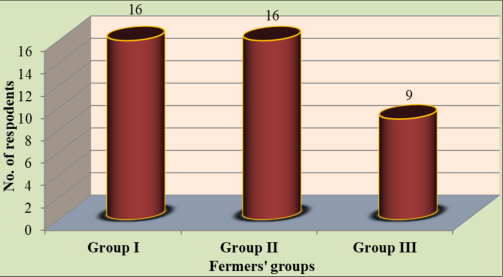 Figure 1
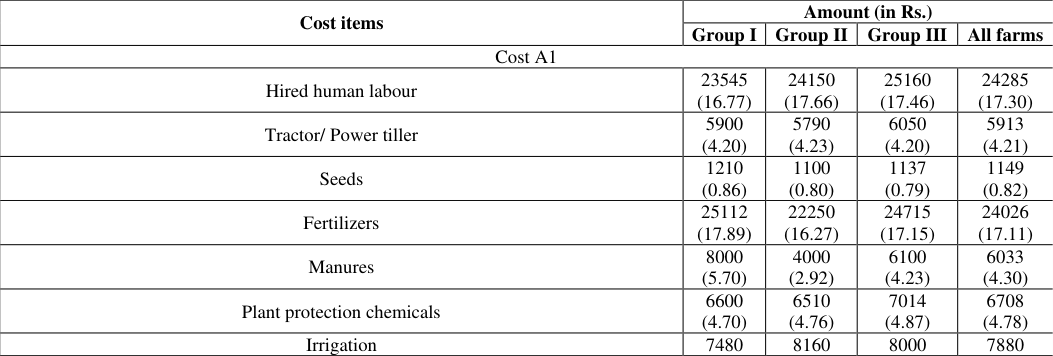 Table 5
Introduction
Vegetables are important source of different nutrients, vitamins and minerals. It is considered as the major source of dietary micronutrients [1] . It is grown by most of the farmers for their household requirements. It covers 10.1 million hectare area in India. The per capita vegetable consumption in Asia is far below the required level to satisfy the recommended dietary micronutrient intakes. Empirical evidence and discussion show that enhanced vegetable production and consumption in Asia can play a catalytic role in the overall economic development by improving the nutritional status, learning capabilities and managerial capacities of farmers, generating incomes and jobs in both the farm and non-farm sectors and improving resource use efficiency in agriculture. Most vegetable crops possess high medicinal value for curing certain diseases [2] . Cultivation of vegetables can provide better income and employment opportunities to rural youths. As compared to other crops like cereals, pulses and oilseeds, vegetable crops can enhance a higher farm gate income [3,4,5] . Commercial vegetable cultivation may lead to enhance the economic growth of the farmers. Vegetables can give 350% higher monthly net return than rice [6] . Tomato is a nutrient dense super food that offers benefit to a range of bodily systems. India ranks second in the world in terms production of tomato. It can help to protect against cancer, maintain high blood pressure and reduce blood glucose in people with diabetes. Tomatoes are an intensely nutritious plant food and so it is considered a high value crop. The farmers in the state of Assam have been growing vegetables both in rabi and kharif seasons. They have been using all sorts of inputs to get a higher production. But they have no formal education on cultivation of vegetable crops. It is observed that the farmers in the state do not maintain records on cost and return of their farming practices. Based on the experience and knowledge gained from the fellow farmers they usually grow vegetable crops. Therefore, the study was conducted with the objective to know the farming experience of farmers in vegetable cultivation and to estimate the economics of tomato production.
Materials and Methods
There are six agro-climatic zones in the state of Assam. Out of these agro-climatic zones, one agro-climatic zone namely, Central Brahmaputra Valley zones was selected for the study. Nagaon district from the zone was selected purposively for study based on the area under vegetable cultivation. Two Agriculture Development Officer circles were selected for the study purposively based on the area under vegetable cultivation. Five villages from each circle and 15 vegetable growing farmers from each village were selected. A total of 150 numbers of respondent farmers were selected for the study. The farmers were categorized as group I, group II and group III based on the area under vegetable cultivation using the Cumulative Square Root www.extensionjournal.com frequency method [7] . Group I included the farmers having vegetable cultivation area less than 0.4 ha, group II included the farmers having vegetable growing area 0.4-0.8 ha and the group III included the farmers having more than 0.8 ha vegetable growing area. For analysis of data, especially to know the demography and vegetable farming experience the statistical tools like percentage, mean was used. The economics of tomato cultivation in the study area was estimated as per the standard cost concept such as cost A1, cost A2, cost B1, cost B2, cost C1, cost C2 and cost C3. The cost items were calculated based on the following norms.
Cost A1: All actual expenses in cash and kind incurred in production by the producer. The following items are included in cost A1
Results and Discussion
Results and Discussion
Distribution of family members of the respondents according to sex
The population structure in Assam as well as India is very uneven. It varies from location to location, zone to zone and state to state. Table 1 presents the distribution of family members of the respondents according to sex. The average size of household was calculated by dividing the total number of populations in the households by the total number of households. The average size of household was calculated as 5.84 in the study area. This size was much higher than our national average (4.90) [8] and the Assam state average (4.87) [9] .
| Farmers’ groups | Frequency | — | Total | Percentage | — | Average size of households | Sex ratio |
|---|---|---|---|---|---|---|---|
| Male | Female | Male | Female | ||||
| Group I | 213 | 190 | 403 | 52.85 | 47.15 | 5.30 | 892 |
| Group II | 144 | 135 | 279 | 51.61 | 48.39 | 5.58 | 938 |
| Group III | 78 | 75 | 153 | 50.98 | 49.02 | 6.65 | 962 |
| Total | 435 | 400 | 835 | 51.81 | 48.19 | 5.84 | 931 |
Table text extracted from the original PDF; superscript letters are shown inline. The original table image is below.
View original table image
The farmers' group wise analysis revealed that the average size of household was found the highest in group III (6.65) and the lowest was calculated for group I (5.30). This made it very clear that the farmers under study did not follow the family planning as per recommendation of the Government of India. It might be due to the unawareness of people about family planning, lower educational standasrd or might be religious reason. A study conducted in Nigeria revealed that amongst the tomato farmers in Kogi State, the average family size was 7 [10] . The sex ratio is the ratio of males to females in a population. Sex ratio is used to describe the number of females per 1000 males. The average sex ratio in the study area was calculated as 931 which was lower than the average of the state of Assam (958) [9] but it was almost same that with the National average (930) [11] . Farmers' group wise analysis reveals that in group I, the sex ratio was less than both national and Assam state average whereas in group II it was more than the national average but less than the Assam state average and in group III, it was more than both the national average and the Assam state average. A study in Bangladesh reported that about 41% and 25% of farmers accomplished their primary and secondary education respectively [12] . In the study conducted at Yewa North Local Government Area of Ogun State, Nigeria reported that most of the tomato farmers were literate with an average of secondary school education standard [13] . www.extensionjournal.com
Distribution of respondents based on vegetable farming experience
The respondents under study had lots of vegetable farming experiences (Table 4). The experience of the respondents had been grouped in 5 years interval i.e., 0-5 year experience, 5-10 years' experience, 10-15 years' experience, 15-20 years' experience, 20-25 years' experience and more than 25 years' experience. From the table it was observed that the highest 32.67 percent farmers were experienced with 10-15 years of vegetable cultivation followed by 5-10 years' experience (26.67 percent) and 15-20 years' experience (18.00 percent). The lowest 6.00 percent farmers had more than 25 years vegetable farming experience. Farmers' group wise analysis reveals that in group I, the highest 36.84 percent farmers were experienced with 10-15 years followed by 5-10 years' experience (22.37 percent) and 15-20 years' experience (15.79 percent). The lowest 6.58 percent farmers were 0-5 years of experience. In group II, the highest 32.00 percent farmers were experienced with 5-10 years followed by 10-15 years' experience (28.00 percent) and 15-20 years' experience (22.00 percent) with the lowest 2.00 percent farmers had more than 25 years of experience. In group III, for both 5-10 years and 10-15 years of farming experience of farmer was computed as 29.17 percent followed by 15-20 years' experience (16.67 percent) and there was no farmer who had more than 25 years of experience.
Table 4: Distribution of respondents based on vegetable farming experience
Table 4: Distribution of respondents based on vegetable farming experience
Economics of Tomato cultivation
The per hectare cost-return analysis of tomato has been presented in Table 5. The table reveals that the percentage of total working capital to the cost C2 in the zone as a whole was calculated as 58.39 percent. Out of the total working capital, the highest was borne by group I farmers (59.76 percent) and the lowest was borne by the group II farmers (56.87 percent). In terms of the percentage of working capitals to the Cost C2 per hectare, the highest cost per hectare was involved for hired human labour (17.30 percent) followed by 17.11 percent for fertilizers and 5.61 percent for irrigating the crops, 4.78 percent for plant protection chemicals, 4.30 percent for manure, 4.21 percent for tractors/ power tillers for land preparation, 2.44 percent for repairing with the lowest cost involved for purchase of seeds www.extensionjournal.com (0.82 percent). Thus, out of different cost items under total working capital, major part of the expenditure was incurred by the farmers for the purchase of hired human labour and fertilizers. Farmers' group wise analysis reveals that in case of hired human labour, the highest percentage of money was invested by group II (17.66 percent) and the lowest was calculated for group I (16.77 percent) with an average 17.30 percent for all farms as a whole. The percentage of cost involved for tractor/ power tiller for land preparation per hectare area to the cost C2 was found the highest in group II (4.23 percent) and the group I and group III had invested the same percentage of money (4.20 percent). Fertilizers and manures were the very important factors of crop production for harvesting a better yield. The investment on purchase of fertilizers was recorded the highest for group I (17.89 percent) and the lowest was recorded for group II (16.27 percent. The percentage of cost invested for manure was found the highest in group I (5.70 percent) and the lowest was calculated for group II (2.92 percent). It was observed that farmers were using fertilizers and manures in their vegetable fields, but the cost analysis revealed that they did not use in a fixed proportion. The farmers generally used more quantity of fertilizers and comparatively lesser quantity of manures. It might be due to the farmers felt that fertilizers might enhance to increase the productivity of vegetable crops, ignorance about the effect of fertilizers and manures, non-availability of manures in the locality. The more is the application of manure, better is the soil health, more release of nutrients from the fertilizers and ultimately more nutrient uptake by the vegetables and thus obtain a better yield. Regarding the plant protection chemicals, it was observed that the highest percentage of money was spent by group III farmers (4.87 percent) and the lowest was spent by the groups I (4.70 percent). Irrigation has a direct impact on crop production. Out of 5.61 percent cost involved for irrigation, group II invested the highest (5.97 percent) and the lowest was invested by group I (5.33 percent). The most important factor for getting better yield was due to irrigating the crop in proper time. If one could not irrigate the crop at its critical growth stages, a good harvest could not be expected. The imputed value of the family labour for all farms was found to be the highest in group II (20.76 percent) followed by group III (20.13 percent) and group I (19.63 percent) with an average 20.17 percent. The higher percentage of imputed value of family labour indicated involvement of more family labour in vegetable production and vice versa. It is advisable to the farmers that if there was enough family labour, then it would be better to engage them in their own farm activities so as to minimize the cost of hired human labour and this ultimately reduces the cost of cultivation. The market price of the tomato changed with time. It is observed from the table that the average price received by the farmers changed with the farmers' group. The average price of tomato was estimated as Rs. 7.16 per kg out of which the highest average price was received by group III farmers (Rs. 7.28 per kg) followed by group II (Rs. 7.20 per kg) and group I (Rs. 7.00 per kg). The cost C2 per hectare was calculated the highest for group III (Rs. 1,44,086) followed by group I (Rs. 1,40,388) and group II (Rs. 1,36,775) with an average of Rs.1,40,416 per hectare. The per hectare average net return of all farms over cost C2 was calculated as Rs. 1,15,142. The farmers' group wise analysis revealed that the highest net return was received by group III (Rs. 1,24,983) followed by group II (Rs. 1,16,881) and group I (Rs. 1,03,562). Thus, it could be said that the group III farmers were more efficient in brinjal cultivation management practices. The B:C ratio was recorded as the highest in group III (1.87) followed by group II (1.85) and group I (1.74) in the zone with an average of 1.82. Thus, it could be said that cultivation of tomato is a profitable and it could generate good returns. The cost of production for off season tomato per acre in Punjab was estimated as Rs. 5,46,841.04, Rs. 5,42,636.04 and Rs. 5,98,125.66 for small, medium and large farmers, respectively [14] . The economics of kharif tomato cultivation in Latur zone of Maharashtra revealed that per hectare gross returns from kharif tomato was estimated as Rs. 1,02,099.43 with a net profit of Rs. 26,309.71. The benefit-cost ratio was accounted as 1.35 [15] . The study carried out in Yewa North Local Government Area of Ogun State revealed that tomato production is a profitable venture. They also reported that farmers are to be educated on the appropriate combination of inputs for economic optimum output [16] . The cost of cultivation for tomato over the cost C2 was found Rs. 76,417.41 per hectare. The net return over cost C2 was found Rs. 65,139.23 per hectare with the benefit-cost ratio over C2 1.85 [17] .
| — | Amount (in Rs.) | — | — | — |
|---|---|---|---|---|
| Cost items | ||||
| Group I | Group II | Group III | All farms | |
| Cost A1 | ||||
| 23545 | 24150 | 25160 | 24285 | |
| Hired human labour | ||||
| (16.77) | (17.66) | (17.46) | (17.30) | |
| 5900 | 5790 | 6050 | 5913 | |
| Tractor/ Power tiller | ||||
| (4.20) | (4.23) | (4.20) | (4.21) | |
| 1210 | 1100 | 1137 | 1149 | |
| Seeds | ||||
| (0.86) | (0.80) | (0.79) | (0.82) | |
| 25112 | 22250 | 24715 | 24026 | |
| Fertilizers | ||||
| (17.89) | (16.27) | (17.15) | (17.11) | |
| 8000 | 4000 | 6100 | 6033 | |
| Manures | ||||
| (5.70) | (2.92) | (4.23) | (4.30) | |
| 6600 | 6510 | 7014 | 6708 | |
| Plant protection chemicals | ||||
| (4.70) | (4.76) | (4.87) | (4.78) | |
| Irrigation | 7480 | 8160 | 8000 | 7880 |
Table text extracted from the original PDF; superscript letters are shown inline. The original table image is below.
View original table image
Conclusion
Vegetables cultivation is a very important enterprise for upliftment of rural economy. It can create employment opportunity for the rural youths as well as the other farmers.
To get a better harvest, the vegetable growers should strictly follow the improved cultivation practices so that the vegetables can be produced at a minimum cost and receive a maximum return maintaining the quality of products. For this the farmers should put more emphasis on integrated nutrient management, integrated pest and disease management practices. Generally, most farmers are not aware about these practices. So, they should be made aware and educated with the improved cultivation practices of vegetable cultivation. The government should make some policies to facilitate vegetable growers with some demonstrations and training programmes so that they can produce vegetables in a better way and earn more profit.
Acknowledgement
AcknowledgementWith immense pleasure, the authors take the privilege to express his deepest sense of gratitude and indebtedness to the authority of Assam Agricultural University, Jorhat, Assam, India and the Head, Department of Agricultural Economics and Farm Management, Assam Agricultural University, Jorhat for giving an opportunity to carry out the study smoothly, and preparation of the manuscript.
Figures and tables from the paper
| Farmers’ Groups | Educational standards | — | — | — | — | — | Total number of farmers |
|---|---|---|---|---|---|---|---|
| Illiterate | LP | ME | High School | Higher Secondary | Degree and above | ||
| Group I | 2 (2.63) | 4 (5.26) | 12 (15.79) | 12 (15.79) | 31 (40.79) | 15 (19.74) | 76 (100.00) |
| Group II | 1 (2.00) | 4 (8.00) | 13 (26.00) | 14 (28.00) | 17 (34.00) | 1 (2.00) | 50 (100.00) |
| Group III | 0 (0.00) | 2 (8.33) | 2 (8.33) | 7 (29.17) | 9 (37.50) | 4 (16.67) | 24 (100.00) |
| All groups | 3 (2.00) | 10 (6.67) | 27 (18.00) | 33 (22.00) | 57 (38.00) | 20 (13.33) | 150 (100.00) |
Table text extracted from the original PDF; superscript letters are shown inline. The original table image is below.
View original table image
| Farmers’ Group | Number of respondents |
|---|---|
| Group I | 16 (10.67) |
| Group II | 16 (10.67) |
| Group III | 9 (6.00) |
| Total of all groups | 41 (27.33) |
| Total | 150 (150.00) |
Table text extracted from the original PDF; superscript letters are shown inline. The original table image is below.
View original table image
References
13 in the original paper- Ali M, Abedullah A. Nutritional and Economic Benefits of Enhanced Vegetable Production and Consumption. J Crop Prod. 2008;6(1-2):145-176.
- Sharma KK, Gupta RK, Gupta S, Samuel KC. Antihyperglycemic effect of onion: effect on fasting blood sugar and induced hyperglycemia in man. Indian J Med Res. 1977;65:422-29.
- Ali M. Horticulture revolution for the poor: nature, challenges, and opportunities. World Bank, Washington, D.C.; 2008.
- Weinberger K, Lumpkin TA. Diversification into horticulture and poverty reduction: a research agenda. www.extensionjournal.com World Dev. 2007;35(8):1464-1480.
- Hasan MR. An Economic Analysis of Contract Farming for Production and Export of High Value Vegetables in Bangladesh, MS Thesis, Department of Agricultural Economics, Bangladesh Agricultural University, Mymensingh; 2005.
- Singh R, Mangat NS. Elements of Survey Sampling. Springer-Science +Business Media, B.V.; 1996:135136.
- Population Census, Govt. of India. [Online]. Available: www.arcgis.com; 2018.
- Ibitoye SJ, Shaibu UM, Omole B. Analysis of Resource Use Efficiency in Tomato (Solanum lycopersicum) Production in Kogi State, Nigeria. Asian J Agric Extension Econ Sociol. 2015;6(4):220-229.
- Chowdhury F, Rahman MA, Miraruddin M, Khan MHH. Assessment of pesticides and ripening chemicals used in selected vegetables at different locations of Bangladesh. Bangladesh J Agric Res. 2019;44(2):261279.
- Afolami CA, Ayinde IA. Economics of Tomato Production in Yewa North Local Government Area of Ogun State, Nigeria. Agro-Sci. 2001;2(1):17-23.
- Ali Q, Ashfaq M, Khan MTI. An Economic Analysis of Off-season Tomato production in Punjab. J Anim Plant Sci. 2017;27(1):294-301.
- Shelke RD, Chavan RV, Bhogaonkar MM. Economics of Kharif tomato production in Latur district of Maharashtra. Int J Commerce Business Manage. 2016;9(1):77-79.
- Shende NV, Meshram RR. Cost Benefit Analysis and Marketing of Tomato. Am Int J Res Formal Appl Nat Sci. 2015;11(1):46-54.