
Research article · 2024 · Full text
International Journal of Agriculture Extension and Social DevelopmentSolar or electric: A comparison of farm profitability for groundwater-fed irrigation under different water development regimes in western zone of Tamil Nadu
Volume 7(4) · Pages 181–185 · DOI: 10.33545/26180723.2024.v7.i4c.526 ↗
Research areasWater-Energy-Food Nexus Studies
Abstract
Author-writtenThis study evaluated the economic feasibility of adopting solar-powered irrigation systems (SPIS) coupled with drip irrigation for coconut cultivation across different water development regimes in Coimbatore district. Results revealed that SPIS adoption led to significantly higher average coconut yields of 18,650 nuts/ha in over-exploited regions, 19,942 nuts/ha in critical + semi-critical regions, and 20,943 nuts/ha in safe regions. Moreover, SPIS demonstrates lower operational costs, with an average annual operational cost of ?44,714/ha compared to ?65840/ha for conventional methods. The total cost was lower for SPIS users across all regimes, with average total costs of ?1,09,607/ha in over-exploited regions, ?1,05,493/ha in critical + semi-critical regions and ?1,07,396/ha in safe regions. These findings enhanced the economic benefits of SPIS with drip irrigation adoption and highlighted the need for targeted policies to overcome initial investment barriers, promoting sustainable agriculture in water-scarce regions of Tamil Nadu.
Summary
Source-checkedPlain-language reading of the full paper, prepared with AI and checked against the text. Each point links to the authors' own words.
Why it matters
- Agricultural water consumption is leading to a rapid decline in groundwater levels. View evidence ↗
- Declining groundwater tables increase the energy required to pump water for irrigation in water-scarce regions. View evidence ↗
- Solar Powered Irrigation Systems (SPIS) can reduce agricultural dependence on coal-based electricity or diesel. View evidence ↗
What they did
- The researchers used multi-stage stratified random sampling in Coimbatore, Dindigul, and Namakkal, with a focus on Coimbatore due to its high groundwater depletion and technology adoption. View evidence ↗
- A sample of 270 farmers was divided into three groups: solar pumps with micro irrigation (G1), electric pumps with micro irrigation (G2), and conventional methods (G3). View evidence ↗
- Primary data was gathered via personal interviews and pre-tested questionnaires between June and September 2023. View evidence ↗
What they found
- Adopting SPIS resulted in higher average coconut yields: 18,650 nuts/ha in over-exploited regions, 19,942 nuts/ha in critical/semi-critical regions, and 20,943 nuts/ha in safe regions. View evidence ↗
- SPIS had lower average annual operational costs (₹44,714/ha) compared to conventional methods (₹65,840/ha). View evidence ↗
- Total costs were lower for SPIS users across all regimes, averaging ₹1,09,607/ha (over-exploited), ₹1,05,493/ha (critical/semi-critical), and ₹1,07,396/ha (safe). View evidence ↗
- In over-exploited regions, G1 (solar) achieved a higher average net income of ₹1.08 lakhs/ha compared to G2 (electric) at ₹1.01 lakhs/ha and G3 (conventional) at ₹65,707/ha. View evidence ↗
- In critical and semi-critical regions, G1 net income (₹1.27 lakhs/ha) exceeded G2 (₹1.20 lakhs/ha) and G3 (₹71,759/ha). View evidence ↗
What it means
- The authors conclude that SPIS combined with drip irrigation improves coconut productivity and profitability while reducing irrigation costs across all studied regions. View evidence ↗
- The authors recommend that policymakers provide more financial support and awareness programs to encourage the adoption of SPIS. View evidence ↗
- The authors note that widespread adoption of solar pumps is hindered by high initial costs, limited financing, low awareness, and technical or infrastructural constraints. View evidence ↗
Visual summary
3 visualsIllustrations explain the paper; charts are replotted from the paper's own table values.
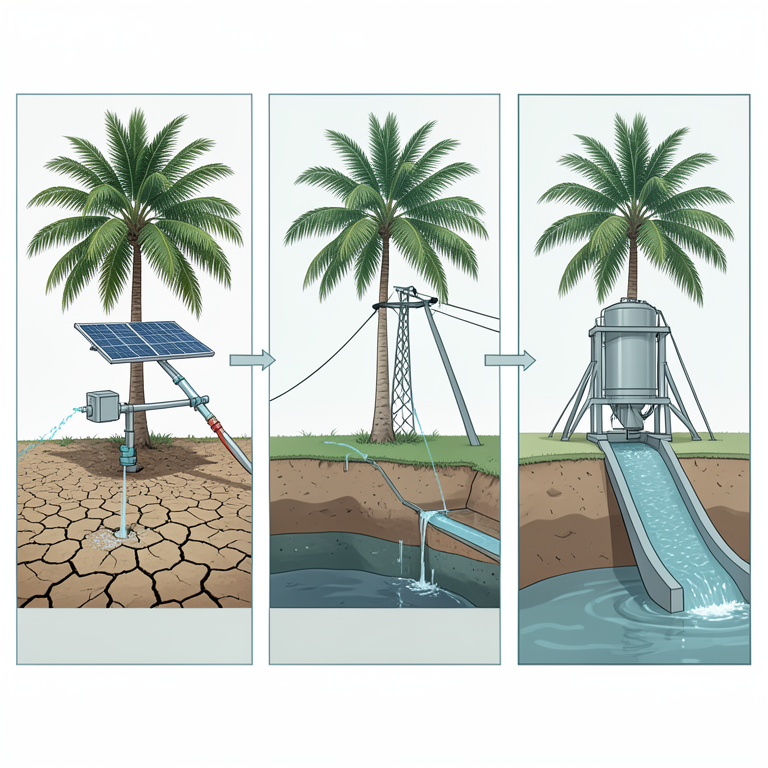
Study Group Comparison
AI-generated conceptual illustration (coconut palms in groundwater-fed irrigation systems). It explains the idea and does not show study data.
View source evidence ↗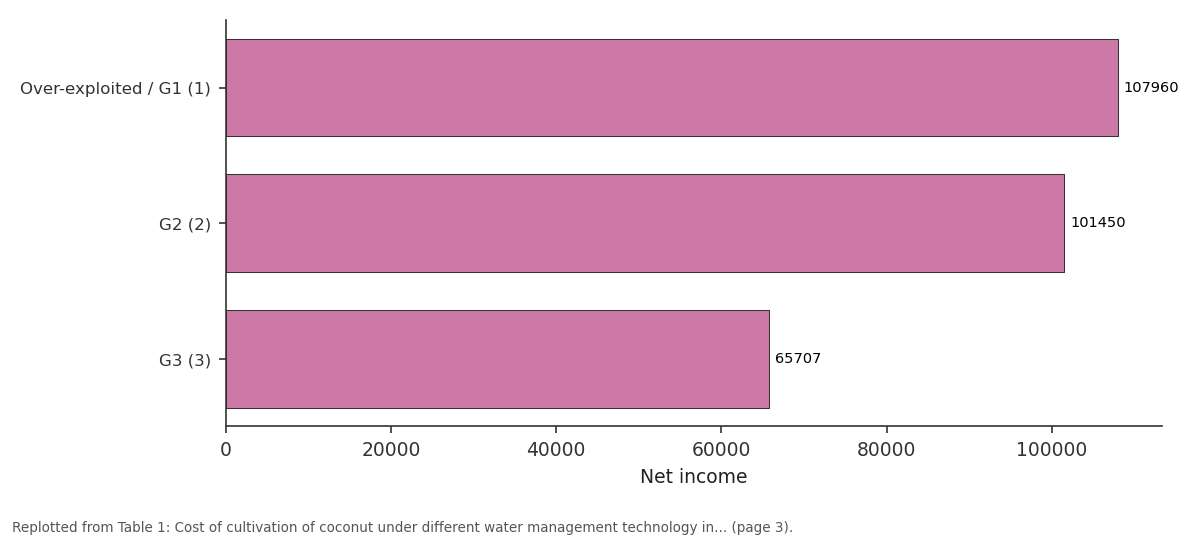
Net income: Over-exploited / G1 (1) vs G2 (2) vs G3 (3)
Replotted from Table 1 (page 3) of the original paper. Every bar is the paper's own table value.
View source evidence ↗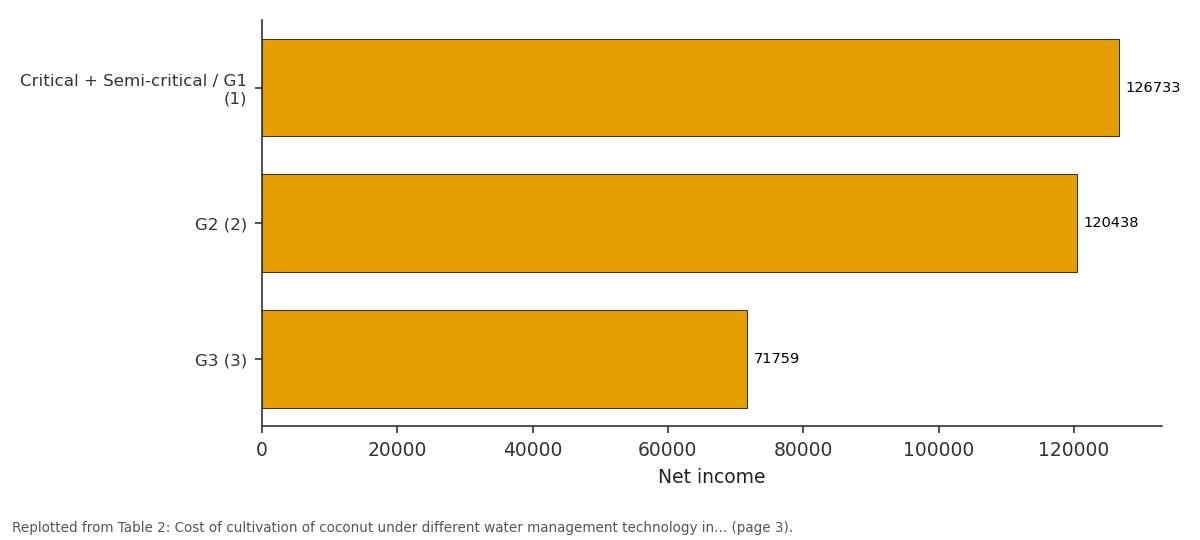
Net income: Critical +... vs G2 (2) vs G3 (3)
Replotted from Table 2 (page 3) of the original paper. Every bar is the paper's own table value.
View source evidence ↗Figures & tables
From the original paper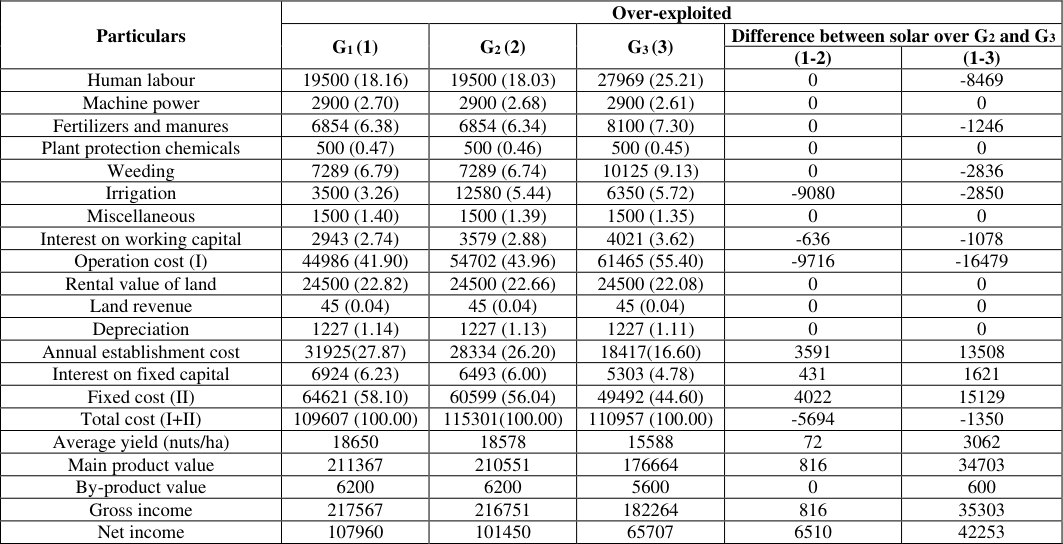 Table 1
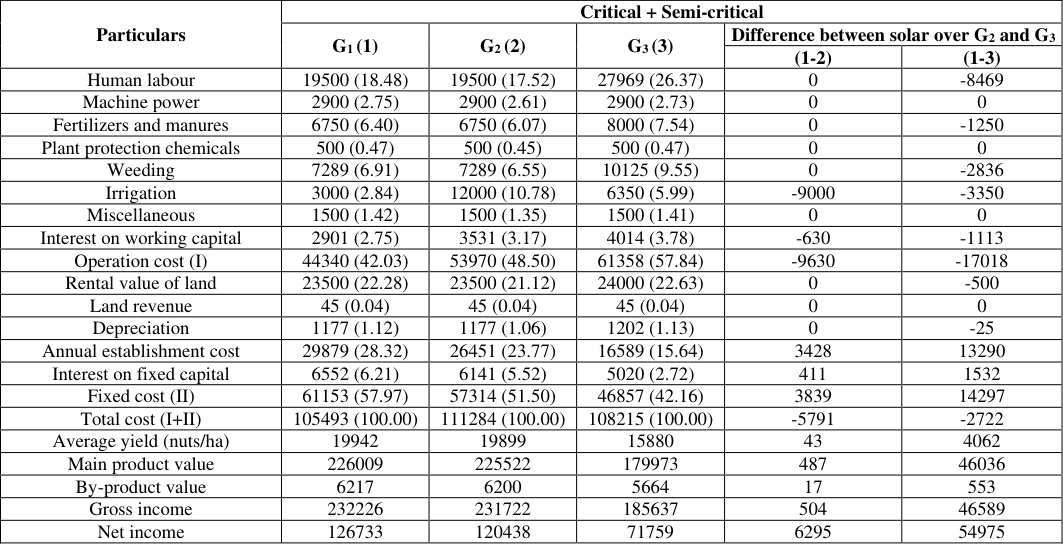 Table 2
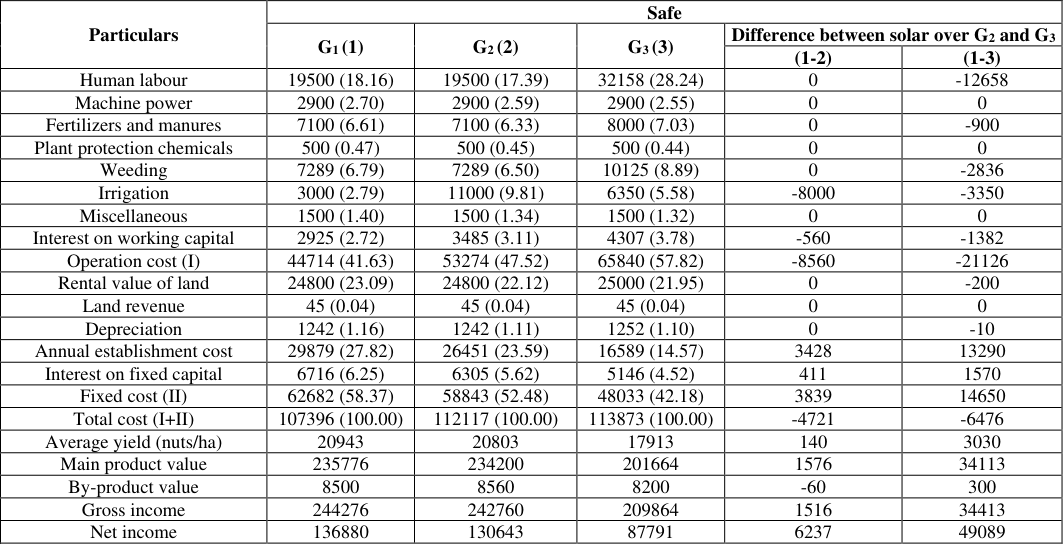 Table 3
Introduction
Increased consumption of water in agriculture causing rapid depletion of groundwater sources; hence groundwater level is decreasing (Kumar et al., 2011) [4] . Pumping of groundwater for irrigation from water-scarce region requires a lot of energy due to the declined groundwater table level (Shah et al., 2018, Sarkar 2020) [8,7] . As a result, the need for energy in agriculture is growing, which is adding to the electricity grid (Sarkar 2020) [7] So, the governments have started to shift their focus from conventional energy to renewable energy sources like solar power in response to increasing concerns about the environmental impact of agriculture. Solar powered irrigation system (SPIS) minimises the dependence on diesel or coal-based electricity. The combination of falling solar panel costs worldwide, fluctuating diesel prices, and the introduction of the 'Tatkal scheme' by TANGEDCO for facilitating electricity connections for farmers has significantly boosted the popularity of solar energy adoption, particularly in rural areas. Farmers' adoption of solar pumps is still slow and relatively limited, despite the government concentrated efforts to encourage this practice. This sluggish adoption can be attributed to various factors such as high initial investment costs, limited access to financing options, inadequate awareness about the benefits of solar irrigation, technical complexities, and infrastructural constraints (Oosthuizen et al., 2005) [6] . These challenges collectively hinder the widespread adoption of solar pumps in agricultural practices, highlighting the need for further interventions and support mechanisms to accelerate their uptake.
SPIS with drip irrigation in Tamil Nadu
Tamil Nadu government is actively promoting the use of solar energy in agriculture through its 'Green Energy in Agriculture' initiative, offering subsidy assistance to farmers for installing Solar Powered Irrigation Systems (SPIS). Since 2012-13, the government has been advocating for offgrid SPIS, with significant support provided during 2021-22, where approximately 5000 solar pump sets up to a capacity of 10 HP received 70 per cent subsidy to benefit farmers. However, to mitigate groundwater over-extraction, the government mandates that solar pumps must be coupled with drip irrigation systems (Majeed et al., 2023) [5] . Honrao (2015) [2] discovered that replacing diesel pumps with Solar-Powered Irrigation Systems (SPIS) led to a substantial reduction in input costs and a notable improvement in productivity and profitability in rural villages of Maharashtra. Jalajakshi & Jagadish (2009) [9] . Found that hat the adoption of drip irrigation technology led to enhanced crop productivity and savings in irrigation labour costs. Selection of irrigation technology has a significant impact on agricultural profitability, resource sustainability, and economic resilience with escalating concerns over water scarcity and energy costs ((Kumar 2007) [3] . The main objective of the study is to examine the cost and returns of coconut cultivation under solar pump irrigation across various water development regimes, comparing them with electric pump systems and also assessed the impact of irrigation system i.e. with drip and without drip irrigation. In Coimbatore district, nearly 70 per cent of the farmers cultivate coconut crop. Coconut crop cultivation in overexploited conditions was found to be less energy efficient than less-exploited region (Gurunathan and Palanisami 2008) [1] . Coimbatore district, with over 300 sunny days annually, stands as an ideal region for solar pump adoption, promising both water and energy conservation in agriculture.
Methodology Sampling framework
The study employed multi-stage stratified random sampling, focusing on regions with significant groundwater depletion, especially in Coimbatore, Dindigul, and Namakkal. Coimbatore district was chosen due to its pronounced groundwater depletion and higher adoption rates of water management technologies like drip irrigation and solar pumps. A cross-sectional descriptive sampling approach was utilized to select farmers using various irrigation methods, including solar pumps with micro irrigation (G 1 ), electric pumps with micro irrigation (G 2 ) and conventional methods (G 3 ) as control. A total of 270 farmers were randomly selected across different water development regimes to represent the study sample.
Data
The primary data was collected from the sample respondents during June to September 2023. Primary data was collected using a well-structured and pre-tested questionnaires through personal interviews with the sample respondents. The interview schedule covered the general aspects of the sample farmers such as age, educational status, occupation, family size, land holding, cropping pattern, crop yield, cost of production (input cost and realised cost on output) for various crops. The data collected were processed, tabulated, and then statistical analysis was performed.
Cost concepts
Cost concept method for perennial crop was used to calculate the cost and returns of sample farmers. Cost of Cultivation for Perennial crops:
Establishment cost
The establishment cost for starting a plantation were compiled item by item.
Over-exploited region
The cost of cultivation and income details for coconut farmers in overexploited region under different water management technology are presented in Table 1. The total cost of cultivation per hectare of coconut crop under G 1 with ₹1.10 lakhs/ha is marginally lower than that of G 2 and G 3 are ₹1.15 lakhs/ha and ₹1.11 lakhs/ha respectively. The difference between G 1 and other category farmers in annual establishment cost shows a positive difference of ₹3591/ha over G 2 and ₹13508/ha over G 3 . Unlike other crops, human labour occupies major share of about 18.16 per cent, 18.03 per cent and 25.21 per cent in G 1 , G 2 and G 3 respectively. The average yield of coconut in G 1 is 18650 nuts/ha, which is higher than G 2 and G 3 category farmers yield by 72 nuts/ha and 3062 nuts/ha respectively. The Average net income of G 1 is ₹1.08 lakhs/ha is higher than G 2 with ₹1.01 lakhs/ha and G 3 with ₹65707/ha, the difference in net income of G 1 irrigation of coconut in overexploited region over G 2 and G 3 are ₹6510/ha and ₹42253/ha. www.extensionjournal.com
| Particulars | Over-exploited | — | — | — | — |
|---|---|---|---|---|---|
| G1 (1) | G2 (2) | G3 (3) | Difference between solar over G2 and G3 | ||
| (1-2) | (1-3) | ||||
| Human labour | 19500 (18.16) | 19500 (18.03) | 27969 (25.21) | 0 | -8469 |
| Machine power | 2900 (2.70) | 2900 (2.68) | 2900 (2.61) | 0 | 0 |
| Fertilizers and manures | 6854 (6.38) | 6854 (6.34) | 8100 (7.30) | 0 | -1246 |
| Plant protection chemicals | 500 (0.47) | 500 (0.46) | 500 (0.45) | 0 | 0 |
| Weeding | 7289 (6.79) | 7289 (6.74) | 10125 (9.13) | 0 | -2836 |
| Irrigation | 3500 (3.26) | 12580 (5.44) | 6350 (5.72) | -9080 | -2850 |
| Miscellaneous | 1500 (1.40) | 1500 (1.39) | 1500 (1.35) | 0 | 0 |
| Interest on working capital | 2943 (2.74) | 3579 (2.88) | 4021 (3.62) | -636 | -1078 |
| Operation cost (I) | 44986 (41.90) | 54702 (43.96) | 61465 (55.40) | -9716 | -16479 |
| Rental value of land | 24500 (22.82) | 24500 (22.66) | 24500 (22.08) | 0 | 0 |
| Land revenue | 45 (0.04) | 45 (0.04) | 45 (0.04) | 0 | 0 |
| Depreciation | 1227 (1.14) | 1227 (1.13) | 1227 (1.11) | 0 | 0 |
| Annual establishment cost | 31925(27.87) | 28334 (26.20) | 18417(16.60) | 3591 | 13508 |
| Interest on fixed capital | 6924 (6.23) | 6493 (6.00) | 5303 (4.78) | 431 | 1621 |
| Fixed cost (II) | 64621 (58.10) | 60599 (56.04) | 49492 (44.60) | 4022 | 15129 |
| Total cost (I+II) | 109607 (100.00) | 115301(100.00) | 110957 (100.00) | -5694 | -1350 |
| Average yield (nuts/ha) | 18650 | 18578 | 15588 | 72 | 3062 |
| Main product value | 211367 | 210551 | 176664 | 816 | 34703 |
| By-product value | 6200 | 6200 | 5600 | 0 | 600 |
| Gross income | 217567 | 216751 | 182264 | 816 | 35303 |
| Net income | 107960 | 101450 | 65707 | 6510 | 42253 |
Table text extracted from the original PDF; superscript letters are shown inline. The original table image is below.
View original table image
Critical + Semi-critical region
The cost of cultivation and income details for coconut farmers in critical + semi-critical region under different water management technology is presented in Table 2. The total cost of cultivation per hectare of coconut crop under G 1 with ₹1.05 lakhs/ha is marginally lower than that of G 2 and G 3 are ₹1.11 lakhs/ha and ₹1.08 lakhs/ha respectively. The average yield of coconut in G 1 is 19942 nuts/ha, which is higher than G 2 and G 3 category farmers yield by 43 nuts/ha and 4062 nuts/ha respectively. The Average net income of G 1 is ₹1.27 lakhs/ha is higher than G 2 with ₹1.20 lakhs/ha and G 3 with ₹71759/ha, the difference in net income of G 1 irrigation of coconut in critical + semi-critical region over G 2 and G 3 are ₹6295/ha and ₹54975/ha.
| Particulars | Critical + Semi-critical | — | — | — | — |
|---|---|---|---|---|---|
| G1 (1) | G2 (2) | G3 (3) | Difference between solar over G2 and G3 | ||
| (1-2) | (1-3) | ||||
| Human labour | 19500 (18.48) | 19500 (17.52) | 27969 (26.37) | 0 | -8469 |
| Machine power | 2900 (2.75) | 2900 (2.61) | 2900 (2.73) | 0 | 0 |
| Fertilizers and manures | 6750 (6.40) | 6750 (6.07) | 8000 (7.54) | 0 | -1250 |
| Plant protection chemicals | 500 (0.47) | 500 (0.45) | 500 (0.47) | 0 | 0 |
| Weeding | 7289 (6.91) | 7289 (6.55) | 10125 (9.55) | 0 | -2836 |
| Irrigation | 3000 (2.84) | 12000 (10.78) | 6350 (5.99) | -9000 | -3350 |
| Miscellaneous | 1500 (1.42) | 1500 (1.35) | 1500 (1.41) | 0 | 0 |
| Interest on working capital | 2901 (2.75) | 3531 (3.17) | 4014 (3.78) | -630 | -1113 |
| Operation cost (I) | 44340 (42.03) | 53970 (48.50) | 61358 (57.84) | -9630 | -17018 |
| Rental value of land | 23500 (22.28) | 23500 (21.12) | 24000 (22.63) | 0 | -500 |
| Land revenue | 45 (0.04) | 45 (0.04) | 45 (0.04) | 0 | 0 |
| Depreciation | 1177 (1.12) | 1177 (1.06) | 1202 (1.13) | 0 | -25 |
| Annual establishment cost | 29879 (28.32) | 26451 (23.77) | 16589 (15.64) | 3428 | 13290 |
| Interest on fixed capital | 6552 (6.21) | 6141 (5.52) | 5020 (2.72) | 411 | 1532 |
| Fixed cost (II) | 61153 (57.97) | 57314 (51.50) | 46857 (42.16) | 3839 | 14297 |
| Total cost (I+II) | 105493 (100.00) | 111284 (100.00) | 108215 (100.00) | -5791 | -2722 |
| Average yield (nuts/ha) | 19942 | 19899 | 15880 | 43 | 4062 |
| Main product value | 226009 | 225522 | 179973 | 487 | 46036 |
| By-product value | 6217 | 6200 | 5664 | 17 | 553 |
| Gross income | 232226 | 231722 | 185637 | 504 | 46589 |
| Net income | 126733 | 120438 | 71759 | 6295 | 54975 |
Table text extracted from the original PDF; superscript letters are shown inline. The original table image is below.
View original table image
Safe region
It is evident from the table 3, safe region follows similar trend with over-exploited and critical + semi-critical region including operational cost, annual establishment cost, productivity and net income. The yield difference of coconut crop under G 1 is highest with the average yield of 20943 nuts/ha, the yield difference of G 1 over G 2 and G 3 are 140 nuts/ha and 3030 nuts/ha, respectively. The Average net income of G 1 is ₹1.37 lakhs/ha is higher than G 2 with ₹1.31 lakhs/ha and G 3 with ₹87791/ha, the difference in net income of G 1 irrigation of coconut in safe region over G 2 and G 3 are ₹6237/ha and ₹49089/ha. All regions have comparable costs, but yields differ. The reduced use of water in particular regions was the cause of the yield difference.
| Particulars | Safe | — | — | — | — |
|---|---|---|---|---|---|
| G1 (1) | G2 (2) | G3 (3) | Difference between solar over G2 and G3 | ||
| (1-2) | (1-3) | ||||
| Human labour | 19500 (18.16) | 19500 (17.39) | 32158 (28.24) | 0 | -12658 |
| Machine power | 2900 (2.70) | 2900 (2.59) | 2900 (2.55) | 0 | 0 |
| Fertilizers and manures | 7100 (6.61) | 7100 (6.33) | 8000 (7.03) | 0 | -900 |
| Plant protection chemicals | 500 (0.47) | 500 (0.45) | 500 (0.44) | 0 | 0 |
| Weeding | 7289 (6.79) | 7289 (6.50) | 10125 (8.89) | 0 | -2836 |
| Irrigation | 3000 (2.79) | 11000 (9.81) | 6350 (5.58) | -8000 | -3350 |
| Miscellaneous | 1500 (1.40) | 1500 (1.34) | 1500 (1.32) | 0 | 0 |
| Interest on working capital | 2925 (2.72) | 3485 (3.11) | 4307 (3.78) | -560 | -1382 |
| Operation cost (I) | 44714 (41.63) | 53274 (47.52) | 65840 (57.82) | -8560 | -21126 |
| Rental value of land | 24800 (23.09) | 24800 (22.12) | 25000 (21.95) | 0 | -200 |
| Land revenue | 45 (0.04) | 45 (0.04) | 45 (0.04) | 0 | 0 |
| Depreciation | 1242 (1.16) | 1242 (1.11) | 1252 (1.10) | 0 | -10 |
| Annual establishment cost | 29879 (27.82) | 26451 (23.59) | 16589 (14.57) | 3428 | 13290 |
| Interest on fixed capital | 6716 (6.25) | 6305 (5.62) | 5146 (4.52) | 411 | 1570 |
| Fixed cost (II) | 62682 (58.37) | 58843 (52.48) | 48033 (42.18) | 3839 | 14650 |
| Total cost (I+II) | 107396 (100.00) | 112117 (100.00) | 113873 (100.00) | -4721 | -6476 |
| Average yield (nuts/ha) | 20943 | 20803 | 17913 | 140 | 3030 |
| Main product value | 235776 | 234200 | 201664 | 1576 | 34113 |
| By-product value | 8500 | 8560 | 8200 | -60 | 300 |
| Gross income | 244276 | 242760 | 209864 | 1516 | 34413 |
| Net income | 136880 | 130643 | 87791 | 6237 | 49089 |
Table text extracted from the original PDF; superscript letters are shown inline. The original table image is below.
View original table image
Conclusion
The analysis revealed that SPIS with drip irrigation enhanced crop productivity and profitability in all regions with reduced irrigation cost. Farmers utilizing SPIS demonstrated higher average yields of coconut and increased net incomes compared to those employing conventional irrigation methods. Furthermore, the study highlights the regional disparities in costs, yields and net incomes, emphasizing the need for tailored approaches to address varying groundwater situations and climatic conditions. Policymakers should prioritize incentivizing SPIS adoption through enhanced financial support and awareness programs. Additionally, investment in infrastructure and technical assistance can further facilitate widespread adoption. Embracing SPIS represents a crucial step towards sustainable agriculture, resource conservation and economic resilience in water-scarce regions.
Acknowledgement
AcknowledgementThis paper is based mainly on a study conducted by the first author with funding support from the Indian Council of Social Science Research (ICSSR), New Delhi, under the ICSSR Short-Term Doctoral Fellowship programme. However, responsibility for any errors lies only with the authors.
References
8 in the original paper- Gurunathan S, Palanisami K. Energy use and its efficiency in Tamil Nadu agriculture: a case study of different groundwater development regions in Coimbatore District of Tamil Nadu. Agric Econ Res Rev. 2008;21(1):48-53.
- Honrao P. Economic viability of solar irrigation pumps for sustainable agriculture in Maharashtra: adoption response by farmers. Glob J Res Anal. 2015;4:43-47.
- Kumar MD, Scott CA, Singh OP. Inducing the shift from flat-rate or free agricultural power to metered supply: implications for groundwater depletion and power sector viability in India. J Hydrol. 2011;409(12):382-394.
- Majeed Y, Khan MU, Waseem M, Zahid U, Mahmood F, Majeed F, et al. Renewable energy as an alternative source for energy management in agriculture. Energy Reports. 2023;10:344-359.
- Oosthuizen LK, Botha PW, Grove B, Meiring JA. Costestimating procedures for drip-, micro-and furrowirrigation systems. Water SA. 2005;31(3):403-406.
- Sarkar A. Groundwater irrigation and farm power policies in Punjab and West Bengal: challenges and opportunities. Energy Policy. 2020;140:111437. www.extensionjournal.com
- Shah T, Rajan A, Rai GP, Verma S, Durga N. Solar pumps and South Asia's energy-groundwater nexus: exploring implications and reimagining its future. Environ Res Lett. 2018;13(11):115003.
- Jalajakshi CK, Jagadish N. Economics of Krishik Bandhu drip irrigation: An empirical analysis. Agricultural Economics Research Review. 2009;22(1):161-4.
Cited by 1
From OpenAlex, OpenCitations and reference lists read by Scinovex
- Comparative Analysis of Profitability, Water and Energy Productivity in Curry Leaf Cultivation: Drip vs. Conventional Production Systems in Coimbatore district, India ↗
P.V. Aishwarya, D. Suresh Kumar, Balaji Kannan, R. Pangayar Selvi, A. Surendran · Journal of Experimental Agriculture International · 2024
The aim is to analyze the cost and returns of curry leaf production under different irrigation methods, assess water and energy productivity and draw conclusions regarding the sustainability and profitability of drip irrigation. The study utilizes a sample of 60 respondents from two blocks in Coimbatore district, employing a multi-stage random sampling technique. Primary data was collected through structured questionnaires…
❝ 0PDF