
Research article · 2024 · Full text
International Journal of Agriculture Extension and Social DevelopmentSocio-economic profile of the farmers and effect of multimedia on their knowledge enhancement of maize
Volume 7(4) · Pages 111–119 · DOI: 10.33545/26180723.2024.v7.i4b.506 ↗
Research areasAgriculture Market Analysis UkraineDigitalization and Economic Development in AgricultureGlobal Trade and Competitiveness
Abstract
Author-writtenThis paper provides an overview of the agricultural landscape in Punjab, India, focusing on the socio-economic dynamics of farming communities in five villages of SAS Nagar, Mohali area: Sahauran, Hasanpur, Radiala, Ghataur, and Allahpur. It highlights the significance of agriculture as the mainstay of sustenance, with Punjab being recognized as the
Summary
Source-checkedPlain-language reading of the full paper, prepared with AI and checked against the text. Each point links to the authors' own words.
Why it matters
- Maize is a critical staple crop, particularly for people in impoverished rural areas where it serves as a primary food source. View evidence ↗
- Multimedia tools like digital platforms, radio, television, and mobile phones have become increasingly important for delivering agricultural knowledge to farmers. View evidence ↗
The question
- The study aims to investigate the socio-economic characteristics of farmers, including land ownership, academic achievement, income levels, and social networks. View evidence ↗
- The research also seeks to provide evidence-based insights to improve strategies for managing pest infestations in maize crops. View evidence ↗
What they did
- The study conducted interviews with 60 farmers in Mohali, Punjab, India. View evidence ↗
- The research focused on farmers from five specific villages in SAS Nagar, Punjab: Sahauran, Hasanpur, Ghataur, Radiala, and Allahpur. View evidence ↗
- To measure knowledge enhancement, farmers were given the same set of questions before and after watching educational videos about maize pest infestation. View evidence ↗
What they found
- The largest age group among the surveyed farmers was 50-65 years, representing 46.6% of the participants. View evidence ↗
- Mobile phone ownership was very high at 96%, with 75% of those owners having internet access. View evidence ↗
- Newspapers were the most common source of information for farmers, used by 93% of respondents. View evidence ↗
- Watching the educational video significantly increased knowledge, with the mean score rising from 6 to 13 and the mean percentage increasing from 38% to 76%. View evidence ↗
What it means
- The authors conclude that innovative tools like video questionnaires should continue to be used to improve agricultural extension services and promote sustainable farming. View evidence ↗
Visual summary
3 visualsIllustrations explain the paper; charts are replotted from the paper's own table values.
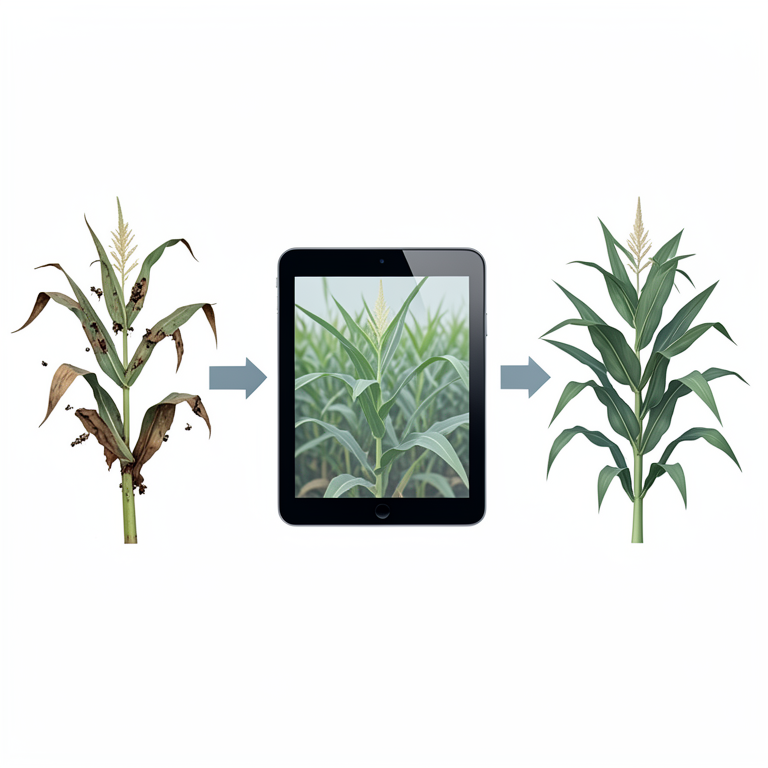
Knowledge Enhancement Process
AI-generated conceptual illustration (maize plants and a digital tablet). It explains the idea and does not show study data.
View source evidence ↗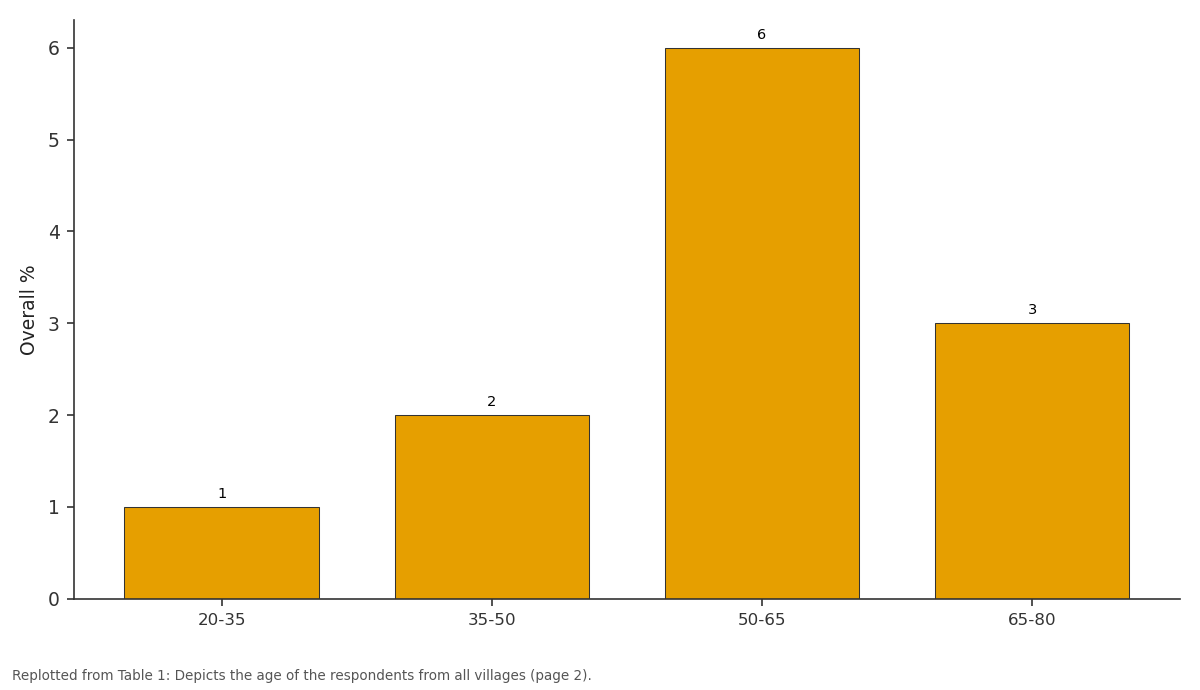
Ghataur n=12: 20-35 vs 35-50 vs 50-65 vs 65-80
Replotted from Table 1 (page 2) of the original paper. Every bar is the paper's own table value.
View source evidence ↗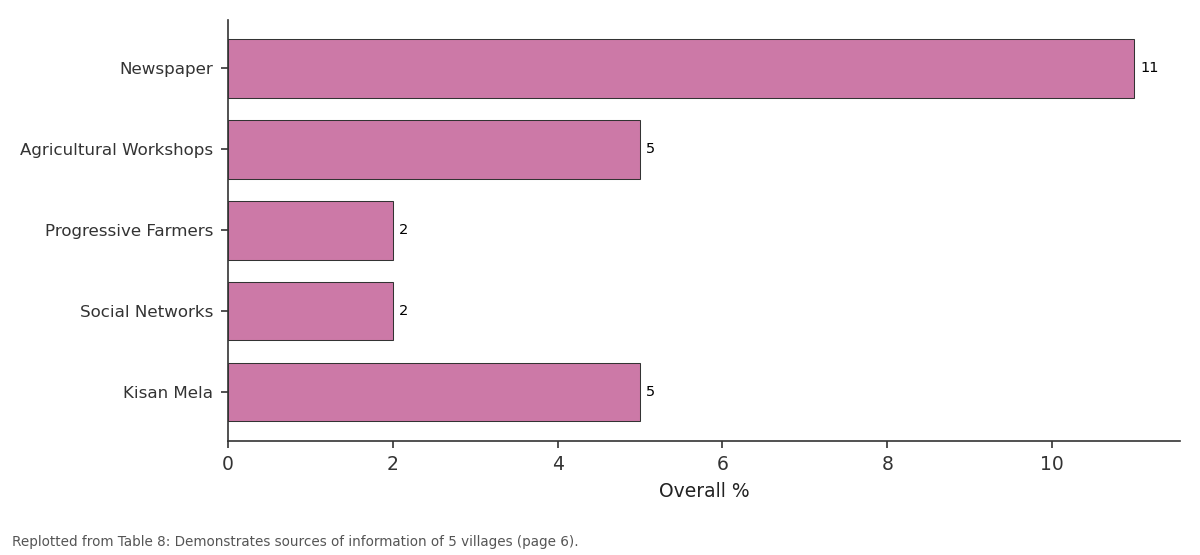
Ghataur n=12: Newspaper vs Agricultural Workshops vs Progressive Farmers vs Social Networks vs Kisan Mela
Replotted from Table 8 (page 6) of the original paper. Every bar is the paper's own table value.
View source evidence ↗Figures & tables
From the original paper Table 1Page 2
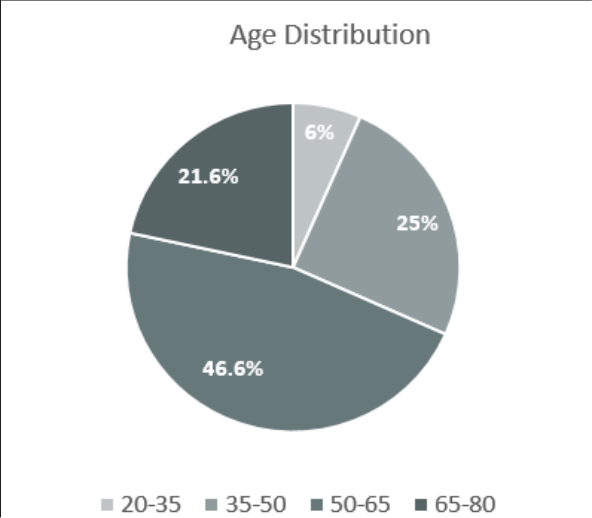 Figure 1Page 2
 Table 2Page 3
 Table 3Page 3
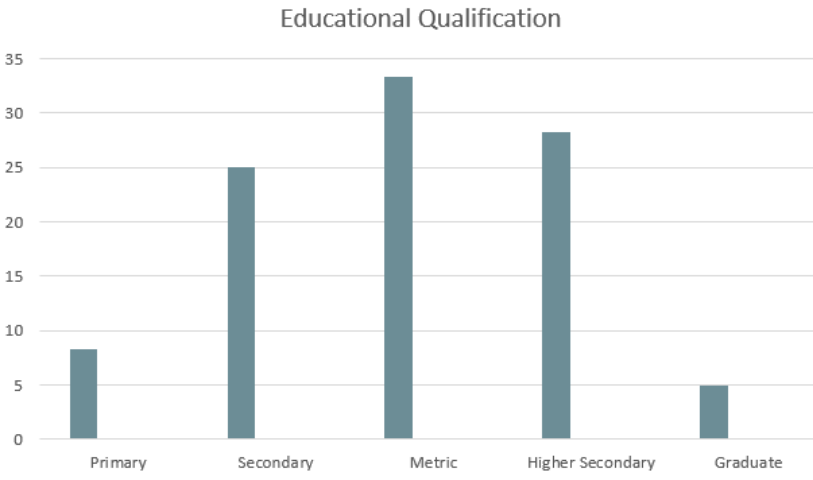 Figure 2Page 3
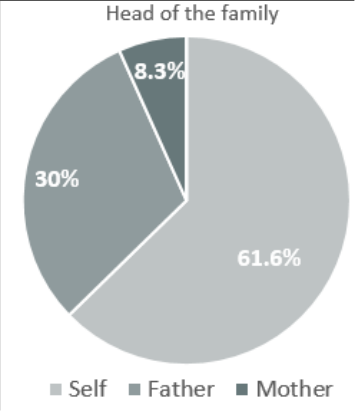 Figure 3Page 3
 Table 4Page 4
 Table 5Page 4
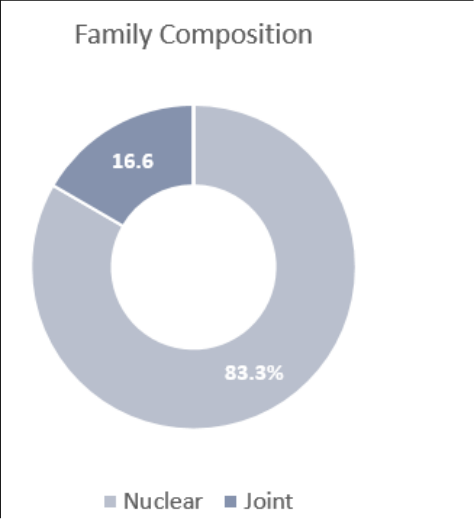 Figure 4Page 4
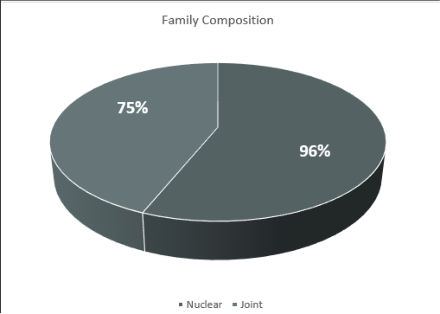 Figure 5Page 4
 Table 6Page 5
 Table 7Page 5
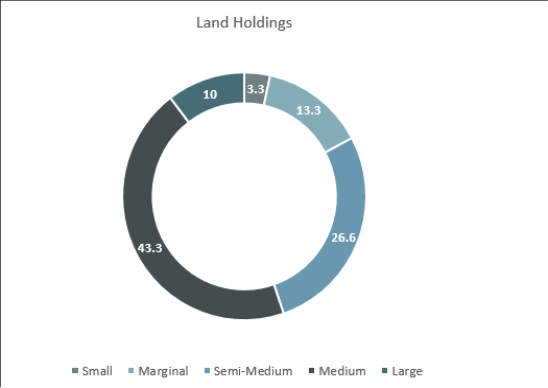 Figure 6Page 5
 Table 8Page 6
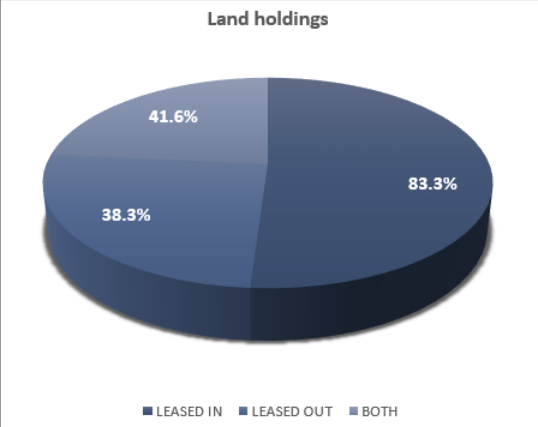 Figure 7Page 6
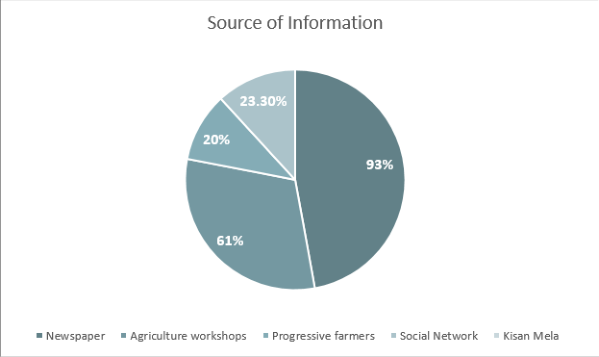 Figure 8Page 6
 Table 9Page 7
 Table 10Page 7
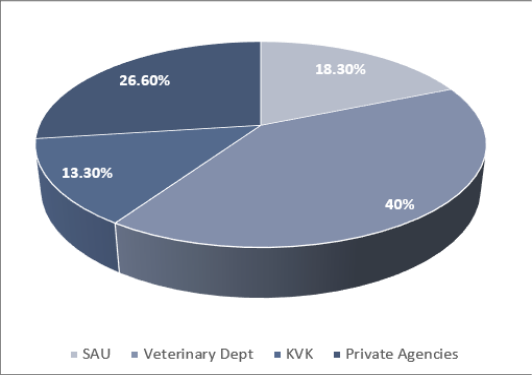 Figure 9Page 7
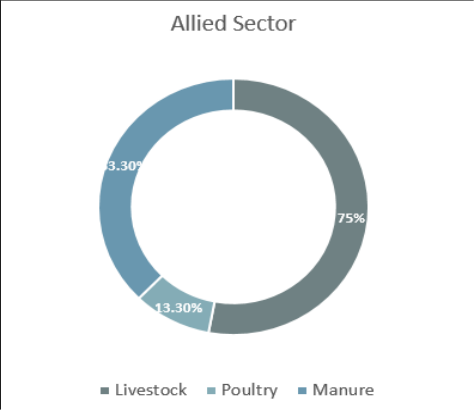 Figure 10Page 7
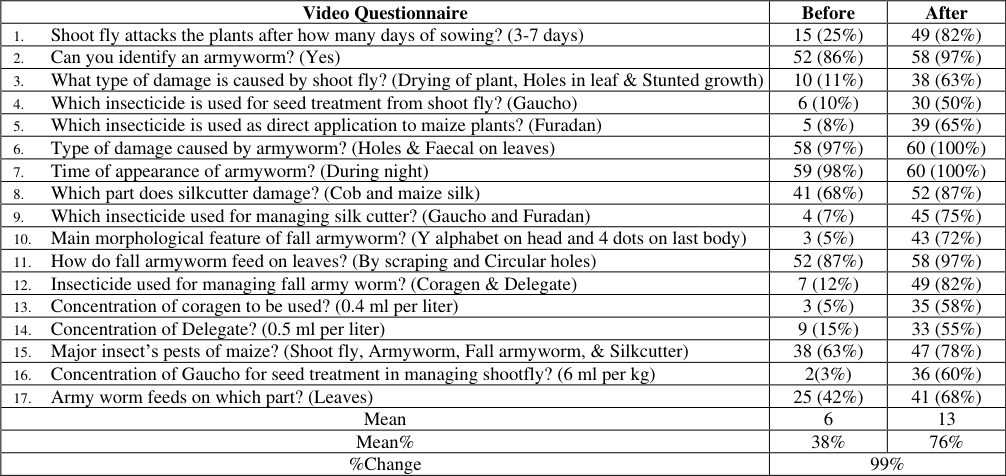 Table 10Page 8
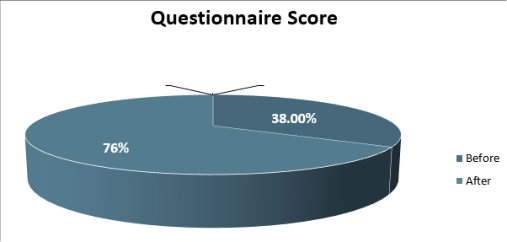 Figure 11Page 8
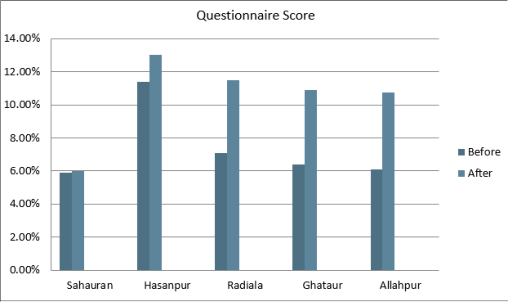 Figure 12Page 8
 Table 12Page 9
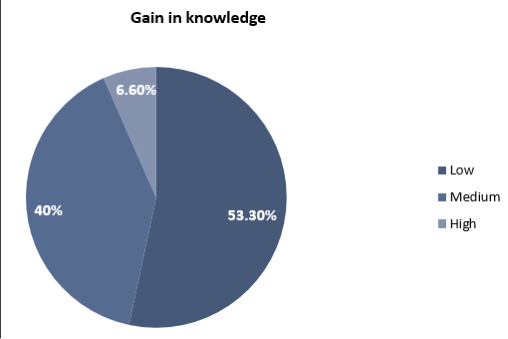 Figure 13Page 9
Introduction
Agriculture is the main source of food production and the supply of vital nutrients for human consumption. The forward-thinking Indian state of Punjab has earned the moniker "Granary of India". Encompassing a total geographical expanse of 5.03 million hectares, Punjab dedicates 4.20 million hectares, constituting 83%, to cultivation. The cropping intensity in Punjab is recorded at 189% [1] . For over 65% of the population, agriculture is not just an occupation but a way of life, shaped by the transformative impact of the Green Revolution and accompanied by challenges such as land fragmentation and excessive resource utilization. The Indian government and the Reserve Bank of India have issued special directives and credit-linked subsidies in an effort to give small and marginal farmers and agricultural laborers top priority when it comes to credit disbursement [4] . This study aims to investigate the socioeconomic characteristics of farmers by looking at important variables like social networks, land ownership, income levels, and academic achievement. Simultaneously, the importance of multimedia-including digital platforms, radio, television, and mobile phones has grown as a means of supplying farmers with agricultural knowledge and information [5] .Through an awareness of the interaction between the socio-economic status of farmers and the use of multimedia tools, policymakers and development professionals can create focused interventions that raise incomes, boost agricultural output, and support farming communities' sustainable means of subsistence. In this context, the role of innovative and effective communication channels is pivotal [2] . In recent times, the challenges associated with conveying information about farm technology to farmers have captured the attention of agricultural extension scientists in India. The timely delivery of information is acknowledged as a critical factor influencing behavioural change among recipients. Maize is a staple crop in many parts of the world; for the indigenous people living in impoverished rural areas, it is especially important because it makes their daily bread. They claim that the grain from the crop is the main reason it is grown-it is eaten by humans [3] . Maize plays a crucial role in Punjab's agriculture, contributing to both food security and economic growth. Substantial cultivation area, as indicated by statistics, underscores its importance in shaping the state's agricultural landscape.This study aims to enhance strategies for managing pest infestation in maize by providing evidence-based insights [6] . These insights can serve as guidance for formulating policies, prioritizing research, and implementing extension initiatives by arming farmers with the necessary knowledge and resources, we can enhance the resilience and sustainability of maize production systems. This, in turn, ensures food security for both present and future generations [7] . www.extensionjournal.com Employing a questionnaire-based approach, primary data was gathered. Interviews with 60 farmers were conducted and documented at the University Institute of Agricultural Sciences, Chandigarh University, Mohali, Punjab, India. The data collection adopted a quantitative approach, primarily relying on a census conducted in these five villages, covering 60 households inclusive of farmers, government employees, and self-employed business owners. The methodology involved systematic questionnaires, doorto-door interviews, direct observation, focus group discussions, community group interviews and video communications as rapid evaluation methods. This study aimed to understand the socio-economic status of farmers in Sahauran, Hasanpur, Ghataur, Radiala and Allahpur villages in Kharar Tehsil of SAS Nagar district, Punjab. Data collection involved a questionnaire based on primary sources, with recorded interviews of 60 farmers. Prestructured sessions were organized to formulate the survey questionnaire, aligning with the study's objectives. In the following recorded data below, percentages are also provided for a better understanding using the formula: Percentage (%) = N/ n*100 Where, N = total no. of respondents from all the 5 villages i.e., 60 respondents. n = the no. of respondents from each village.
Results and Declarations
From the data collected from 60 farmers residing in 5 villages, the following observations were made:
Age
The primary factors influencing every occupation are age and qualifications. According to the gathered data, a majority of farmers, accounting for 46.6%, fall within the age group of 50-65. Additionally, 25% of farmers belong to the 35-50 age bracket, while 21.6% fall into the 65-80 age range. Moreover, 6.66% of farmers are aged between20-35, as illustrated in Table 1 and Figure 1.
Education
The educational background of the 60 farmers across all five villages revealed that 8.3% had received primary school education,25% had attended secondary level school education,33.3% had completed their Metric, 28.3% had attained a higher secondary school education and5% had graduated, as depicted in Figure 2. The number of illiterate farmers was minimal. Yet,on the flip side the number of graduates among the farmers too remain minimum. They attributed their lack of education to a previous undervaluation of its importance. However, over time, they recognized its significance and actively encouraged their children to pursue education by enrolling them in schools and colleges, as detailed in
Head of the family
The head of the family in an agricultural household plays a pivotal role in decision-making, resource allocation, and overall management of the farm, influencing the family's economic stability. Among the 60 families, 61.6% had the farmer itself as the head of the family, followed by 30% headed by the father and 8.3% had the mother as the head of the family as detailed in Table 3 and illustrated in Figure 3.
Family composition
The survey revealed that the majority of respondents, specifically 99% from the selected villages, fall into the General category. While other categories are present in these areas, a significant portion is not comprised of landlords or farmers; instead, they are involved in various occupations. Table 4 and Figure 4 illustrate the distribution of family types. The data indicates that 83.3% of respondents live in nuclear families, while only 16.6% of farmers opt for joint family setups.
Mobile phone & internet connectivity
In total, 96% of the respondents possess mobile phones, and among them, 75% avail internet connectivity on their mobile devices. Only 4% of the respondents do not own any type of mobile phone. It's worth mentioning that all respondents in Village Radiala not only own mobile phones, but the whole lot of them have access to internet facilities, as indicated in Table 5 and illustrated in Figure 5.
Land holdings
According to the land holding capacity of the farmers, they can be classified into 5 categories of farmers. Table 6 presents a breakdown of the farmers, with 3.3% falling into the small farmer category, managing less than 1 hectare of land. Following this, 13.3% belong to the marginal category, with land holding between 1-2 hectares. Semi-medium category consists of 26.6% with a holding of land of 2-4 hectares and the medium farmer group with 4-10 hectares of land, comprises 43.3% of the total. The final category consists of large farmers, encompassing 10% who possess more than 10 hectares of land, as depicted in Figure 6. 7 and Figure 7.
Source of information
Each respondent relies on various sources of information and extension contacts. Approximately 20% of the total respondents maintain contact with progressive farmers, serving as valuable sources of information on farming methods, agro-chemicals and new seeds. A vast majority of farmers seek information from newspapers (93%), agricultural workshops (61%), and Kisan melas, with field visits contributing to skill enhancement for approximately 66.6% of respondents attending events in their nearby areas. Furthermore, 23.3% of young farmers utilize agricultural apps and groups on their phones for information, as illustrated in Table 8 and Figure 8.
Extension contact
In the agricultural industry, extension contacts are essential because they give farmers access to critical information, cutting-edge methods, and best practices that increase crop yields and efficiency. According to the data collected, 18.3% gathers information from State agricultural universities, 40% from the veterinary department. Private agencies manage to provide 26.6% extension contact to the farmer, whereas Krishi Vigyan Kendra had a participation of 13.3% among the farmers, as showcased in the Table 9 and represented in Figure 9. www.extensionjournal.com
Allied sectors
The farmers highlighted that the allied sectors play a vital role in their rural communities by broadening farmers' income streams. As illustrated in the table 10 and figure 10, all over the five villages 75% of farmers maintain livestock and associated with it, 53.3% farmers produce manure.
| Video Questionnaire | Before | After |
|---|---|---|
| 1. Shoot fly attacks the plants after how many days of sowing? (3-7 days) | 15 (25%) | 49 (82%) |
| 2. Can you identify an armyworm? (Yes) | 52 (86%) | 58 (97%) |
| 3. What type of damage is caused by shoot fly? (Drying of plant, Holes in leaf & Stunted growth) | 10 (11%) | 38 (63%) |
| 4. Which insecticide is used for seed treatment from shoot fly? (Gaucho) | 6 (10%) | 30 (50%) |
| 5. Which insecticide is used as direct application to maize plants? (Furadan) | 5 (8%) | 39 (65%) |
| 6. Type of damage caused by armyworm? (Holes & Faecal on leaves) | 58 (97%) | 60 (100%) |
| 7. Time of appearance of armyworm? (During night) | 59 (98%) | 60 (100%) |
| 8. Which part does silkcutter damage? (Cob and maize silk) | 41 (68%) | 52 (87%) |
| 9. Which insecticide used for managing silk cutter? (Gaucho and Furadan) | 4 (7%) | 45 (75%) |
| 10. Main morphological feature of fall armyworm? (Y alphabet on head and 4 dots on last body) | 3 (5%) | 43 (72%) |
| 11. How do fall armyworm feed on leaves? (By scraping and Circular holes) | 52 (87%) | 58 (97%) |
| 12. Insecticide used for managing fall army worm? (Coragen & Delegate) | 7 (12%) | 49 (82%) |
| 13. Concentration of coragen to be used? (0.4 ml per liter) | 3 (5%) | 35 (58%) |
| 14. Concentration of Delegate? (0.5 ml per liter) | 9 (15%) | 33 (55%) |
| 15. Major insect’s pests of maize? (Shoot fly, Armyworm, Fall armyworm, & Silkcutter) | 38 (63%) | 47 (78%) |
| 16. Concentration of Gaucho for seed treatment in managing shootfly? (6 ml per kg) | 2(3%) | 36 (60%) |
| 17. Army worm feeds on which part? (Leaves) | 25 (42%) | 41 (68%) |
| Mean | 6 | 13 |
| Mean% | 38% | 76% |
| %Change | 99% |
Table text extracted from the original PDF; superscript letters are shown inline. The original table image is below.
View original table image
Poultry is maintained by 13.3% of the lot.
Video questionnaire
Within the survey, awareness regarding pest infestation in maize was initiated using videos and associated questionnaires. A carefully curated questionnaire was taken to check the understanding of the farmers. Same set of questions was asked before and after introducing the video to the farmers. Figure 12 depicts the score obtained before and after observing the video. The respondents of village www.extensionjournal.com
Hasanpur had the maximum increase in awareness by 5.60%, followed by Sahauran showing increase of 5.53%. Awareness in village Radiala showed an increase of 4.60%, Allahpur showcased increase by 4.50% whereas, Ghataur was found to be the village that showed minimum increase in awareness by 4.40%. The aforementioned data thus indicates that after watching the video, there was a significant increase in knowledge about various aspects of maize disease and pest; the mean score was 6 prior to watching the video, and 13 subsequent to watching it; the mean percentage was 38% and 76% before and after watching the video. The video changed 99% of the audience.
Figures and tables from the paper
| S. No. | Category | Frequency | Overall % n=60 |
|---|---|---|---|
| 1. | Low (0-83) | 32 | 53% |
| 2. | Medium (84-163) | 24 | 40% |
| 3. | High (164-250) | 4 | 7% |
Table text extracted from the original PDF; superscript letters are shown inline. The original table image is below.
View original table image
References
6 in the original paper- Bagal YS, Singh G, Sharma A. Gain in knowledge level of farmer about recommended agricultural practices after watching video films. Multilogic Sci. 2018;8(1):363-366. [https://www.researchgate.net/publication/342662676]
- Issa FO, Kagbu JH, Abdulkadir SA. Analysis of socioeconomic factors influencing farmers' adoption of improved maize production practices in Ikara Local Government Area of Kaduna State, Nigeria. Afr Journals Online. 2016;16(2):15-24. https://doi.org/10.4314/agrosh.v16i2.3
- Kaur HJ, Gupta S. Socio-Economic Conditions of farmers: A study of rural Punjab. Int J Appl Serv Market Perspect. 2018;7(3):3429-3450. [https://asmp.gfer.org/index.php/asmp/article/view/14]
- Kumar R, Fayaz A, Kaundal M. Vertical Farming: The Future of Controlled-environment Agriculture and Food-production System. Curr J Appl Sci Technol. 2023;42(48):74-86. https://doi.org/10.9734/cjast/2023/v42i484334
- Singh G, Iqbal T, Paswal S, Sharma LK. Identification of different pulse crops grown and inputs used for their cultivation in temperate area of Jammu region. Agric Mech Asia. 2023;54(4):12663-12672.
- Singh G, Sharma A, Bagal YS. Perception of Farmers Regarding Informative Video Films on Dissemination of Selected Farming Practices. Int J Curr Microbiol Appl Sci. 2018;7(6):9-14. [https://www.researchgate.net/publication/325971771]