
Research article · 2024 · Full text
International Journal of Advanced Biochemistry ResearchEffect of phytohormones and plant growth promoting micro-organisms on seedling growth of Karna Khatta (Citrus karna)
Volume 8(4S) · Pages 23–29 · DOI: 10.33545/26174693.2024.v8.i4sa.893 ↗
Research areasPlant Parasitism and ResistancePlant Growth and Agriculture TechniquesPineapple and bromelain studies
Abstract
Author-writtenAn experiment was conducted at Department of Horticulture, SHUATS, Prayagraj, Uttar Pradesh with an objective to evaluate the influence of different concentration of phytohormones on seedling growth of Karna Khatta. The experiment was laid in Randomized Block Design with fourteen treatments replicated thrice. Seeds are treated with phytohormones and plant growth promoting micro - organism over night before sowing in polybags. The various concentration of phytohormones viz. GA3 and NAA, plant growth promoting micro -organisms viz. Aspergillus, Pseudomonas and Photosynthetic Bacteria and there combination were used to treat the seeds and further observation were taken for 120 Days. The maximum results indicated that the shoot length (85.23 cm), seedling girth (15.33 mm), number of leaves (57.66), seedling length (18.70 cm), seedling vigor index (1,663.73), leaf area (38.56 cm2) recorded in seeds which are treated with GA3 80 ppm for 24 hours. Therefore, it is evident that the GA3 at 80 ppm was found best in terms of vegetative growth.
Summary
Source-checkedPlain-language reading of the full paper, prepared with AI and checked against the text. Each point links to the authors' own words.
Why it matters
- Karna Khatta (Citrus karna) is a common rootstock used for mandarin orange cultivation across various regions of India. View evidence ↗
- The propagation of Karna Khatta is hindered by low seed germination rates, which typically range from 27% to 58%. View evidence ↗
- High seedling mortality in the primary nursery stage is a major issue, partly caused by inhibitory substances in the seed coat that block early germination. View evidence ↗
The question
- The study aimed to evaluate how different concentrations of phytohormones affect the seedling growth of Karna Khatta. View evidence ↗
What they did
- The researchers used a Randomized Block Design with 14 treatments, including various concentrations of GA3 and NAA, several plant growth promoting micro-organisms (Aspergillus, Pseudomonas, VAM, Photosynthetic Bacteria), and their combinations. View evidence ↗
- Growth parameters measured after four months included shoot length, seedling length, seedling girth, number of leaves, leaf area index, and seedling vigor index. View evidence ↗
What they found
- The highest number of leaves was observed in seedlings treated with GA3 80 ppm (57.66), compared to the control group (28.33). View evidence ↗
- Seedlings treated with GA3 80 ppm achieved the maximum shoot length of 85.23 cm, significantly higher than the control's 30.30 cm. View evidence ↗
- The maximum seedling length was 18.70 cm for the GA3 80 ppm treatment, while the control group measured 14.46 cm. View evidence ↗
- Seedling girth was highest in the GA3 80 ppm group (15.33 mm) and lowest in the control group (10.36 mm). View evidence ↗
- The GA3 80 ppm treatment resulted in the highest seedling vigor index (1,663.73), nearly double that of the control (863.267). View evidence ↗
- Leaf area was maximized at 38.56 cm² with GA3 80 ppm treatment, compared to 19.06 cm² in the control. View evidence ↗
What it means
- The authors conclude that GA3 at 80 ppm is the most effective treatment for improving all measured growth parameters of Karna Khatta seedlings. View evidence ↗
- The authors recommend that nursery growers use growth regulators to break seed dormancy and ensure higher quality seedling production. View evidence ↗
Visual summary
3 visualsIllustrations explain the paper; charts are replotted from the paper's own table values.
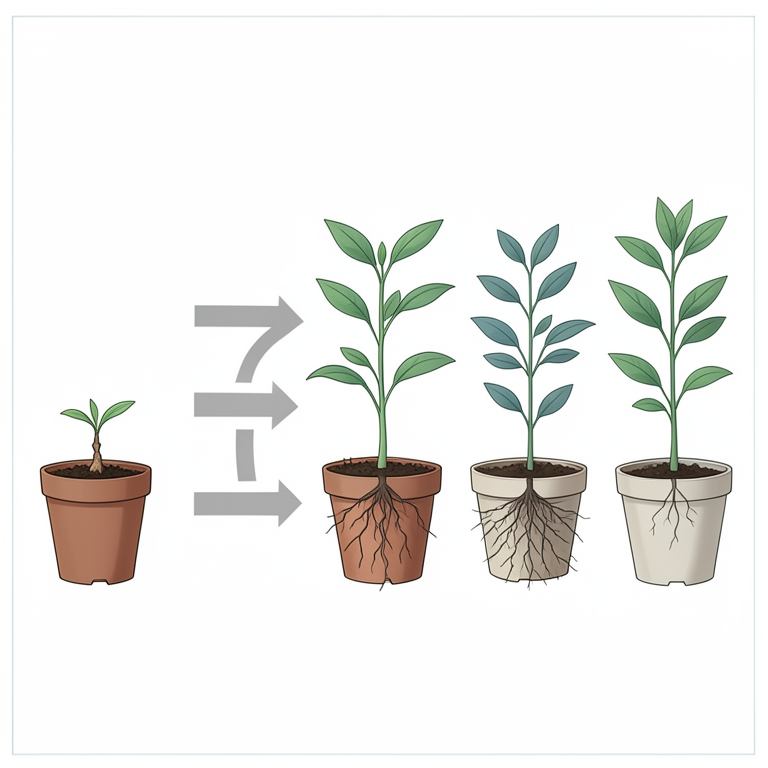
Experimental Treatment Groups
AI-generated conceptual illustration (Karna Khatta (Citrus karna) seedlings). It explains the idea and does not show study data.
View source evidence ↗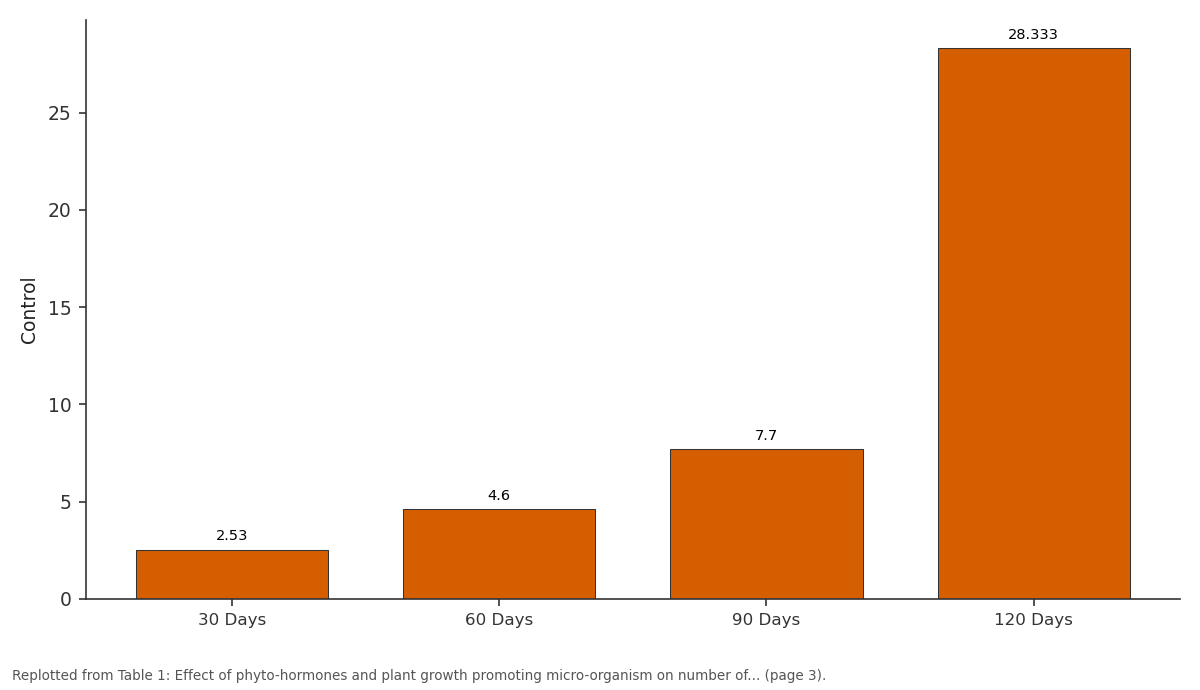
Control: 30 Days vs 60 Days vs 90 Days vs 120 Days
Replotted from Table 1 (page 3) of the original paper. Every bar is the paper's own table value.
View source evidence ↗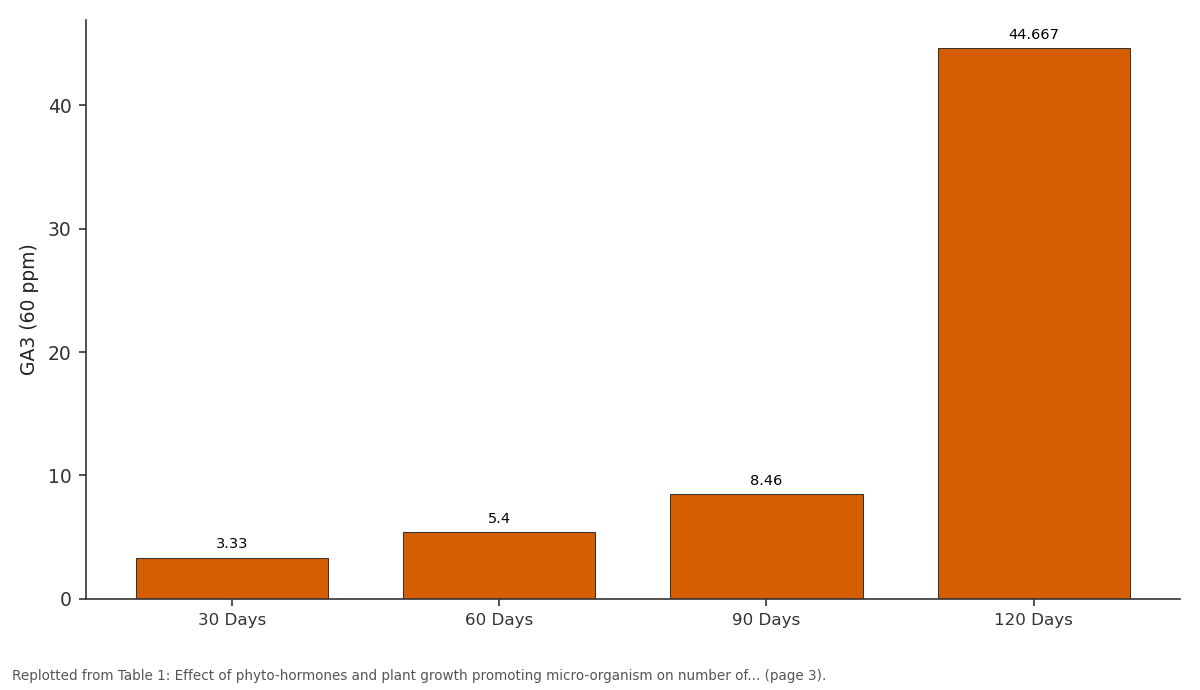
GA3 (60 ppm): 30 Days vs 60 Days vs 90 Days vs 120 Days
Replotted from Table 1 (page 3) of the original paper. Every bar is the paper's own table value.
View source evidence ↗Figures & tables
From the original paper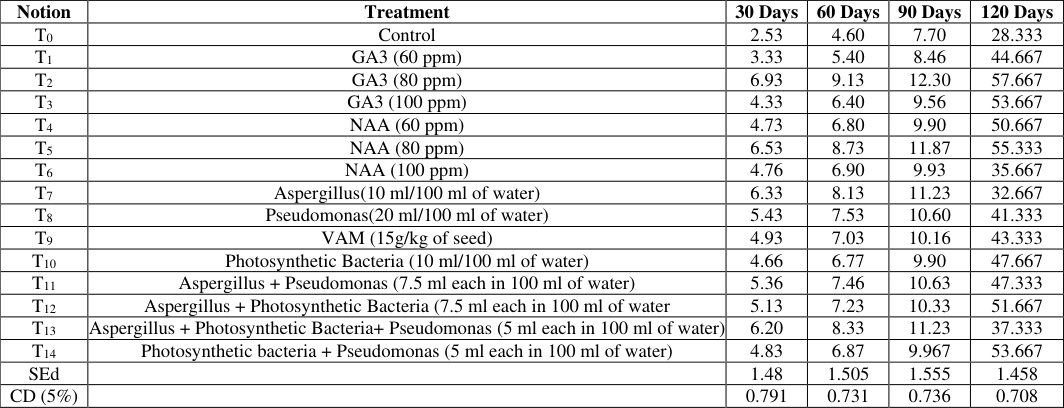 Table 1
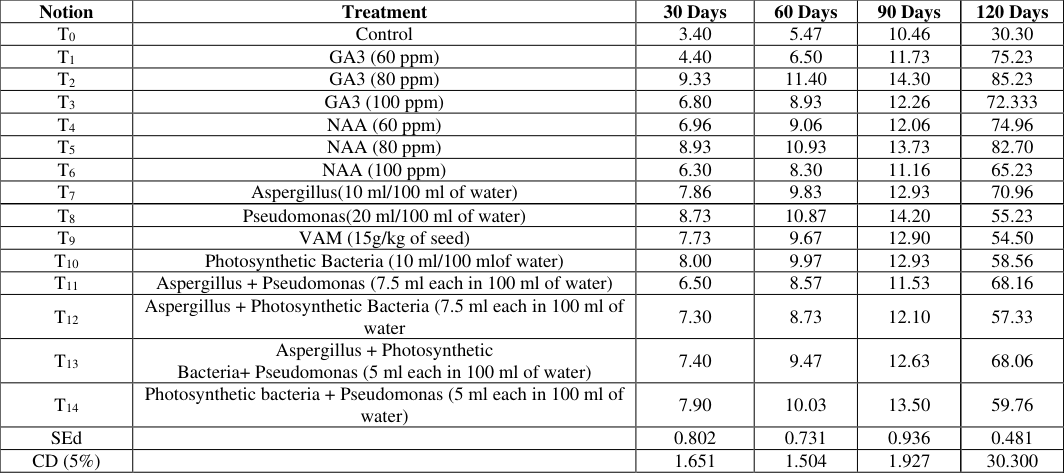 Table 2
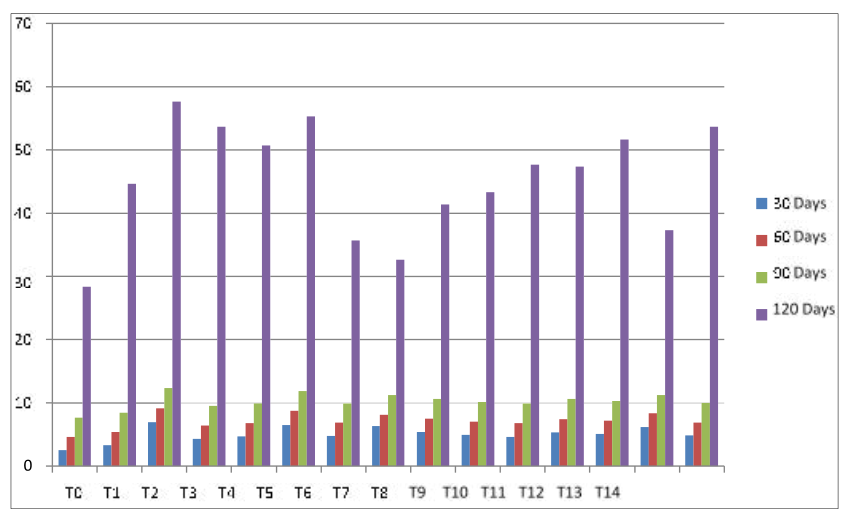 Figure 1
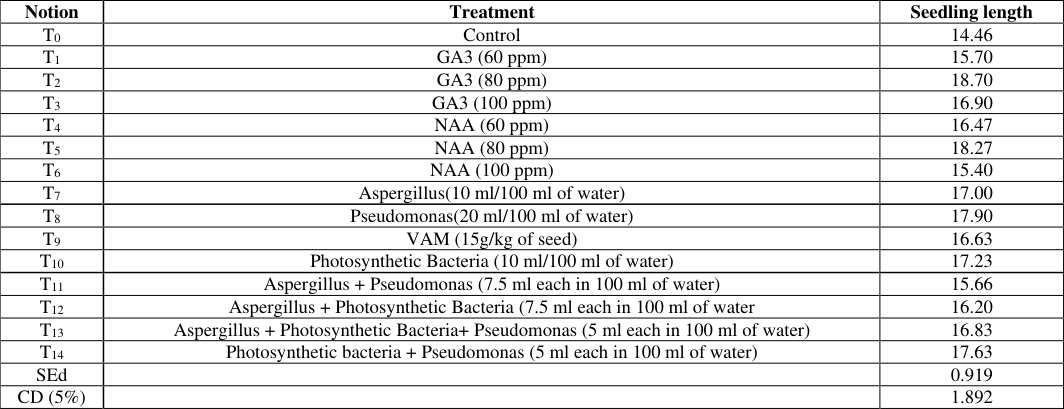 Table 3
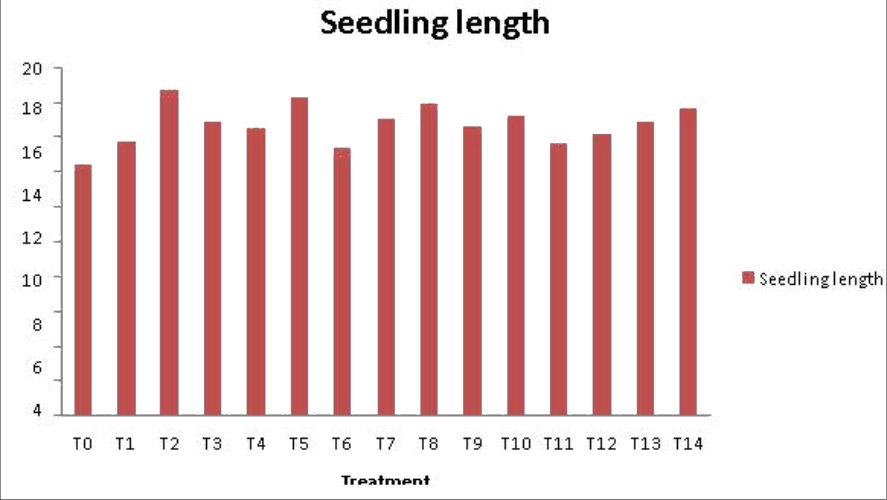 Figure 3
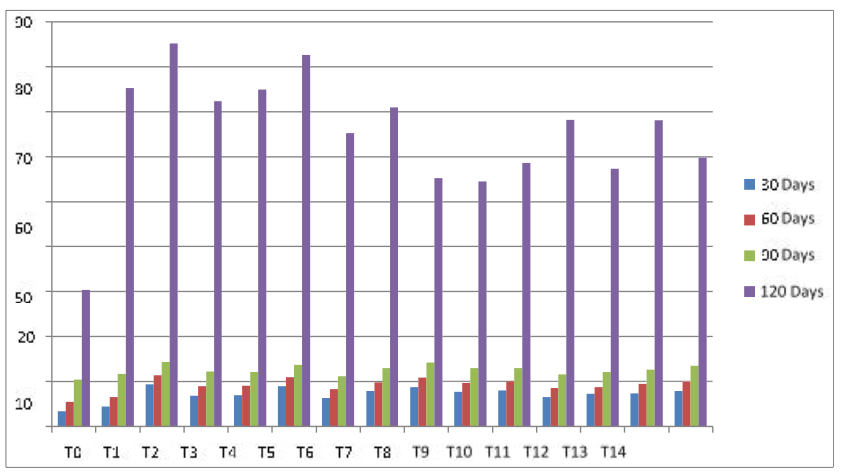 Figure 2
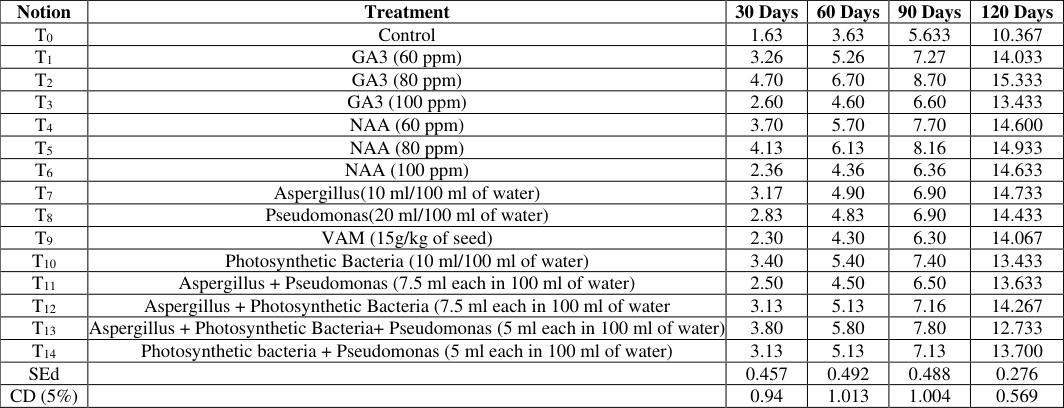 Table 4
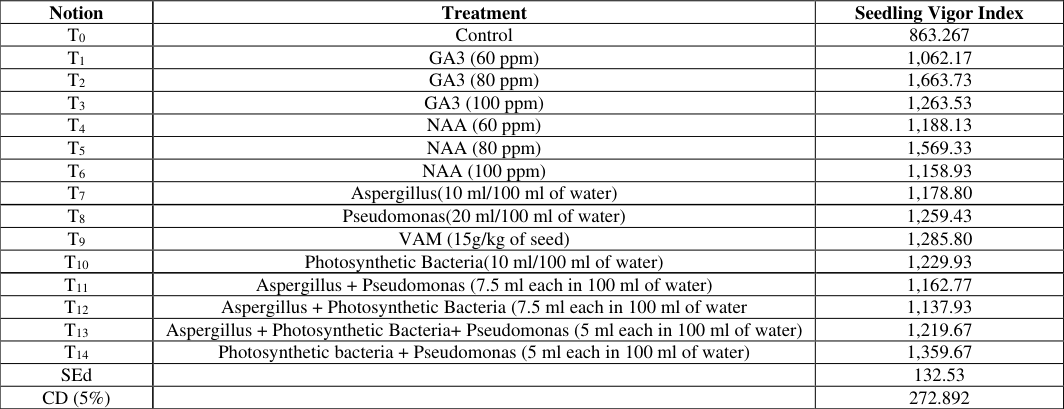 Table 5
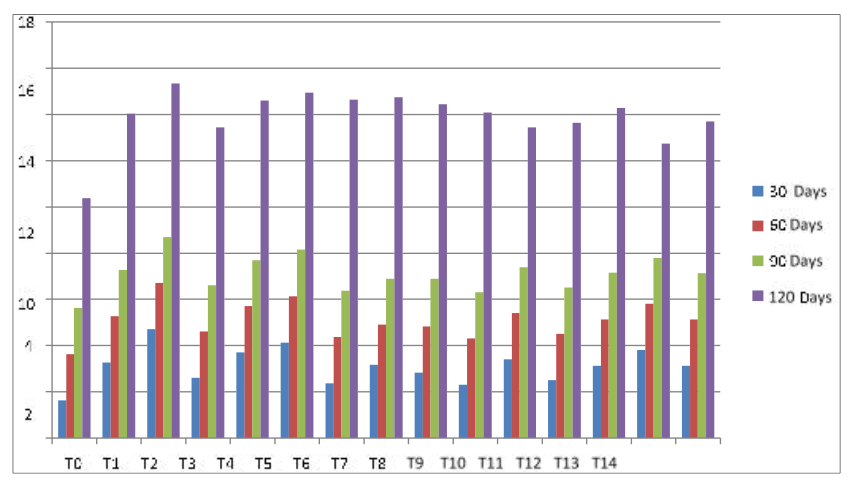 Figure 4
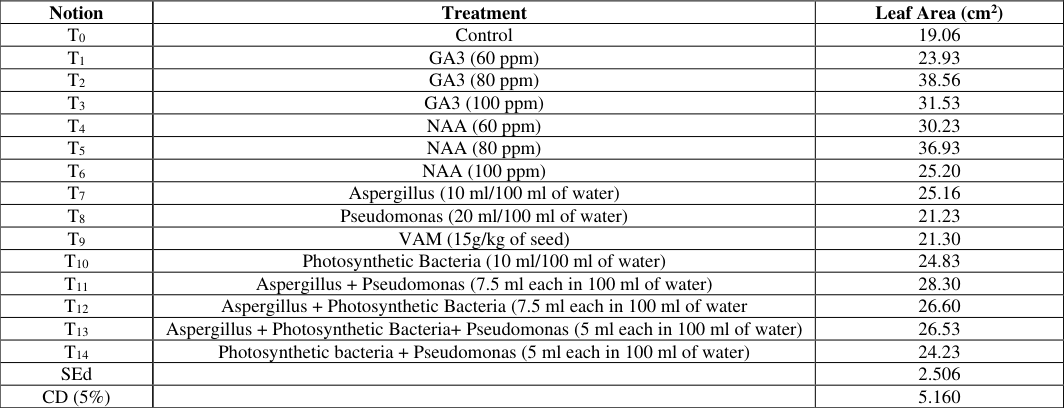 Table 6
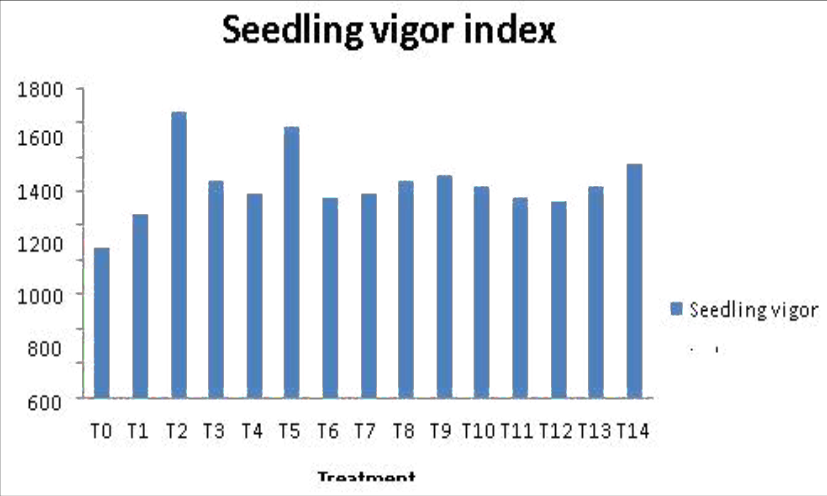 Figure 5
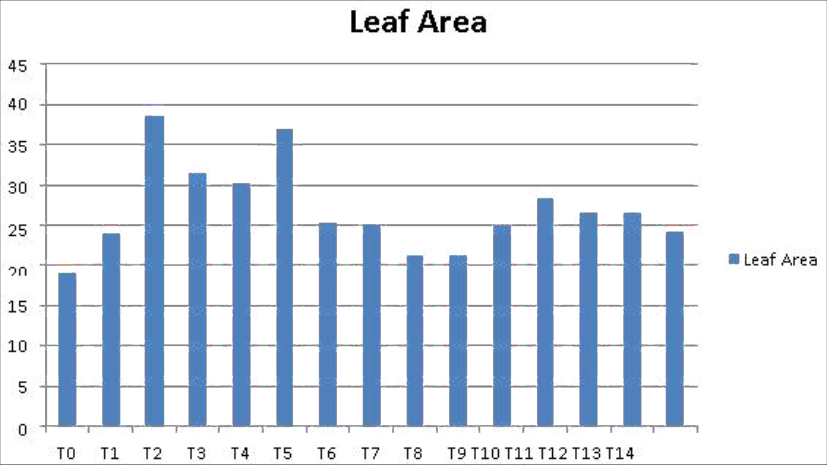 Figure 6
Introduction
Among citrus rootstocks, Karna Khatta (Citrus karna) is widely used as rootstock for mandarin orange in many parts of India. Karna Khatta is grown in home as well as gardens. It was first introduced by Late B.C. Basu, formerly Deputy Director of Agriculture and Land Records of the East Bengal and Assam, sometimes in the year 1904 -1906 when he started a tropical fruit plantation in the Wahjain near Cherrapunji (Khasi Hills). The karna is probably indigenous to India. Citrus is one among the most utilized fruits cultivating in tropical and sub-tropical regions. Citrus can be used for fresh as well as canned juice preparation. The Karna (Citrus karna Rafinesque) is commercially propagated through seeds in India as it comes true to type, because of high degree (39-60%) of nucellar embryonic. In seed propagated plants better and quicker germination of seeds and production of the maximum number of the seedling is highly essential to meet the increasing demand of the cultivators in shortest possible time. But in Karna khatta germination percentage is low and it varies between 27 to 58%. The most serious problem in Karna khatta propagation is heavy mortality with the seedlings in primary nursery stage. The seed coat of citrus acts as a barrier because it interferes with early germination of seed due to the presence of certain inhibitory substance. The growth regulators like GA 3 and NAA have been widely used for pre-sowing seed treatment to increase germination and to accelerate vegetative seedling growth in the genus citrus. Application of bio-fertilizers will help in safeguarding the soil health and also the quality of crop products. Bio-fertilizers are the natural fertilizers that are microbial inoculants of bacteria, algae or fungi alone or in combination. Recently, growth regulators and plant growth promoting micro -organisms have gained much attention for their role in growth and development of plants as well as seed germination. Plant hormones have most important functions in controlling and coordinating cell division, growth and differentiation. Application of different plant growth regulators and plant growth promoting micro -organisms has shown significant effect on seed germination and seedling growth in various researches. Based on these facts, the present investigation was undertaken to improve better seedling growth and quality seedling of Karna Khatta through certain presowing seed treatments.
Materials and Methods
The present investigation entitled Effect of Phytohormones and Plant growth promoting micro-organisms on seedling growth of Karna Khatta (Citrus karna) was conducted at Department of Horticulture, Sam Higginbottom University of Agriculture, Technology and Sciences, Prayagraj, Uttar Pradesh. The experiment was carried out following Randomized Block Design with fourteen treatments viz. T 0 -Control, T 1 -GA 3 60 ppm, T 2 -GA 3 80 ppm, T 3 -GA 3 100 ppm, T 4 -NAA 60 ppm, T 5 -NAA 80 ppm, T 6 -100 ppm, T 7 -Aspergillus (10 ml/ 100 ml of water), T 8 -Pseudomonas (20 ml /100 ml of water), T 9 -VAM (15 g / kg of seed), T 10 -Photosynthetic Bacteria (10 ml/ 100 ml of water), T 11 -Aspergillus + Pseudomonas (7.5 ml each in 100 ml of water) and T 12 -Aspergillus + Photosynthetic Bacteria (7.5 ml each in 100 ml of water), T 13 -Aspergillus + Photosynthetic Bacteria + Pseudomonas (5ml each in 100 ml of water), T 14 -Photosynthetic bacteria + Pseudomonas (5ml each in 100 ml of water). The treatments replicated trice using 30 seeds in each treatment of a replication. The seeds were soaked for 24 hours and sown in polythene bags. The seedlings were allowed to grow for four month. After four months, five representative seedlings from each replication of a treatment were selected for measuring growth parameters; Number of leaves, Shoot Length, Seedling Length (cm), girth of seedling (mm), seedling vigour index, and Leaf Area Index (cm 2 ).
Result and Discussion
Result and Discussion
Number of Leaves
It is evident that the number of leaves was influenced by different treatments at all successive stage of growth. There was significant difference between the treatments at 30, 60, and 90 days among the treatment applied T 2 (GA 3 80 ppm), with (6.93, 9.13,12.30 and 57.66) increase significantly better number of leaves followed by T 5 (NAA 80 ppm) with (6.53, 8.73 11.87 and 55.33) which was significantly superior over T 0 (control) with number of leaves (2.53, 4.60, 7.70 and 28.33).The maximum number of leaves was recorded in T 2 (GA 3 80 ppm) with (57.66) followed by T 5 (NAA 80 ppm) with (55.33) and the minimum was recorded in T 0 control with (28.33).The data is presented in Table 1 and graphically presented in Fig 1.
| Notion | Treatment | 30 Days | 60 Days | 90 Days | 120 Days |
|---|---|---|---|---|---|
| T0 | Control | 2.53 | 4.60 | 7.70 | 28.333 |
| T1 | GA3 (60 ppm) | 3.33 | 5.40 | 8.46 | 44.667 |
| T2 | GA3 (80 ppm) | 6.93 | 9.13 | 12.30 | 57.667 |
| T3 | GA3 (100 ppm) | 4.33 | 6.40 | 9.56 | 53.667 |
| T4 | NAA (60 ppm) | 4.73 | 6.80 | 9.90 | 50.667 |
| T5 | NAA (80 ppm) | 6.53 | 8.73 | 11.87 | 55.333 |
| T6 | NAA (100 ppm) | 4.76 | 6.90 | 9.93 | 35.667 |
| T7 | Aspergillus(10 ml/100 ml of water) | 6.33 | 8.13 | 11.23 | 32.667 |
| T8 | Pseudomonas(20 ml/100 ml of water) | 5.43 | 7.53 | 10.60 | 41.333 |
| T9 | VAM (15g/kg of seed) | 4.93 | 7.03 | 10.16 | 43.333 |
| T10 | Photosynthetic Bacteria (10 ml/100 ml of water) | 4.66 | 6.77 | 9.90 | 47.667 |
| T11 | Aspergillus + Pseudomonas (7.5 ml each in 100 ml of water) | 5.36 | 7.46 | 10.63 | 47.333 |
| T12 | Aspergillus + Photosynthetic Bacteria (7.5 ml each in 100 ml of water | 5.13 | 7.23 | 10.33 | 51.667 |
| T13 | Aspergillus + Photosynthetic Bacteria+ Pseudomonas (5 ml each in 100 ml of water) | 6.20 | 8.33 | 11.23 | 37.333 |
| T14 | Photosynthetic bacteria + Pseudomonas (5 ml each in 100 ml of water) | 4.83 | 6.87 | 9.967 | 53.667 |
| SEd | 1.48 | 1.505 | 1.555 | 1.458 | |
| CD (5%) | 0.791 | 0.731 | 0.736 | 0.708 |
Table text extracted from the original PDF; superscript letters are shown inline. The original table image is below.
View original table image
Shoot length
It is evident that the shoot length was influenced by different treatments at all successive stage of growth. There was significant difference between the treatments at 30, 60,90 and 120 days among the treatment applied T 2 (GA 3 80 ppm), with (9.33, 11.40,14.30,85.23 cm) increase significantly better shoot length followed by T 5 (NAA 80 ppm) with 8.93, 10.93, 13.73,82.70 cm) which was significantly superior over T 0 (control) with shoot length 3.40, 5.47, 10.46,30.30 cm).The maximum shoot length was recorded in T 2 (GA 3 80 ppm) with (85.23 cm) followed by T 5 (NAA 80 ppm) with (82.70 cm) and the minimum was recorded in T 0 control with (30.30 cm). The data is presented in Table 2 and graphically presented in Fig 2.
| Notion | Treatment | 30 Days | 60 Days | 90 Days | 120 Days |
|---|---|---|---|---|---|
| T0 | Control | 3.40 | 5.47 | 10.46 | 30.30 |
| T1 | GA3 (60 ppm) | 4.40 | 6.50 | 11.73 | 75.23 |
| T2 | GA3 (80 ppm) | 9.33 | 11.40 | 14.30 | 85.23 |
| T3 | GA3 (100 ppm) | 6.80 | 8.93 | 12.26 | 72.333 |
| T4 | NAA (60 ppm) | 6.96 | 9.06 | 12.06 | 74.96 |
| T5 | NAA (80 ppm) | 8.93 | 10.93 | 13.73 | 82.70 |
| T6 | NAA (100 ppm) | 6.30 | 8.30 | 11.16 | 65.23 |
| T7 | Aspergillus(10 ml/100 ml of water) | 7.86 | 9.83 | 12.93 | 70.96 |
| T8 | Pseudomonas(20 ml/100 ml of water) | 8.73 | 10.87 | 14.20 | 55.23 |
| T9 | VAM (15g/kg of seed) | 7.73 | 9.67 | 12.90 | 54.50 |
| T10 | Photosynthetic Bacteria (10 ml/100 mlof water) | 8.00 | 9.97 | 12.93 | 58.56 |
| T11 | Aspergillus + Pseudomonas (7.5 ml each in 100 ml of water) | 6.50 | 8.57 | 11.53 | 68.16 |
| T12 | Aspergillus + Photosynthetic Bacteria (7.5 ml each in 100 ml of water | 7.30 | 8.73 | 12.10 | 57.33 |
| T13 | Aspergillus + Photosynthetic Bacteria+ Pseudomonas (5 ml each in 100 ml of water) | 7.40 | 9.47 | 12.63 | 68.06 |
| T14 | Photosynthetic bacteria + Pseudomonas (5 ml each in 100 ml of water) | 7.90 | 10.03 | 13.50 | 59.76 |
| SEd | 0.802 | 0.731 | 0.936 | 0.481 | |
| CD (5%) | 1.651 | 1.504 | 1.927 | 30.300 |
Table text extracted from the original PDF; superscript letters are shown inline. The original table image is below.
View original table image
Seedling length
It is evident that the seedling length was influenced by different treatments at all successive stage of growth. There was significant difference between the treatments, among the treatment applied T 2 (GA 3 80 ppm), with (18.70 cm) increase significantly better seedling length followed by T 5 (NAA 80 ppm) with (18.27 cm) which was significantly superior over T 0 (control) with seedling length (14.46 cm).The maximum seedling length was recorded in T 2 (GA 3 80 ppm) with (18.70 cm) followed by T 5 (NAA 80 ppm) with (18.27 cm) and the minimum was recorded in T 0 control with (14.46 cm). The data is presented in Table 3 and graphically presented in Fig 3.
| Notion | Treatment | Seedling length |
|---|---|---|
| T0 | Control | 14.46 |
| T1 | GA3 (60 ppm) | 15.70 |
| T2 | GA3 (80 ppm) | 18.70 |
| T3 | GA3 (100 ppm) | 16.90 |
| T4 | NAA (60 ppm) | 16.47 |
| T5 | NAA (80 ppm) | 18.27 |
| T6 | NAA (100 ppm) | 15.40 |
| T7 | Aspergillus(10 ml/100 ml of water) | 17.00 |
| T8 | Pseudomonas(20 ml/100 ml of water) | 17.90 |
| T9 | VAM (15g/kg of seed) | 16.63 |
| T10 | Photosynthetic Bacteria (10 ml/100 ml of water) | 17.23 |
| T11 | Aspergillus + Pseudomonas (7.5 ml each in 100 ml of water) | 15.66 |
| T12 | Aspergillus + Photosynthetic Bacteria (7.5 ml each in 100 ml of water | 16.20 |
| T13 | Aspergillus + Photosynthetic Bacteria+ Pseudomonas (5 ml each in 100 ml of water) | 16.83 |
| T14 | Photosynthetic bacteria + Pseudomonas (5 ml each in 100 ml of water) | 17.63 |
| SEd | 0.919 | |
| CD (5%) | 1.892 |
Table text extracted from the original PDF; superscript letters are shown inline. The original table image is below.
View original table image
Seedling girth
It is evident that the seedling girth was influenced by different treatments at all successive stage of growth. There was significant difference between the treatments at 30, 60,90 and 120 days among the treatment applied T 2 (GA 3 80 ppm), with (4.70, 6.70,8.70 and 15.33 mm) increase significantly better seedling girth followed by T 5 (NAA 80 ppm) with 4.13, 6.13, 8.16 and 14.93 mm) which was significantly superior over T0 (control) with seedling girth 1.63, 3.63 5.63 and 10.36 mm).The maximum seedling girth was recorded in T 2 (GA 3 80 ppm) with (15.33 mm) followed by T 5 (NAA 80 ppm) with (14.93 mm) and the minimum was recorded in T 0 control with (10.36 mm). The data is presented in Table 4 and graphically presented in Fig 4.
| Notion | Treatment | 30 Days | 60 Days | 90 Days | 120 Days |
|---|---|---|---|---|---|
| T0 | Control | 1.63 | 3.63 | 5.633 | 10.367 |
| T1 | GA3 (60 ppm) | 3.26 | 5.26 | 7.27 | 14.033 |
| T2 | GA3 (80 ppm) | 4.70 | 6.70 | 8.70 | 15.333 |
| T3 | GA3 (100 ppm) | 2.60 | 4.60 | 6.60 | 13.433 |
| T4 | NAA (60 ppm) | 3.70 | 5.70 | 7.70 | 14.600 |
| T5 | NAA (80 ppm) | 4.13 | 6.13 | 8.16 | 14.933 |
| T6 | NAA (100 ppm) | 2.36 | 4.36 | 6.36 | 14.633 |
| T7 | Aspergillus(10 ml/100 ml of water) | 3.17 | 4.90 | 6.90 | 14.733 |
| T8 | Pseudomonas(20 ml/100 ml of water) | 2.83 | 4.83 | 6.90 | 14.433 |
| T9 | VAM (15g/kg of seed) | 2.30 | 4.30 | 6.30 | 14.067 |
| T10 | Photosynthetic Bacteria (10 ml/100 ml of water) | 3.40 | 5.40 | 7.40 | 13.433 |
| T11 | Aspergillus + Pseudomonas (7.5 ml each in 100 ml of water) | 2.50 | 4.50 | 6.50 | 13.633 |
| T12 | Aspergillus + Photosynthetic Bacteria (7.5 ml each in 100 ml of water | 3.13 | 5.13 | 7.16 | 14.267 |
| T13 | Aspergillus + Photosynthetic Bacteria+ Pseudomonas (5 ml each in 100 ml of water) | 3.80 | 5.80 | 7.80 | 12.733 |
| T14 | Photosynthetic bacteria + Pseudomonas (5 ml each in 100 ml of water) | 3.13 | 5.13 | 7.13 | 13.700 |
| SEd | 0.457 | 0.492 | 0.488 | 0.276 | |
| CD (5%) | 0.94 | 1.013 | 1.004 | 0.569 |
Table text extracted from the original PDF; superscript letters are shown inline. The original table image is below.
View original table image
Seedling vigor index
The effect of phyto-hormone and plant growth promoting micro-organism on Seedling Vigor Index of Karna Khatta is very obvious and consistent. There was significant difference among the different treatments applied, among the treatment applied the maximum Seedling Vigor Index was recorded in T 2 (GA 3 (80 ppm) with 1,663.73 Seedling Vigor Index followed by T 5 (NAA (80 ppm)) with 1,569.33 of Seedling Vigor Index and the minimum Seedling Vigor Index was recorded in T 0 (Control) with 863.267 Seedling Vigor Index. The maximum Seedling Vigor Index was recorded in T 2 (GA 3 (80 ppm) with 1,663.73 Seedling Vigor Index followed by T 5 (NAA (80 ppm)) with 1,569.33 of Seedling Vigor Index and the minimum Seedling Vigor Index was recorded in T0 (Control) with 863.267 Seedling Vigor Index. The data is presented in Table 5 and graphically presented in Fig 5.
| Notion | Treatment | Seedling Vigor Index |
|---|---|---|
| T0 | Control | 863.267 |
| T1 | GA3 (60 ppm) | 1,062.17 |
| T2 | GA3 (80 ppm) | 1,663.73 |
| T3 | GA3 (100 ppm) | 1,263.53 |
| T4 | NAA (60 ppm) | 1,188.13 |
| T5 | NAA (80 ppm) | 1,569.33 |
| T6 | NAA (100 ppm) | 1,158.93 |
| T7 | Aspergillus(10 ml/100 ml of water) | 1,178.80 |
| T8 | Pseudomonas(20 ml/100 ml of water) | 1,259.43 |
| T9 | VAM (15g/kg of seed) | 1,285.80 |
| T10 | Photosynthetic Bacteria(10 ml/100 ml of water) | 1,229.93 |
| T11 | Aspergillus + Pseudomonas (7.5 ml each in 100 ml of water) | 1,162.77 |
| T12 | Aspergillus + Photosynthetic Bacteria (7.5 ml each in 100 ml of water | 1,137.93 |
| T13 | Aspergillus + Photosynthetic Bacteria+ Pseudomonas (5 ml each in 100 ml of water) | 1,219.67 |
| T14 | Photosynthetic bacteria + Pseudomonas (5 ml each in 100 ml of water) | 1,359.67 |
| SEd | 132.53 | |
| CD (5%) | 272.892 |
Table text extracted from the original PDF; superscript letters are shown inline. The original table image is below.
View original table image
Leaf area
It is evident that the leaf area was influenced by different treatments at all successive stage of growth. There was significant difference between the treatments, among the treatment applied T 2 (GA 3 80 ppm), with (38.56 cm 2 ) had significantly more leaf area followed by T 5 (NAA 80 ppm) with (36.93 cm 2 ) which was significantly superior over T 0 (control) with leaf area (19.06 cm2).The maximum leaf area was recorded in T 2 (GA 3 80 ppm) with (38.56 cm 2 ) followed by T 5 (NAA 80 ppm) with (36.93 cm 2 ) and the minimum was recorded in T 0 control with (19.06 cm 2 ). The data is presented in Table 6 and graphically presented in Fig 6.
| Notion | Treatment | Leaf Area (cm2) |
|---|---|---|
| T0 | Control | 19.06 |
| T1 | GA3 (60 ppm) | 23.93 |
| T2 | GA3 (80 ppm) | 38.56 |
| T3 | GA3 (100 ppm) | 31.53 |
| T4 | NAA (60 ppm) | 30.23 |
| T5 | NAA (80 ppm) | 36.93 |
| T6 | NAA (100 ppm) | 25.20 |
| T7 | Aspergillus (10 ml/100 ml of water) | 25.16 |
| T8 | Pseudomonas (20 ml/100 ml of water) | 21.23 |
| T9 | VAM (15g/kg of seed) | 21.30 |
| T10 | Photosynthetic Bacteria (10 ml/100 ml of water) | 24.83 |
| T11 | Aspergillus + Pseudomonas (7.5 ml each in 100 ml of water) | 28.30 |
| T12 | Aspergillus + Photosynthetic Bacteria (7.5 ml each in 100 ml of water | 26.60 |
| T13 | Aspergillus + Photosynthetic Bacteria+ Pseudomonas (5 ml each in 100 ml of water) | 26.53 |
| T14 | Photosynthetic bacteria + Pseudomonas (5 ml each in 100 ml of water) | 24.23 |
| SEd | 2.506 | |
| CD (5%) | 5.160 |
Table text extracted from the original PDF; superscript letters are shown inline. The original table image is below.
View original table image
Conclusion
On the basis of results obtained, It is concluded that the treatment T 2 (GA 3 80 ppm) found to be best in terms of shoot length, seedling length, number of leaves, girth of seedling, Leaf Area and seedling vigor index. Application of plant growth regulators in seedling germination of Karna Khatta proved to be powerful tools to modify several physiological processes in plants which are extensively and profitably used in fruit crops. Treatment of seeds with growth regulators and certain chemicals has been found to break dormancy and hence can be recommended to nursery growers for quality production.
References
9 in the original paper- Das RC, Pattanaik A. Studies on the effects of growth regulators treated okra seeds with respect to growth and subsequent development. Indian J Hort. 2013;28:293294.
- Dhaka SS, Pal SL. A study on lime (Citrus aurantifolia Swingle) seed germination as affected by gibberellic acid. Ann Hort. 2009;2(2):228-229.
- Gupta OP. Effect of gibberellic acid on seed germination in lime (Citrus aurantifolia Swingle). Prog Hort. 2000;21(3-4):246-248.
- Gharge VR, Kadam AS, Patil VK, Lakade SK, Dhomane PA. Effect of various concentrations of GA3 and soaking period on seed germination of custard apple (Annona squamosa). Green Farming. 2011;2(5):550-551.
- Hoda, et al. Impact of Gibberellic Acid Enhancing Treatments on Shortening Time to Budding of Citrus Nursery Stocks. J Am Sci. 2010;6(12):410-422.
- Kalyani, et al. Effect of growth regulators on seed germination in guava. Int J Biol Sci. 2014;5(2):81-89.
- Khan, Usman. Role of gibberellic acid (GA3) on citrus seed germination and study of some morphological characteristics. Pak J Agric Res. 2002;39(2).
- Kahlon PS, Danesh Chander. A study on the seed germination and subsequent seedling growth in peach cv. Sharbati. Res Dev Rep. 2014;4(1):81-84.
- Mostafa MM. Effect of bio-fertilizer and magnetic technique on the growth of some annual plants. Alex J Agric. 2002;47(2):151-162.