
Research article · 2024 · Full text
International Journal of Advanced Biochemistry ResearchInheritance and linkage study in soybean (Glycine max L. Merill)
Volume 8(3) · Pages 962–967 · DOI: 10.33545/26174693.2024.v8.i3k.884 ↗
Research areasSoybean genetics and cultivationLegume Nitrogen Fixing SymbiosisPlant Genetic and Mutation Studies
Abstract
Author-writtenThe primary goal of the present study was to investigate the inheritance patterns of qualitative traits such as flower color, leaf shape, pod pubescence color and seed hilum color in soybean. The study was carried out over two kharif seasons, 2021 and 2022, at the Research Cum Instructional farm in IGKV Raipur, India. Five parental lines((JS 97-52, JS 95-60, RVS 2012-11, RVSM 2011-35, and NRC 136) were crossed to produce F1 progeny (JS 97-52 × JS 95-60, JS 97-52 × RVS 2012-11, JS 97-52 × RVSM 2011-35 and NRC 136 × RVSM 2011-35), which were then observed for their dominant traits. In the F2 population, every individual plant was analyzed for the segregation of contrasting traits. The chi-square test was used to evaluate the observed and expected values of trait segregation. One primary gene was found to control the color of pod pubescence, leaf shape and flower color. The seed hilum color trait was found to be digenic in two crosses and monogenic in two other crosses. The test of independence showed that the characteristics flower color and pod pubescence color in the cross between JS 97-52 and RVS 2012-11 were linked and not independent.
Summary
Source-checkedPlain-language reading of the full paper, prepared with AI and checked against the text. Each point links to the authors' own words.
Why it matters
- Soybean is a globally important leguminous crop used for human nutrition and animal feed due to its high oil, protein, and phytochemical content. View evidence ↗
- Breeders use qualitative markers like flower color and leaf shape to identify homozygosity or heterozygosity, which helps in improving soybean populations. View evidence ↗
- Understanding the genes and inheritance patterns of qualitative traits is essential for advancing soybean genetics and supporting future research. View evidence ↗
The question
- The study aimed to investigate how qualitative traits, specifically flower color, leaf shape, pod pubescence color, and seed hilum color, are inherited in soybean. View evidence ↗
What they did
- The research was conducted at the IGKV Research Cum Instructional farm in Raipur, India, during the 2021 and 2022 kharif seasons. View evidence ↗
- Four specific crosses were created using five parental lines: JS 97-52, JS 95-60, RVS 2012-11, RVSM 2011-35, and NRC 136. View evidence ↗
- A chi-square test was used to determine if the observed trait segregation in the F2 population matched the expected theoretical ratios. View evidence ↗
- The test of independence was applied to F2 populations to detect genetic linkage between traits that segregated simultaneously. View evidence ↗
What they found
- Flower color followed a 3:1 ratio (purple to white), indicating that it is controlled by a single gene (monogenic) with purple being dominant. View evidence ↗
- Pod pubescence followed a 3:1 ratio of pubescent to glabrous, indicating monogenic inheritance with pubescence as the dominant trait. View evidence ↗
- Pod pubescence color segregated in a 3:1 ratio of tawny to grey, indicating monogenic inheritance with tawny being dominant. View evidence ↗
- In two of the crosses, seed hilum color showed a 9:3:4 ratio (black:brown:grey), indicating digenic inheritance with supplementary gene action. View evidence ↗
- In the other two crosses, seed hilum color followed a 3:1 ratio, indicating monogenic inheritance where black or brown was dominant over yellow. View evidence ↗
- Genetic linkage was detected only between flower color and pod pubescence color in the JS 97-52 × RVS 2012-11 cross; other trait pairs were independent. View evidence ↗
What it means
- The authors conclude that their findings on Mendelian inheritance of qualitative traits are valuable for soybean crop development programs. View evidence ↗
Visual summary
2 visualsIllustrations explain the paper; charts are replotted from the paper's own table values.
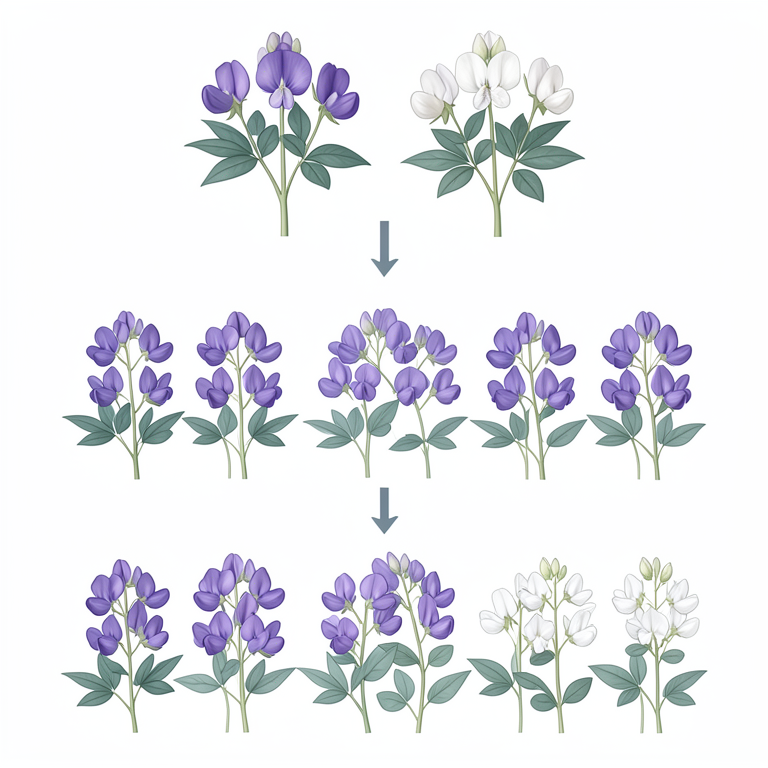
Mendelian Inheritance of Soybean Traits
AI-generated conceptual illustration (soybean plants (Glycine max)). It explains the idea and does not show study data.
View source evidence ↗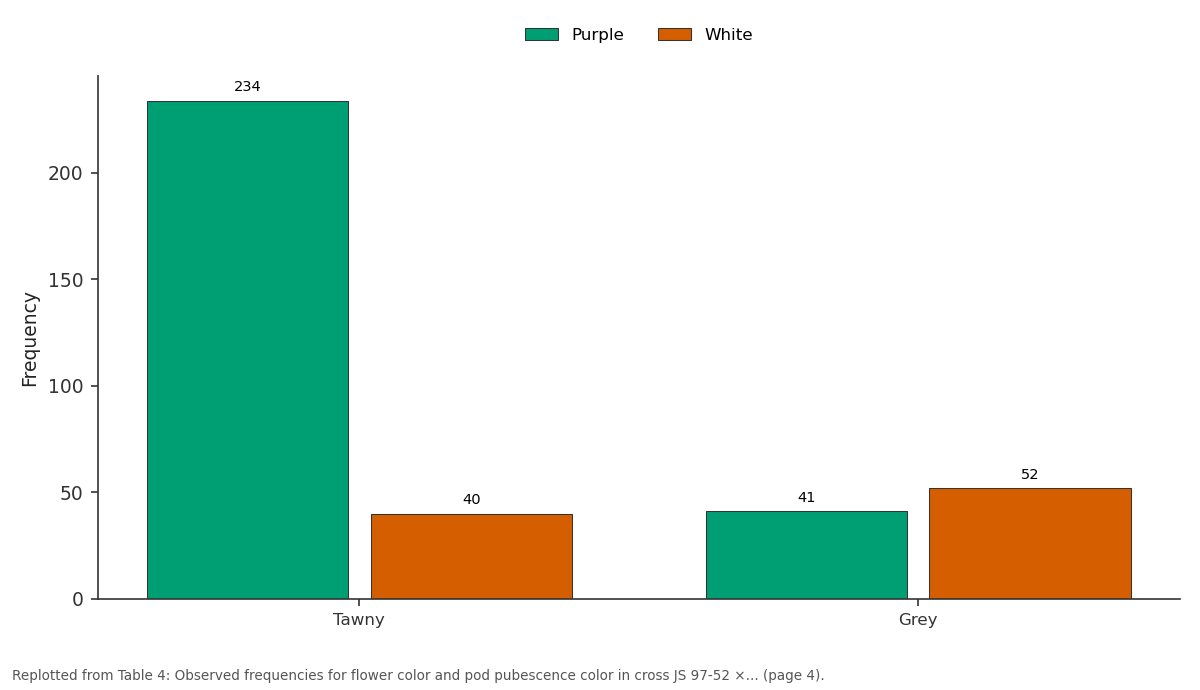
Purple and White: Tawny vs Grey
Replotted from Table 4 (page 4) of the original paper. Every bar is the paper's own table value.
View source evidence ↗Figures & tables
From the original paper Table 1
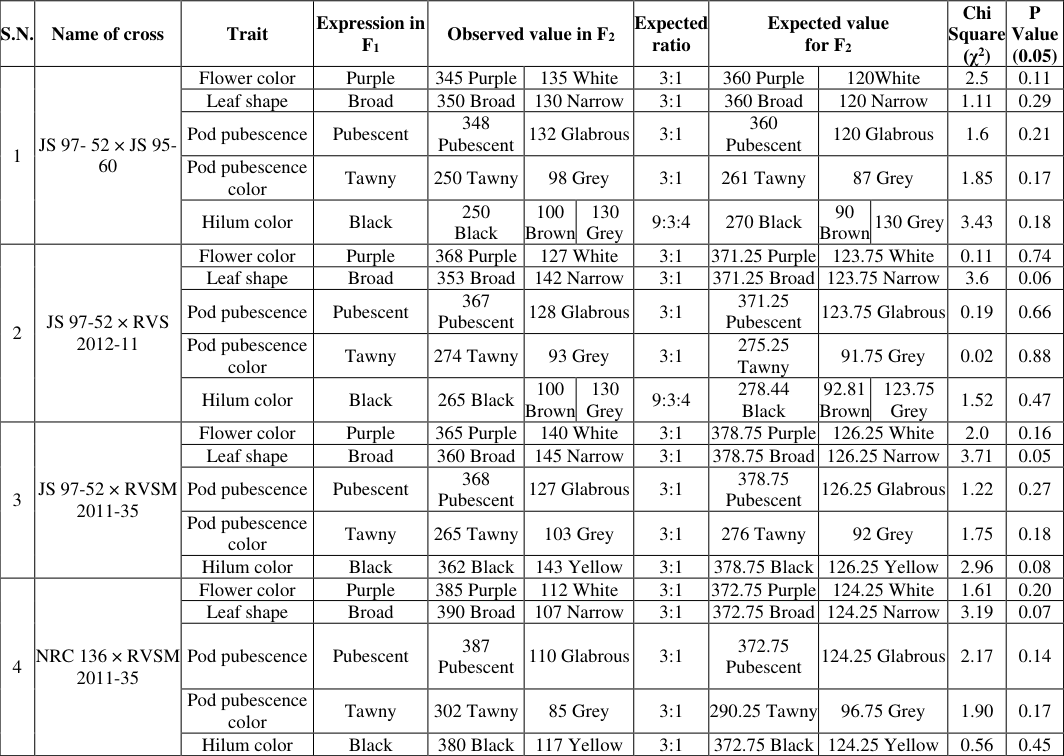 Table 2
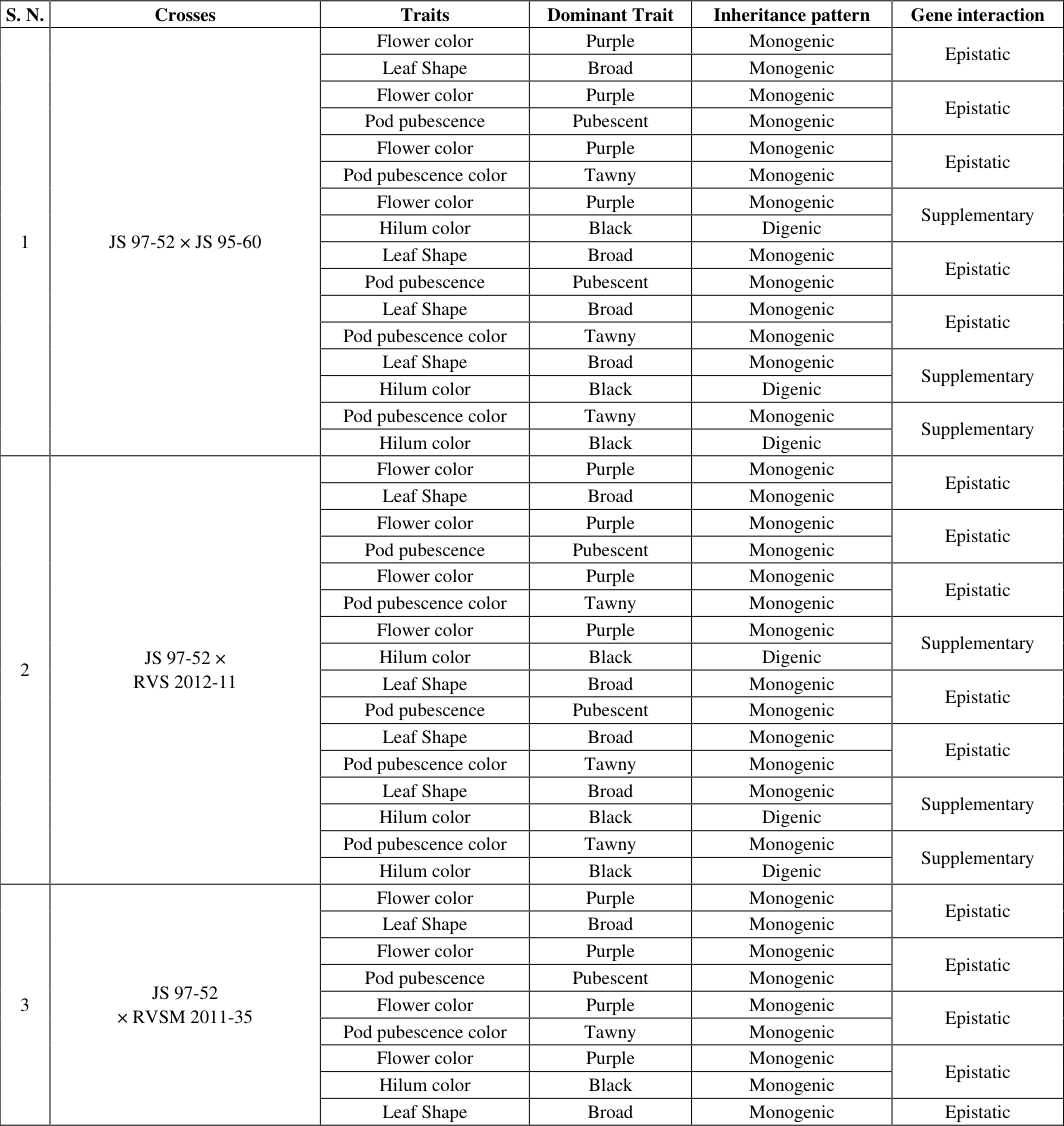 Table 3
 Table 4
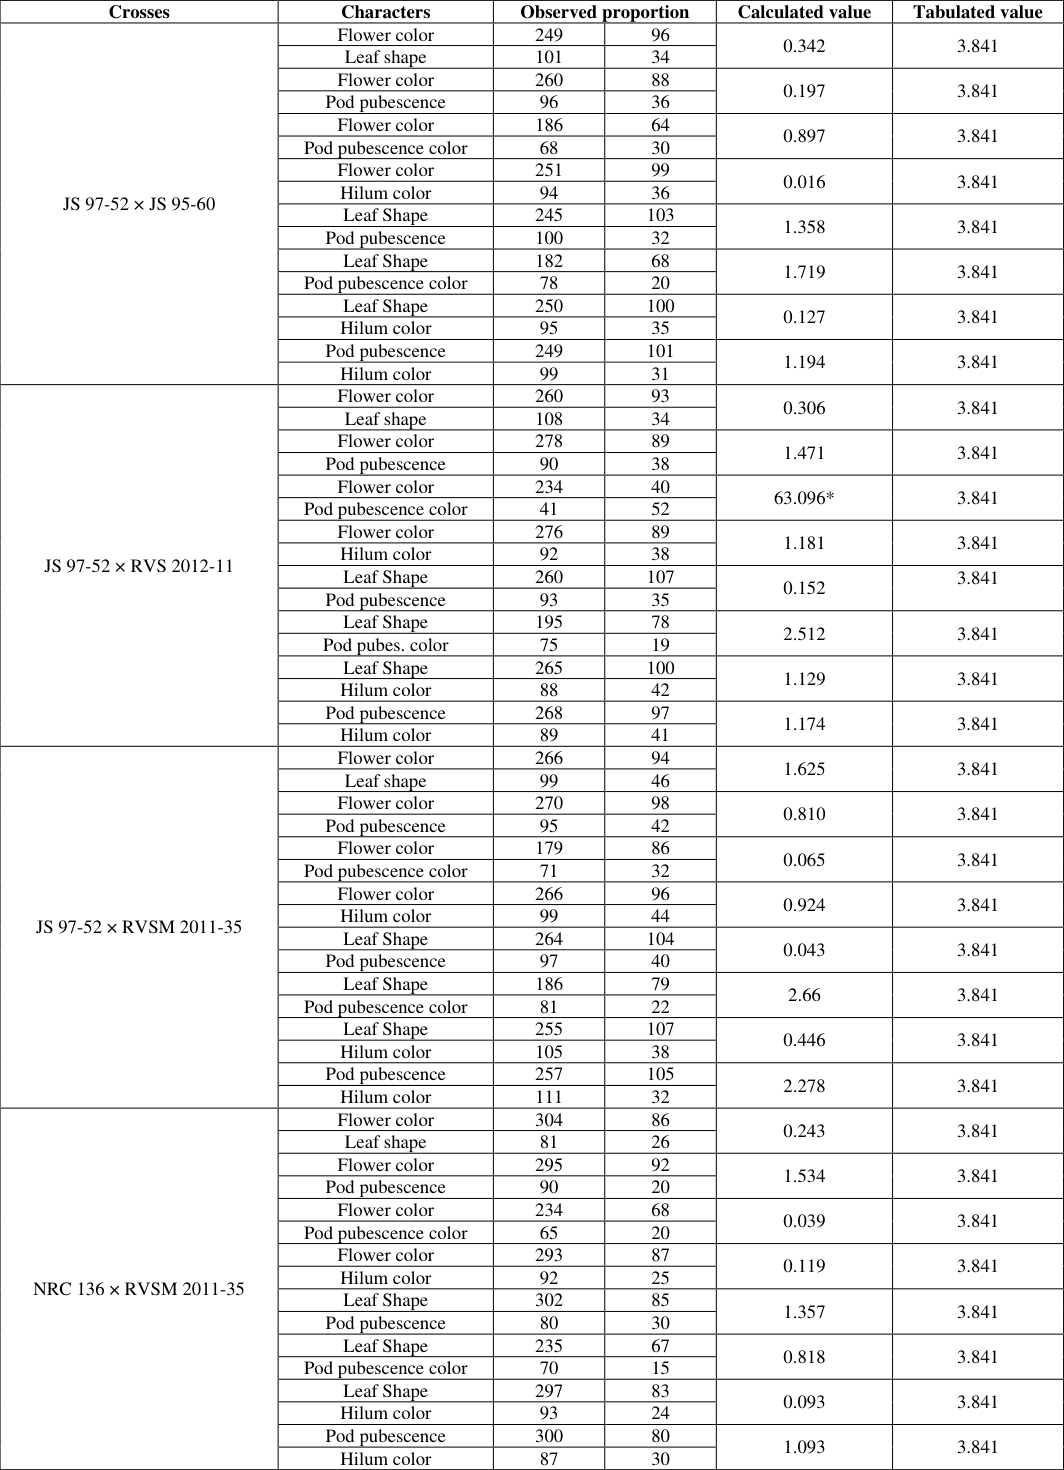 Table 5
Introduction
Soybean (Glycine max L. Merrill) is a leguminous and autogamous crop. It is a significant global source of oil, proteins, and phytochemicals that promote health for use in animal feed and human nutrition. Owing to its deep root structure and ability to fix nitrogen, soybean farming also increases soil productivity (Ali, 2010) [1] . Soybeans are regarded as one of the top oilseed crops in India. The genes that a plant received from its parents were measured using plant ratios and the chi-square test to determine how these genes interact or respond to a specific environment. For population development and improvement, soybean breeders employ selected markers such as leaf shape, flower color, and pod pubescence. These traits act as markers or indicators of homozygosity or heterozygosity during selection and are relevant to the phenotype of the plant population. Qualitative features were refined through selection and observation. These characteristics exhibit a Mendelian pattern of inheritance, are mostly determined by one or a small number of genes, and are hardly influenced by environmental factors (Kole et al. 2010) [4] . Knowledge of the gene (s) governing the qualitative attributes of soybeans and how they are inherited will help advance our understanding of the genetics of this crop and make it easier to apply this knowledge in subsequent studies. An essential feature that must be assessed for the effective gathering and conservation of soybean genetic resources is their qualitative characteristics (Oide and Ninomiya 2000) [8] .
Materials and Methods
The current investigation was conducted in the kharif of 2021 and 2022 at, Indira Gandhi Krishi Vishwavidyalaya, Raipur (C.G.) The climate was suitable for typical crop growth. Five parents-JS 97-52, JS 95-60, RVS 2012-11, RVSM 2011-35, and NRC 136 were employed in the current investigation. Numerous characteristics, including flower color, leaf shape, pod pubescence color and seed hilum color, were varied between these parents. The following crosses were created for the study: JS 97-52 × JS 95-60,JS 97-52 × RVS 2012In the current study, parents and F 1 observations were recorded during kharif season of 2021. Critical observation and documentation were done on the opposing features of the parents and the traits that manifested in the F 1 .The F 2 population was raised in large quantities during the kharif 2022 season. Each individual plant in the population was observed for distinct contrasting features, and each trait was counted independently. The chi square (ꭓ 2 ) test was carried out to test goodness of fit. Null hypothesis (h 0 ) was formulated to test segregation of observed frequencies against expected ones. To determine whether there was any correlation between two characters, the test of independence (Panse and Sukhatme, 1954) was used to two characters in the F 2 population that were segregated simultaneously for the detection of linkage.
Result, Discussion and Conclusions Inheritance studies
To study the gene interaction in this research, inheritance study was done for various characters in the abovementioned crosses. In parents and F 1 generation, inheritance of various qualitative traits i.e. flower color, leaf shape, pod pubescence color and seed hilum color were recorded. In next generation, segregation pattern of F 2 for different traits were recorded. After that, statistical analysis was done with the help of goodness of fit. In this, chi square test was applied to find out how the observed value of a given phenomena was significantly different from the expected value. It is a valuable tool for the breeder to decide the observe data is according to an expected ratio or it agrees well with expected or theoretical frequency distribution. If observed χ 2 value is higher than expected χ 2 value, it is said to be significant otherwise it is said to be non significant and null hypothesis is accepted. So the overall summary of it is presented in the table 1, table 2 andtable 3. In the present study inheritance of flower color, leaf shape, pod pubescence color and seed hilum color of four crosses were worked out.
| S.N. | Name of cross | Trait | Expression in F1 | Observed value in F2 | — | — | Expected ratio | Expected value for F2 | — | — | Chi Square (ꭓ2) | P Value (0.05) |
|---|---|---|---|---|---|---|---|---|---|---|---|---|
| 1 | JS 97- 52 × JS 95- 60 | Flower color | Purple | 345 Purple | 135 White | 3:1 | 360 Purple | 120White | 2.5 | 0.11 | ||
| Leaf shape | Broad | 350 Broad | 130 Narrow | 3:1 | 360 Broad | 120 Narrow | 1.11 | 0.29 | ||||
| Pod pubescence | Pubescent | 348 Pubescent | 132 Glabrous | 3:1 | 360 Pubescent | 120 Glabrous | 1.6 | 0.21 | ||||
| Pod pubescence color | Tawny | 250 Tawny | 98 Grey | 3:1 | 261 Tawny | 87 Grey | 1.85 | 0.17 | ||||
| Hilum color | Black | 250 Black | 100 Brown | 130 Grey | 9:3:4 | 270 Black | 90 Brown | 130 Grey | 3.43 | 0.18 | ||
| 2 | JS 97-52 × RVS 2012-11 | Flower color | Purple | 368 Purple | 127 White | 3:1 | 371.25 Purple | 123.75 White | 0.11 | 0.74 | ||
| Leaf shape | Broad | 353 Broad | 142 Narrow | 3:1 | 371.25 Broad | 123.75 Narrow | 3.6 | 0.06 | ||||
| Pod pubescence | Pubescent | 367 Pubescent | 128 Glabrous | 3:1 | 371.25 Pubescent | 123.75 Glabrous | 0.19 | 0.66 | ||||
| Pod pubescence color | Tawny | 274 Tawny | 93 Grey | 3:1 | 275.25 Tawny | 91.75 Grey | 0.02 | 0.88 | ||||
| Hilum color | Black | 265 Black | 100 Brown | 130 Grey | 9:3:4 | 278.44 Black | 92.81 Brown | 123.75 Grey | 1.52 | 0.47 | ||
| 3 | JS 97-52 × RVSM 2011-35 | Flower color | Purple | 365 Purple | 140 White | 3:1 | 378.75 Purple | 126.25 White | 2.0 | 0.16 | ||
| Leaf shape | Broad | 360 Broad | 145 Narrow | 3:1 | 378.75 Broad | 126.25 Narrow | 3.71 | 0.05 | ||||
| Pod pubescence | Pubescent | 368 Pubescent | 127 Glabrous | 3:1 | 378.75 Pubescent | 126.25 Glabrous | 1.22 | 0.27 | ||||
| Pod pubescence color | Tawny | 265 Tawny | 103 Grey | 3:1 | 276 Tawny | 92 Grey | 1.75 | 0.18 | ||||
| Hilum color | Black | 362 Black | 143 Yellow | 3:1 | 378.75 Black | 126.25 Yellow | 2.96 | 0.08 | ||||
| 4 | NRC 136 × RVSM 2011-35 | Flower color | Purple | 385 Purple | 112 White | 3:1 | 372.75 Purple | 124.25 White | 1.61 | 0.20 | ||
| Leaf shape | Broad | 390 Broad | 107 Narrow | 3:1 | 372.75 Broad | 124.25 Narrow | 3.19 | 0.07 | ||||
| Pod pubescence | Pubescent | 387 Pubescent | 110 Glabrous | 3:1 | 372.75 Pubescent | 124.25 Glabrous | 2.17 | 0.14 | ||||
| Pod pubescence color | Tawny | 302 Tawny | 85 Grey | 3:1 | 290.25 Tawny | 96.75 Grey | 1.90 | 0.17 | ||||
| Hilum color | Black | 380 Black | 117 Yellow | 3:1 | 372.75 Black | 124.25 Yellow | 0.56 | 0.45 |
Table text extracted from the original PDF; superscript letters are shown inline. The original table image is below.
View original table image
| S. No. | Parents | Distinguishing traits |
|---|---|---|
| 1. | JS 97-52 | White flower, tawny pod pubescence, broad leaf and black hilum |
| 2. | JS 95-60 | Purple flower, glabrous (Absence of pod pubescence), narrow leaf and grey hilum |
| 3. | RVS 2012-11 | Purple flower, glabrous (Absence of pod pubescence), narrow leaf and grey hilum |
| 4. | RVSM 2011-35 | Purple flower, glabrous (Absence of pod pubescence), narrow leaf and yellow hilum |
| 5. | NRC 136 | White flower, tawny pod pubescence, brown hilum and broad leaf |
Table text extracted from the original PDF; superscript letters are shown inline. The original table image is below.
View original table image
Linkage Detection between traits
Genes that are linked together always pass along the same combination of alleles for more than two generations. Morgan noticed that when two genes were crossed, they did not divide in accordance with Mendel's law. There is a significantly higher likelihood of a parental combination arising when two genes are on the same chromosome than with non-parental combinations. linkage describes how closely genes or other DNA sequences are located to one another on the same chromosome. The likelihood that two genes or sequences will be passed down from parents to their offspring increases with the proximity of those genes or sequences on a chromosome.
Test of independence among traits in soybean
In the present study, test of independence was calculated for detection of linkage to know its presence or absence. In the cross between JS 95-60 × RVS 2012-11, the segregation ratio in F 2 population for the trait flower color was 3 purple: 1 white, whereas for pod pubescence color was 3 tawny: 1 grey. Considering the proportions of plants with purple flower color and white flower color in each of the two classes, tawny pod pubescence color and grey pod pubescence color (Table 4). The ꭓ 2 can be calculated from the observed frequencies with help of Panse and Sukhatme (1954) formula. If a. b, c and d denote the frequencies in four cells of the 2×2 table. It can be shown that
| Flower color Pod pubescence color | Purple | White | Total |
|---|---|---|---|
| Tawny | 234 | 40 | 274 |
| Grey | 41 | 52 | 93 |
| Total | 275 | 92 | 367 |
Table text extracted from the original PDF; superscript letters are shown inline. The original table image is below.
View original table image
For 1 degree of freedom a = 234 b = 40 c = 41 d = 52 This formula involves apart from factor (ad-bc) 2 the four marginal totals and grand total making use of formula we have.
Since the calculated value of 63.09 is greater than the table value of 3.841, the chi square value is compared against the value at the 5% or 1% level of significance for one degree of freedom. This leads to the conclusion that the two characters, flower color and pod pubescence color, are linked and are not independent. As same like this, test of independence for all the previously mentioned crosses i.e. JS 97-52 × JS 95-60, JS 97-52 × RVSM 2011-35 and NRC 136 × RVSM 2011-35 were calculated. The calculated value was then compared with tabulated value. Significant difference was found only between flower color and pod pubescence color in cross JS 97-52 × RVS 2012-11 and others were found to be non significant (Table 5). In all the four crosses dominant nature of traits were observed for all the characters in F 1 generation. In F 2 segregation was observed in ratio of 3:1. Flower color, Leaf shape, Pod pubescence and Pod pubescence color proved to be monogenic. Trait seed hilum color was found to be governed by supplementary gene action in two crosses whereas in two other crosses it was monogenic. The current work may be essential to crop development programs and considerably contributes to our understanding of the mendelian inheritance of the stated qualitative traits. To investigate related traits in the aforementioned crosses, linkage detection was carried out by using the test of independence. It was found that trait flower color and pod pubescence color was linked in one of the cross.
| Crosses | Characters | Observed proportion | — | Calculated value | Tabulated value |
|---|---|---|---|---|---|
| JS 97-52 × JS 95-60 | Flower color | 249 | 96 | 0.342 | 3.841 |
| Leaf shape | 101 | 34 | |||
| Flower color | 260 | 88 | 0.197 | 3.841 | |
| Pod pubescence | 96 | 36 | |||
| Flower color | 186 | 64 | 0.897 | 3.841 | |
| Pod pubescence color | 68 | 30 | |||
| Flower color | 251 | 99 | 0.016 | 3.841 | |
| Hilum color | 94 | 36 | |||
| Leaf Shape | 245 | 103 | 1.358 | 3.841 | |
| Pod pubescence | 100 | 32 | |||
| Leaf Shape | 182 | 68 | 1.719 | 3.841 | |
| Pod pubescence color | 78 | 20 | |||
| Leaf Shape | 250 | 100 | 0.127 | 3.841 | |
| Hilum color | 95 | 35 | |||
| Pod pubescence | 249 | 101 | 1.194 | 3.841 | |
| Hilum color | 99 | 31 | |||
| JS 97-52 × RVS 2012-11 | Flower color | 260 | 93 | 0.306 | 3.841 |
| Leaf shape | 108 | 34 | |||
| Flower color | 278 | 89 | 1.471 | 3.841 | |
| Pod pubescence | 90 | 38 | |||
| Flower color | 234 | 40 | 63.096* | 3.841 | |
| Pod pubescence color | 41 | 52 | |||
| Flower color | 276 | 89 | 1.181 | 3.841 | |
| Hilum color | 92 | 38 | |||
| Leaf Shape | 260 | 107 | 0.152 | 3.841 | |
| Pod pubescence | 93 | 35 | |||
| Leaf Shape | 195 | 78 | 2.512 | 3.841 | |
| Pod pubes. color | 75 | 19 | |||
| Leaf Shape | 265 | 100 | 1.129 | 3.841 | |
| Hilum color | 88 | 42 | |||
| Pod pubescence | 268 | 97 | 1.174 | 3.841 | |
| Hilum color | 89 | 41 | |||
| JS 97-52 × RVSM 2011-35 | Flower color | 266 | 94 | 1.625 | 3.841 |
| Leaf shape | 99 | 46 | |||
| Flower color | 270 | 98 | 0.810 | 3.841 | |
| Pod pubescence | 95 | 42 | |||
| Flower color | 179 | 86 | 0.065 | 3.841 | |
| Pod pubescence color | 71 | 32 | |||
| Flower color | 266 | 96 | 0.924 | 3.841 | |
| Hilum color | 99 | 44 | |||
| Leaf Shape | 264 | 104 | 0.043 | 3.841 | |
| Pod pubescence | 97 | 40 | |||
| Leaf Shape | 186 | 79 | 2.66 | 3.841 | |
| Pod pubescence color | 81 | 22 | |||
| Leaf Shape | 255 | 107 | 0.446 | 3.841 | |
| Hilum color | 105 | 38 | |||
| Pod pubescence | 257 | 105 | 2.278 | 3.841 | |
| Hilum color | 111 | 32 | |||
| NRC 136 × RVSM 2011-35 | Flower color | 304 | 86 | 0.243 | 3.841 |
| Leaf shape | 81 | 26 | |||
| Flower color | 295 | 92 | 1.534 | 3.841 | |
| Pod pubescence | 90 | 20 | |||
| Flower color | 234 | 68 | 0.039 | 3.841 | |
| Pod pubescence color | 65 | 20 | |||
| Flower color | 293 | 87 | 0.119 | 3.841 | |
| Hilum color | 92 | 25 | |||
| Leaf Shape | 302 | 85 | 1.357 | 3.841 | |
| Pod pubescence | 80 | 30 | |||
| Leaf Shape | 235 | 67 | 0.818 | 3.841 | |
| Pod pubescence color | 70 | 15 | |||
| Leaf Shape | 297 | 83 | 0.093 | 3.841 | |
| Hilum color | 93 | 24 | |||
| Pod pubescence | 300 | 80 | 1.093 | 3.841 | |
| Hilum color | 87 | 30 |
Table text extracted from the original PDF; superscript letters are shown inline. The original table image is below.
View original table image
Figures and tables from the paper
| S. N. | Crosses | Traits | Dominant Trait | Inheritance pattern | Gene interaction |
|---|---|---|---|---|---|
| 1 | JS 97-52 × JS 95-60 | Flower color | Purple | Monogenic | Epistatic |
| Leaf Shape | Broad | Monogenic | |||
| Flower color | Purple | Monogenic | Epistatic | ||
| Pod pubescence | Pubescent | Monogenic | |||
| Flower color | Purple | Monogenic | Epistatic | ||
| Pod pubescence color | Tawny | Monogenic | |||
| Flower color | Purple | Monogenic | Supplementary | ||
| Hilum color | Black | Digenic | |||
| Leaf Shape | Broad | Monogenic | Epistatic | ||
| Pod pubescence | Pubescent | Monogenic | |||
| Leaf Shape | Broad | Monogenic | Epistatic | ||
| Pod pubescence color | Tawny | Monogenic | |||
| Leaf Shape | Broad | Monogenic | Supplementary | ||
| Hilum color | Black | Digenic | |||
| Pod pubescence color | Tawny | Monogenic | Supplementary | ||
| Hilum color | Black | Digenic | |||
| 2 | JS 97-52 × RVS 2012-11 | Flower color | Purple | Monogenic | Epistatic |
| Leaf Shape | Broad | Monogenic | |||
| Flower color | Purple | Monogenic | Epistatic | ||
| Pod pubescence | Pubescent | Monogenic | |||
| Flower color | Purple | Monogenic | Epistatic | ||
| Pod pubescence color | Tawny | Monogenic | |||
| Flower color | Purple | Monogenic | Supplementary | ||
| Hilum color | Black | Digenic | |||
| Leaf Shape | Broad | Monogenic | Epistatic | ||
| Pod pubescence | Pubescent | Monogenic | |||
| Leaf Shape | Broad | Monogenic | Epistatic | ||
| Pod pubescence color | Tawny | Monogenic | |||
| Leaf Shape | Broad | Monogenic | Supplementary | ||
| Hilum color | Black | Digenic | |||
| Pod pubescence color | Tawny | Monogenic | Supplementary | ||
| Hilum color | Black | Digenic | |||
| 3 | JS 97-52 × RVSM 2011-35 | Flower color | Purple | Monogenic | Epistatic |
| Leaf Shape | Broad | Monogenic | |||
| Flower color | Purple | Monogenic | Epistatic | ||
| Pod pubescence | Pubescent | Monogenic | |||
| Flower color | Purple | Monogenic | Epistatic | ||
| Pod pubescence color | Tawny | Monogenic | |||
| Flower color | Purple | Monogenic | Epistatic | ||
| Hilum color | Black | Monogenic | |||
| Leaf Shape | Broad | Monogenic | Epistatic |
Table text extracted from the original PDF; superscript letters are shown inline. The original table image is below.
View original table image
References
11 in the original paper- Araujo LC, Juhasz AC, Azevedo CV, Barbaro-Torneli IM, Vianna VF, di Mauro AO, et al. Inheritance of seed characteristics in soybean progenies from grain type × food type crosses. Genet. Mol. Res. 2019;18(4):6.
- Kole C, Ratnaparkhe MB, Bilyeyu K. Genetics, Genomics and Breeding of Soybean: Classical Breeding and Genetics of Soybean. 1 st ed. USA: CRC Press; 2010:21.
- Kosambi, D.D. The estimation of map distance from recombination values. Annals of Eugenics. 1944;12:172-175.
- Miku M.G. Genetics of some qualitative characters of soyabean. In Biol. Genet. 1970, 117-131.
- Murty VN. Estimation of linkage by the method of minimum discrepancy. Genetics. 1954;39(5):581.
- Oide M, Ninomiya S. Discrimination of soybean plant shape by linear neural network with image input. Agr. Info. Res. 2000;9:91-102.
- Palmer RG. Soybean linkage tests. Soybean Genet. Newsl. Iowa State University 1977;4:40-42.
- Pathak S, Shukla PS. Inheritance of Seed Related Characters in Soybean Crosses. Biological Forum -An International Journal. 2021;13(4):1145-1148.
- Porter CY. Inheritance of the Gene (s) Controlling Leaflet Shape in Soybean (Doctoral dissertation, Virginia Tech), 2000, 22-44.
- Raut VM, Halvankar GB, Patil V. Genetic studies in soybean. III. Inheritance and linkage studies. Indian J. Genet. Plant Breed. 1994;54(03):209-215.
- Yee CC, Palmer RG. Summary of locus-to-locus linkage data in soybean. Soybean Genet. Newsl. Iowa State University. 1984;11:115-126.