
Research article · 2024 · Full text
International Journal of Research in AgronomyCharacteristics of west coast lateritic soils of Southern India
Volume 7(3) · Pages 659–664 · DOI: 10.33545/2618060x.2024.v7.i3i.496 ↗
Research areasGeotechnical and construction materials studies
Abstract
Author-writtenBackground: Soil fertility is meant for understanding the nutrient requirements, based on fertility status of soils to achieve good crop yields. Soil fertility, compact-ability and erodibility are the domains of soil quality. Among these, the problem of decline in soil fertility compromises maximum productivity. Depletion in soil fertility is the hugest serious due to cropping pattern, leaching, erosion etc., causes loss of considerable amount of nutrients annually. In order to notice information on current soil fertility status, this study was accompanied in different Talukas of Dakhsina Kannada district of coastal Karnataka. Methods: Characterized the soils for fertility status by taking fifty representative samples from each taluk of Dakshina Kannada district in coastal Karnataka to recommend chemical and organic fertilizers applications based on the present soil nutrient status for the farming community.Results: The soils were persisted acidic in reaction, with very low salt content, medium to high in organic carbon status. The available macronutrients of the soil samples indicated that the nitrogen and potassium low to medium in all the Talukas, and low in available phosphorous and Sulphur. Among the DTPA extractable micronutrients, iron and manganese were in high in most samples collected, available copper was adequate and available zinc was also sufficient except in soil samples of Bantwal Taluk. The available boron was found to be low in soils of all the talukas of the district.
Summary
Source-checkedPlain-language reading of the full paper, prepared with AI and checked against the text. Each point links to the authors' own words.
Why it matters
- Declining soil fertility is a critical issue because it limits the maximum productivity of crops. View evidence ↗
- Soil fertility is depleted annually through processes such as erosion, leaching, and specific cropping patterns. View evidence ↗
- The Dakshina Kannada district in coastal Karnataka has an economy primarily based on industry and horticulture. View evidence ↗
The question
- The study aimed to determine the current soil fertility status across different Talukas of the Dakshina Kannada district. View evidence ↗
What they did
- The study measured pH, electrical conductivity, organic carbon, nitrogen, phosphorus, potassium, and sulphur using established standard chemical extraction and estimation methods. View evidence ↗
- Micronutrients (Fe, Cu, Mn, Zn) were measured via DTPA extraction and atomic absorption spectrophotometry, while Boron was measured via hot water extraction. View evidence ↗
What they found
- Soils across all six Talukas were moderate to strongly acidic, with pH values ranging from a low of 4.9 in Sullia to a high of 5.7 in Puttur. View evidence ↗
- Organic carbon content was high in all Talukas, with average values between 7.6 g kg-1 and 11.2 g kg-1. View evidence ↗
- Available nitrogen was rated low to medium, ranging from 212.4 kg ha-1 in Moodabidri to 388.4 kg ha-1 in Puttur. View evidence ↗
- Available phosphorus was rated as low across all Talukas, with averages between 16.2 and 21.8 kg ha-1. View evidence ↗
- Available sulphur was rated as very low in most soils, with averages between 7.74 and 9.51 mg kg-1. View evidence ↗
- Zinc levels (0.58 to 1.03 mg kg-1) were sufficient in most areas, except for the soils in Bantwal Taluk. View evidence ↗
- The soils were rich in available iron, with DTPA extractable Fe ranging from 39.7 to 52.4 mg kg-1. View evidence ↗
- Available manganese was high in all Talukas, with mean values between 3.15 and 4.45 mg kg-1. View evidence ↗
- Available boron was low (0.24 mg kg-1), which the authors link to nut cracking and nut fall in areca nut fields. View evidence ↗
What it means
- The authors conclude that deficient nutrients must be restored using organic manures or chemical fertilizers to ensure sustainable crop production. View evidence ↗
Visual summary
1 visualsIllustrations explain the paper; they do not show study data.
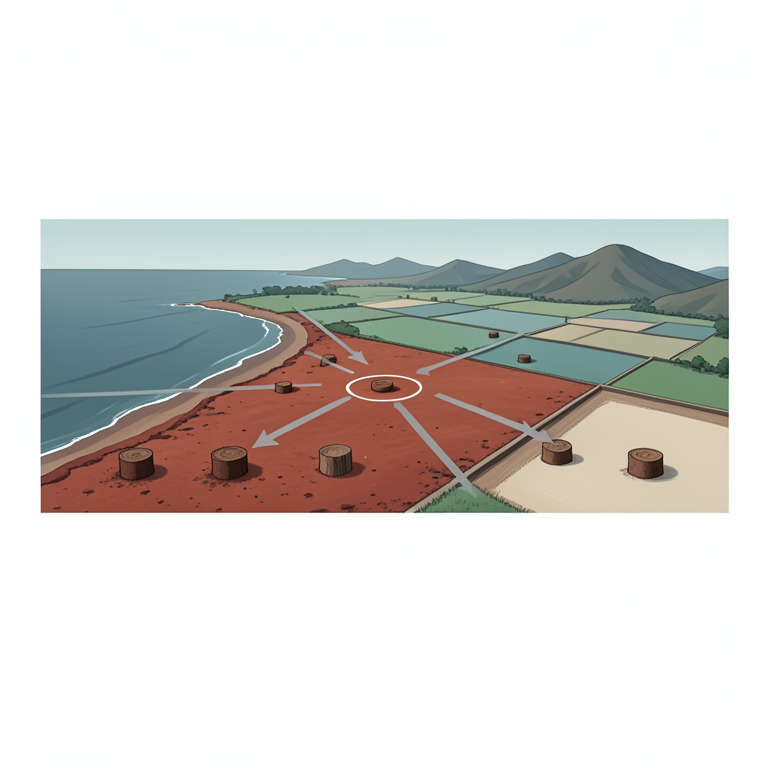
Study Area and Sampling
AI-generated conceptual illustration (lateritic soils of the coastal region of Southern India). It explains the idea and does not show study data.
View source evidence ↗Figures & tables
From the original paper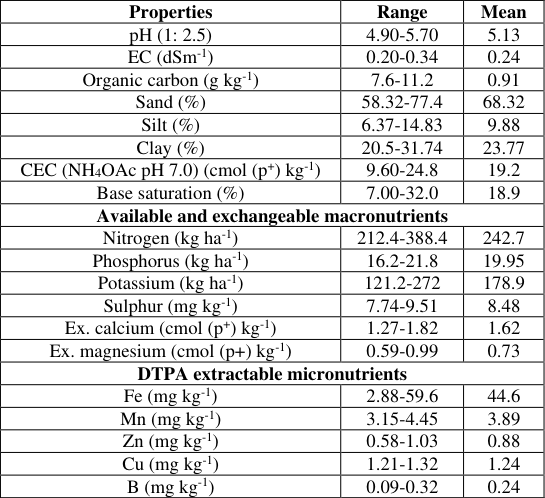 Table 1
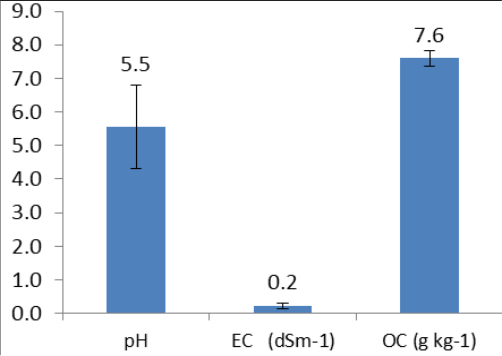 Figure 1
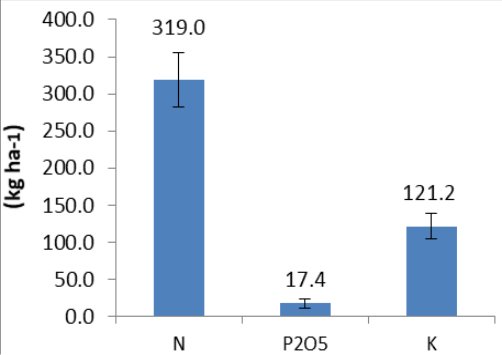 Figure 2
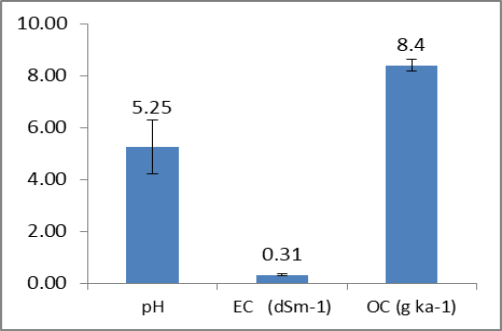 Figure 3
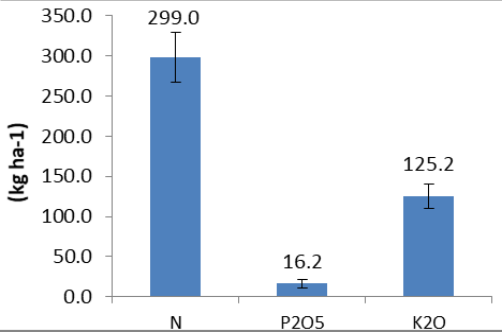 Figure 4
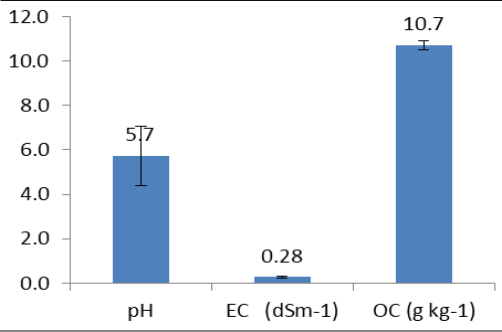 Figure 5
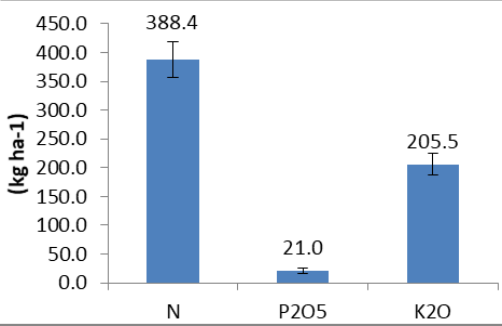 Figure 6
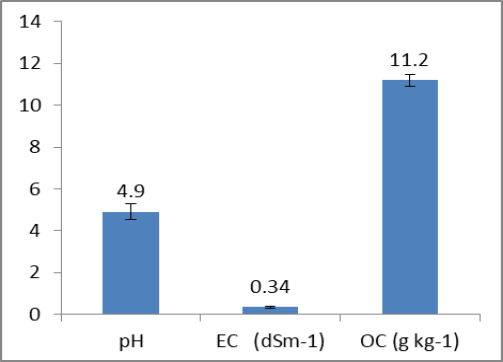 Figure 7
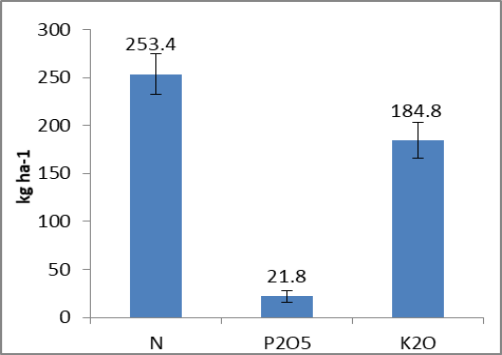 Figure 8
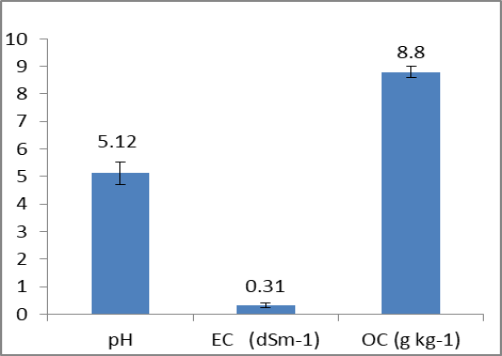 Figure 9
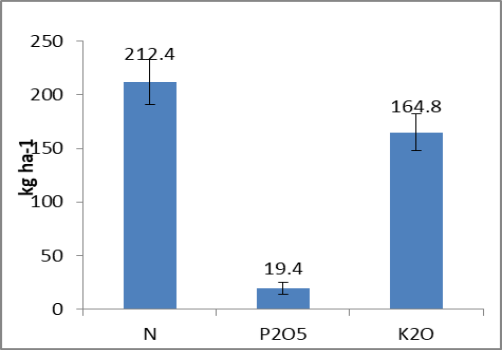 Figure 10
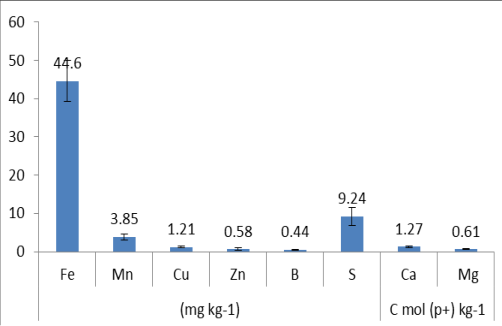 Figure 11
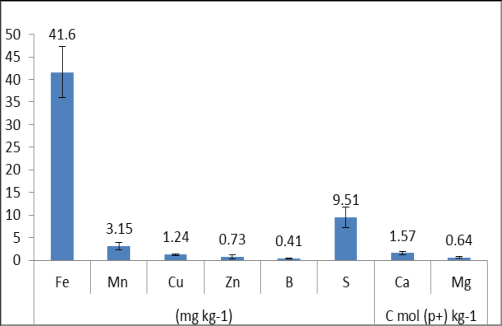 Figure 12
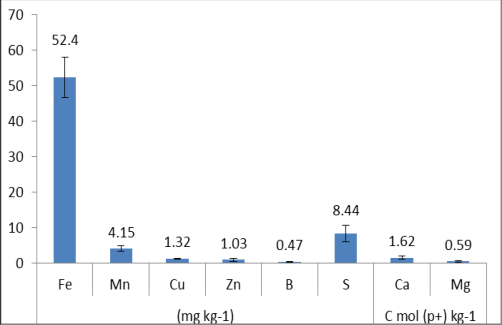 Figure 13
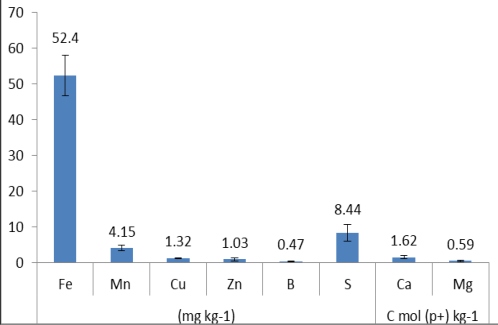 Figure 14
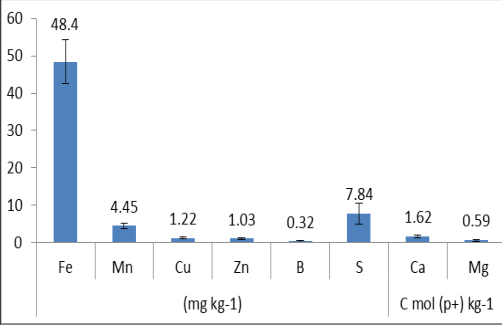 Figure 15
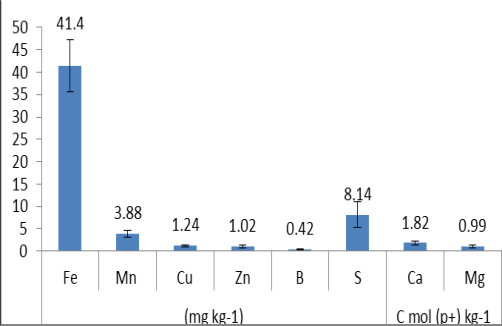 Figure 16
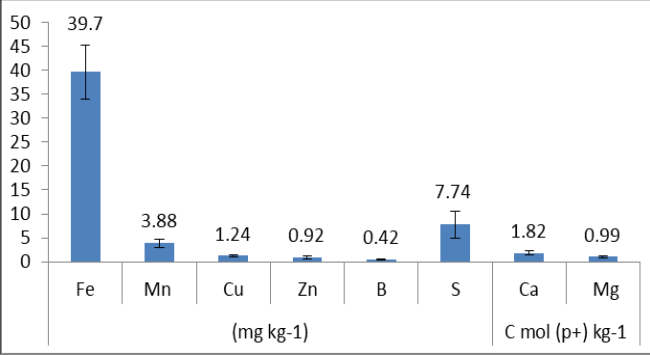 Figure 17
Introduction
Soil fertility, compact-ability and erodibility are the elements of soil quality. Among these, the problem of decline in soil fertility endangers maximum productivity. Warren and Agnew (1988) described that of all the threats to sustainability, the threat due to soil fertility depletion is the most serious. Depending upon the cropping pattern, leaching, erosion etc., soil loses a considerable amount of nutrients every year. If cropping is continued over a period of time without nutrients being restored to the soil, its fertility will be reduced and crop yields will decline. Poor soil fertility conceives sparse plant cover, which promote erosion vulnerability. This happens because 90 percent of plant available Nitrogen (N) and Sulphur (S), 50-60 percent potassium (K), 25-30 percent phosphorus (P) and almost 70 percent of micronutrients reside in organic matter. Soil fertility is meant for highlighting the nutrient needs, based on fertility status of soils (and adverse soil conditions which need improvement) to realize good crop yields. Dakshina Kannada is one of the three coastal districts of the state with predominantly horticultural and industrial economy. The total geographical area is 4771 sq. kms of which 27% is covered by forests. The Topography of the District is undulating. The average altitude of the district is 30 meters above Mean Sea Level. The District is characterized by high rainfall (4000 mm mostly received during June to October) High temperature (Max-36.2 °C and Min 20.4 °C) and high humidity (84.5 to 96.5%). Soils are lateritic and acidic in nature. Cropping pattern shows that nearly one-third of the gross cropped area is under food grains and remaining under Plantation and horticultural crops like coconut, arecanut, black pepper, cashew etc. The district is a part of peninsular India located half way between Mumbai and Cape Cameron and is stretching 60 Kms. from North to South and 70 Kms. from East to West in the form of a low lying broken plateau from Western Ghats to Arabian Sea. In order to know information on present soil fertility status, this study was accompanied in different Taluks of Dakhsina Kannada district of coastal Karnataka.
Materials and Methods
The survey work was carried out to assess the availability of plant nutrients status in soils of Dakshina Kannada district of coastal Karnataka. Fifty representative soil samples from farmer fields were collected at different villages of each Taluka (Via. Bantwal, Belthanady, Puttur, Sullia, Kadaba and Moodabidri) during the month of April to May 2020 and later were analyzed in Soil and water testing laboratory of Krishi Vigyan Kendra, Dakshina Kannada. Electrical conductivity, pH, organic carbon, were determined by standard methods (Jackson 1973) [3] . Available nitrogen was estimated by alkaline permanganate method (Subbaiah and Asija, 1956) [13] . For available phosphorus determination, extraction was done using Brays extractant and then subsequent estimation by Jackson, (1973) [3] method. Available potassium was extracted using neutral normal ammonium acetate and measured with flame photometer (Jackson, 1973) [3] . Sulphur was extracted using 0.15 percent CaCl 2 solution and was made to react with BaCl 2 to form turbid solution of BaSO 4 . The intensity of turbidity was measured using spectrophotometer at a wavelength of 420 nm (Jackson, 1973) [3] . Exchangeable calcium and magnesium were determined using versenate (EDTA) titration method. Available micronutrients such as iron, copper, manganese and zinc were extracted using standard DTPA extract at pH 7.3 and the concentration was measured in an atomic absorption spectrophotometer (Lindsay and Norvell, 1978) [4] . Boron (Hot water extraction), particle size analysis by international pipette method and the percent base saturation was calculated by using following formula % Base saturation = Exchangeable Bases / CEC X 100
Results and Discussions
Results and Discussions
Physico-chemical properties
The data on particle size distribution of all the talukas of Dakshina Kannada were presented in above Table and is based the recorded data surface soil comprises more than 68 percent sand, 23 percent of clay and 9 percent of silt. As a result, these soils are texturally classified as sandy, sandy loam to sandy clay loam. As these areas receive high rainfall clay fraction is always subjected to illuviation process (Sahoo et al.1990) [7] . Soils of all the six Taluks were moderate to strongly acidic with highest average soil pH of 5.7 was recorded in Puttur Taluk (Fig. v) and lowest average pH of 4.9 was in soils of Sullia Taluk (Fig. ix). The acidic pH of the soil might be attributed mainly to the leaching of the bases due to the existing high rainfall conditions and to some extent due to the acidic parent materials. These soils are non-saline in nature (free of soluble salts) with average electrical conductivity ranges between 0.20-0.34 dSm -1 .
Cashew growing soils of Dakshina Kannada district of Karnataka are also high in organic carbon at the surface and low in sub-soils. It varied from 0.97 to 3.07 percent at the surface (Srinivasan et al. 2013) [11] . The average organic carbon content of the soils varied from 7.6 g kg -1 soil to 11.2 g kg -1 soil and was found to be high in all Taluks of the district. This is attributed to the addition of plant residues and farmyard manure to surface horizons. These results were justifiable with the studies of Harish Shenoy, 2019 [2] . Among soils of the different taluks studied cation exchange capacity was varied from 9.6-24.8 with mean value of 19.2 cmol (p + ) kg -1 . Further, percent base saturation was found low (7.0-32.0) with mean of 18.9 percent. This can be attributed to textural variations and difference in the status of organic matter (Rao 1992) [6] .
Available macronutrients
The status on available macronutrient contents of soils in different of Dakshina Kannada are depicted in Nitrogen status may due to the fact that the soil could retain only a limited quantity of mineralized Nitrogen and significant amount of Nitrogen loss through leaching and denitrification in these soils (Usha and Jose 1983) [14] . The available nitrogen was less than 280 kg ha -1 hence rated low (Srinivasamurthy et al., 1999) [10] . The available phosphorus content in soils of all Taluks averages varied from 16.2 to 21.8 kg ha -1 and was rated as low. Low available phosphorus of soils was due to the prevalence of heavy rainfall which leached all the base cations leaving mostly Fe and Al oxides, which fixes available phosphorus. Available potassium averages ranged from 121.2 to 272.0 kg ha - 1 and in most of the study area soils were with low to medium level of potassium. The highest average available K content was noticed in soils of Kadaba Taluk and lowest average in Bantwal Taluk. This could be attributed to more intensive weathering, release of labile K from organic residues and application of K fertilizers. Coarse textured and gravelly soils with deeper solum are particularly low in available potassium, possibly due to faster and deeper leaching and physico-chemical properties (Badrinath et al., 1986) [1] . Ratings for available potassium indicate that values less than 141 kg ha -1 are low 141to 336 kg ha -1 as medium as and more than 336 kg ha -1 as high (Srinivasamurthy et al., 1999) [10] . Similar results were reported in the studies of Singh et al., 2007 [9] . The average available sulphur in the soils varied from 7.74 to 9.51 mg kg -1 and most of the soils were very low in ratings. Belthangady and Bantwal Taluk soils had higher amount of available sulphur compared to other locations (Fig.
xiii to xviii).
Sidram Patil et al., 2017 [8] also reported similar results in their studies. Exchangeable calcium and magnesium in all the six Taluks of Dakshina Kannada were low and ranged from 1.27 to 1.82 Cmol (p + ) kg -1 and 0.59 to 0.99 Cmol (p + ) kg -1 respectively, this is due to the prevalence of excess and frequent rainfall in the study areas which leached most of the basic cations like calcium, magnesium, potassium and sodium from the surface soil to lower horizons.
Available micronutrients
The examination of the data on available micronutrients of the soils projected in Fig. xiii to xviii revealed that the DTPA extractable iron, manganese, zinc and copper content varied from deficiency to toxic level in soils of all the Talukas. The DTPA extractable Zn average ranged from 0.58 to 1.03 mg kg -1 soil as shown in Fig. xiii and xvi respectively. Considering 0.60 mg kg -1 as critical level for zinc deficiency (Lindsay and Norvell 1978) [4] , these soils could be classified as Sufficient in Zn except soils of Bantwal Taluk. The high content of available zinc in may be attributed to variable intensity of the pedogenic processes and complexing with organic matter which resulted in chelation of Zn. These observations are in accordance with the findings of Sidram Patil et al. (2017) [8] . Soils of all the Talukas were found to be sufficient in available copper (1.21 to 1.32 mg kg -1 ) as all the values were well above the critical limit proposed (0.20 mg kg -1 ) by Lindsay and Norvell (1978) [4] . The available Cu content was high which might be due to association with organic carbon and soil acidic pH. The DTPA extractable Fe content varied from 39.7 to 52.4 mg kg -1 soil. According to critical limit of 4.5 mg kg -1 (Lindsay and Norvell, 1978) [4] , the soils were rich in available iron. However, the higher DTPA-Fe in soils of all the Talukas might be due to accumulation of organic carbon in the surface horizons. The organic carbon due to its affinity to influence the suitability and availability of iron by chelating action might have protected the iron from oxidation and precipitation, which consequently increased the availability of iron (Prasad and Sakal, 1991) [5] .
Mean available Mn varied from 3.15 to 4.45 mg kg -1 soil and was found to be high in soils of all the Talukas. The highest average of 4.45 mg kg -1 was observed in soils of Kadaba Taluk and lowest average of 3.15 mg kg -1 was recorded in soils of Belthangady Taluk. Most of the soils of Dakshina Kannada were found low in available Boron (0.24 mg kg -1 ) hence there was extreme nut fall and nut cracking in some of the areca nut growing fields. These observations are in accordance with the findings of Srinivasan et al. (2013) [11] .
Conclusions
Fertility status of soils of Dakshina Kannada district of coastal Karnataka indicated that soils are low to medium in available N and available K and low in available P. Available Sulphur remained low in most soils. Among the exchangeable bases, exchangeable calcium was found to be high in most soils, followed by magnesium. With respect to micronutrients, iron and manganese contents were high, available copper was in sufficient range and available zinc was sufficient except in soils of Bantwal Taluk. Availability of boron was low in soils of all the Talukas of Dakshina Kannada. The deficient nutrients have to be restored through chemical fertilizers and/or organic manures to maintain soil health for efficient and sustainable crop production in these soils.
Figures and tables from the paper
| Properties | Range | Mean |
|---|---|---|
| pH (1: 2.5) | 4.90-5.70 | 5.13 |
| EC (dSm-1) | 0.20-0.34 | 0.24 |
| Organic carbon (g kg-1) | 7.6-11.2 | 0.91 |
| Sand (%) | 58.32-77.4 | 68.32 |
| Silt (%) | 6.37-14.83 | 9.88 |
| Clay (%) | 20.5-31.74 | 23.77 |
| CEC (NH4OAc pH 7.0) (cmol (p+) kg-1) | 9.60-24.8 | 19.2 |
| Base saturation (%) | 7.00-32.0 | 18.9 |
| Available and exchangeable macronutrients | ||
| Nitrogen (kg ha-1) | 212.4-388.4 | 242.7 |
| Phosphorus (kg ha-1) | 16.2-21.8 | 19.95 |
| Potassium (kg ha-1) | 121.2-272 | 178.9 |
| Sulphur (mg kg-1) | 7.74-9.51 | 8.48 |
| Ex. calcium (cmol (p+) kg-1) | 1.27-1.82 | 1.62 |
| Ex. magnesium (cmol (p+) kg-1) | 0.59-0.99 | 0.73 |
| DTPA extractable micronutrients | ||
| Fe (mg kg-1) | 2.88-59.6 | 44.6 |
| Mn (mg kg-1) | 3.15-4.45 | 3.89 |
| Zn (mg kg-1) | 0.58-1.03 | 0.88 |
| Cu (mg kg-1) | 1.21-1.32 | 1.24 |
| B (mg kg-1) | 0.09-0.32 | 0.24 |
Table text extracted from the original PDF; superscript letters are shown inline. The original table image is below.
View original table image
References
12 in the original paper- Badrinath MS, Krishnappa AM, Patil BN, Kenchaiah K, Balakrishna Rao K. Fertility status of some typical soils of coastal Karnataka. Journal of the Indian Society of Soil Science. 1986;34:436-438.
- Shenoy H. Study of soil nutrient status of Arecanut gardens of Dakshina Kannada district of coastal Karnataka. International Journal of Agriculture Sciences. 2019;11(5):7996-7998. ISSN: 0975-3710, E-ISSN: 09759107.
- Lindsay WL, Norvell WA. Development of a DTPA soil test for zinc, iron, manganese and copper. Soil Science Society of America Journal. 1978;42:474-481.
- Prasad R, Sakal R. Availability of Fe in calcareous soils in relation to soil properties. Journal of the Indian Society of Soil Science. 1991;39:658-661.
- Sahoo GC, Patnaik SN, Das PK. Morphology, genesis, mineralogy and classification of soils of Northern Plateu zone of Orissa. Journal of the Indian Society of Soil Science. 1990;38:116-121.
- Patil S, Anil Kumar KS, Srinivasamurthy CA. Soil fertility status and nutrient index for primary nutrients in Western Ghats and Coastal Karnataka under different agroecological systems. Asian Journal of Soil Science. 2017;12(2):314-319.
- Singh RS, Singh AK, Shyampura RL. Soil Resource Survey and Mapping of Soils of Bundi district, Annual Report 2007-08, NBSS & LUP; c2007.
- Srinivasan R, Natarajan A, Anil Kumar KS, Kalaivannan D. Characterization of major cashew growing soils of Dakshina Kannada district of Karnataka. Agropedology. 2013;23(2):59-64.
- Srinivasan R, Natarajan A, Kalaivanan D, Anil Kumar KS. Soil fertility status of cashew growing soils of Dakshina Kannada district of coastal Karnataka. Journal of Plantation Crops. 2013;41(3):373-379.
- Subbaiah BV, Asija GL. A rapid procedure for estimation of available nitrogen in soils. Current Science. 1956;25:259260.
- Usha PB, Jose AI. Carbon -nitrogen relationship in laterite soils of Kerala. Agricultural Research Journal of Kerala. 1983;21(2):15-22.
- Vishwanath Shetty Y, Nagamma MS, Dinesh Kumar M, Jayaprakash SM. Fertility Status in Arecanut Garden Soils of Karnataka. Karnataka Journal of Agricultural Sciences. 2008;21(4):503-506.
Cited by 2
From OpenAlex, OpenCitations and reference lists read by Scinovex
- Tracking soil health and potentially toxic elements (PTEs) across land-use types using physico-chemical, magnetic, and geochemical proxies: a case study from Manipal, Southwestern India ↗
Jai Vishnu Degvekar, Esha Ulhas Gadekar, O. Darshana, Jagath Chand, Vadakkeveedu Narayan Amrish, Jithin Jose et al. · Environmental Geochemistry and Health · 2025
Abstract This study investigates spatial variations in soil quality across five distinct land-use types—forest, roadside, agricultural, industrial, and residential—in the Manipal region of southern India. Ten surface soil samples from each land-use category were analysed for physico-chemical properties, geochemical composition, and environmental magnetic parameters to evaluate soil degradation and identify potential pollution sources. Marked variations were observed in electrical conductivity,…
❝ 9PDF - Impact of potassium management in coastal rice crop on socio-economic status in west coast of southern India
Mallikarjuna Lingappa, T. J. Ramesha, R Shivskumar, Kedarnath Kedarnath, R Rashmi · International Journal of Research in Agronomy · 2024
Background: The importance of potassium management in low-fertile soils in heavy rainfall areas, with respect to rice crop productivity, is crucial for developing sustainable rice cultivation in the west coast of southern India. As nitrogen remains heavily subsidized, there is a continued imbalance in the use of nitrogen, phosphorus, and potassium fertilizers. The removal of potassium by the rice crop exceeds its addition through fertilizers and recycling. Most of the soils in the west coast of southern India are low to medium in plant-available potassium. Therefore, the response of rice crops