
Research article · 2024 · Full text
International Journal of Agriculture Extension and Social DevelopmentEconomic analysis of production and cultivation of coconut in Southern districts of Karnataka
Volume 7(3) · Pages 650–654 · DOI: 10.33545/26180723.2024.v7.i3h.486 ↗
Research areasAgricultural Economics and PracticesSocial and Economic Development in India
Abstract
Author-writtenThe present study was conducted to know the economics of production and cultivation of coconut in Southern districts of Karnataka. India occupies a predominant position in the world were Karnataka ranks first in India with productivity of 6.26 tonnes per hectare. The total cost of cultivation per acre is (C3) Rs. 65064 with yield of coconut nuts is 4050 with decreasing gross returns of Rs. 14439 and Cost of production was Rs.16 per nut. While, Rs. 13 was the price of coconut per nut. The total cost of coconut converted in to copra was Rs. 74206 with yield of 4.65 quintals per acre with decreasing gross returns of Rs. 21923 per quintal nuts cost of production per copra with a significant return of Rs. 15958 with price of copra per quintal was Rs. 9700. Major problems faced by the growers are rhinoceros beetle, non-availability of labor, mechanizing of harvesting dehusking breaking and conversion of copra. Hence, from the study it can be concluded that among the significant variables, labor, manure, pesticides, fertilizer and irrigation were more important input resources for the growers in the study area. Labor cost had a greater influence on the productivity of coconut compared to all other variables. Thus, it can be suggested that the Government should provide technical and financial assistances to these farmers.
Summary
Source-checkedPlain-language reading of the full paper, prepared with AI and checked against the text. Each point links to the authors' own words.
Why it matters
- The coconut palm is a vital crop in tropical regions, providing essential resources including food, medicine, and building materials. View evidence ↗
- In India, approximately ten million people rely on coconut cultivation for their livelihood. View evidence ↗
- Karnataka is a leading producer in India, with a productivity of 6.26 tonnes per hectare. View evidence ↗
The question
- The study aimed to analyze the economic factors associated with the production and cultivation of coconut in the southern districts of Karnataka. View evidence ↗
What they did
- Primary data for the study was gathered from a sample of 60 farmers. View evidence ↗
- Data collection was performed via personal interviews conducted in October 2020. View evidence ↗
- The economic analysis accounted for variable costs (inputs, labor, irrigation) and fixed costs (insurance, taxes, land rental, and depreciation). View evidence ↗
What they found
- The total cost of cultivating coconut per acre was found to be Rs. 65,064. View evidence ↗
- For the 2020-21 period, the average yield was 4,050 nuts per acre. View evidence ↗
- Cultivation resulted in negative gross returns of Rs. 14,439 when measured against the total cost (C3). View evidence ↗
- The cost of production for coconut was calculated at Rs. 16 per nut. View evidence ↗
- When coconut was converted to copra, the total cost increased to Rs. 74,206. View evidence ↗
- Copra production showed negative returns of Rs. 21,923 over the total cost (C3). View evidence ↗
- The cost of production per quintal of copra was Rs. 15,958. View evidence ↗
What it means
- The authors concluded that labor, manure, pesticides, fertilizer, and irrigation are the most critical inputs, with labor having the most significant influence on productivity. View evidence ↗
- The study recommends that the government provide financial and technical assistance to coconut farmers. View evidence ↗
- Farmers face significant constraints including damage from the rhinoceros beetle and a lack of mechanization for harvesting and copra conversion. View evidence ↗
Visual summary
2 visualsIllustrations explain the paper; charts are replotted from the paper's own table values.
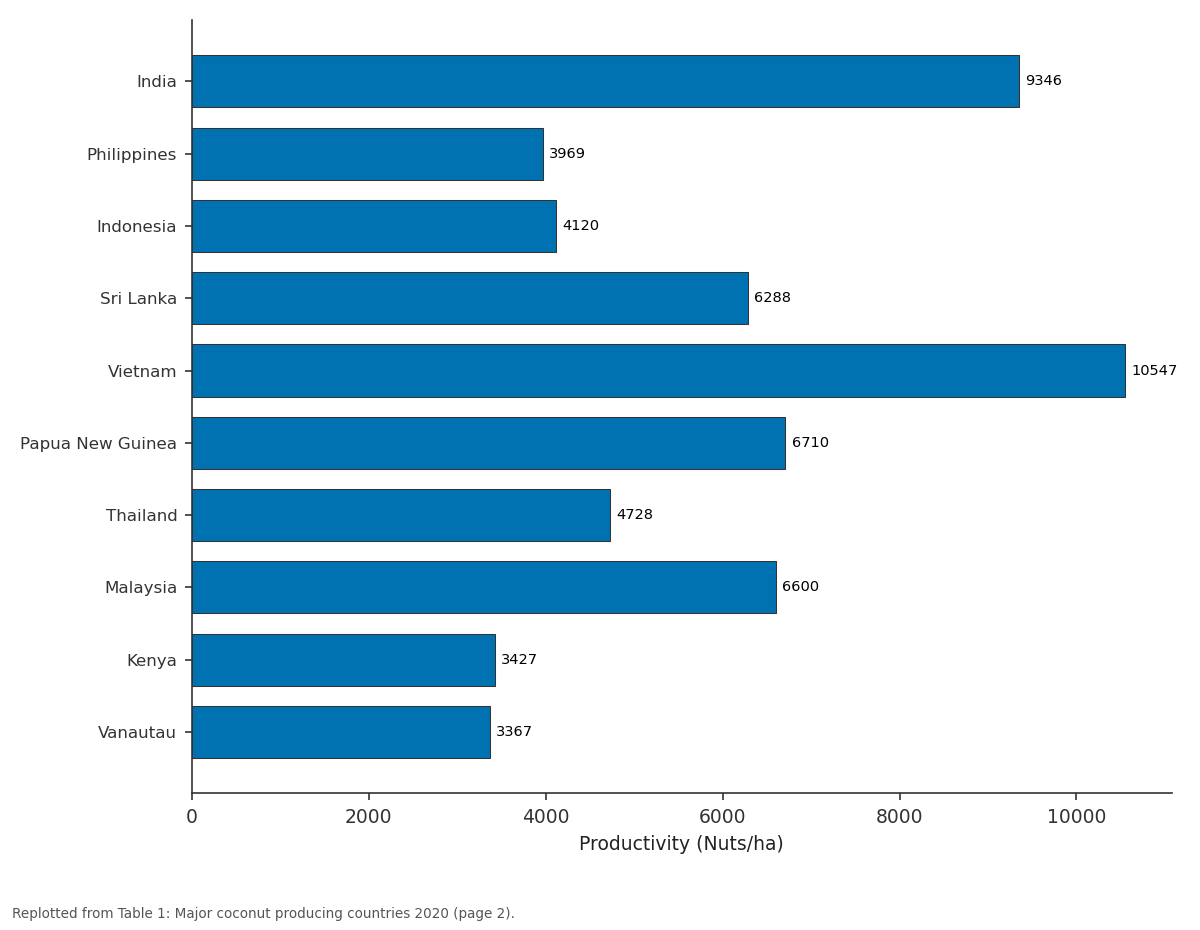
Productivity (Nuts/ha): India vs Philippines vs Indonesia vs Sri Lanka vs Vietnam
Replotted from Table 1 (page 2) of the original paper. Every bar is the paper's own table value.
View source evidence ↗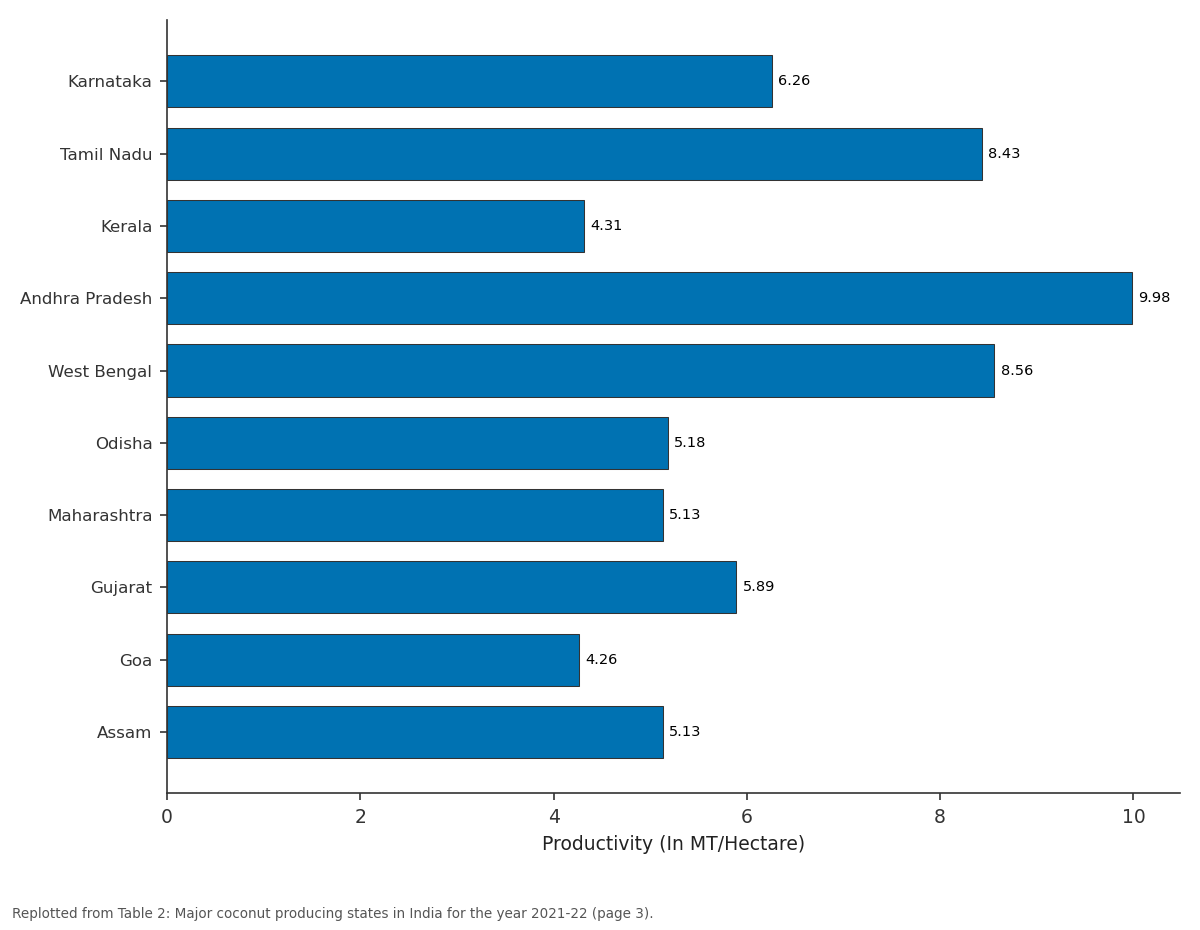
Productivity (In MT/Hectare): Karnataka vs Tamil Nadu vs Kerala vs Andhra Pradesh vs West Bengal
Replotted from Table 2 (page 3) of the original paper. Every bar is the paper's own table value.
View source evidence ↗Figures & tables
From the original paper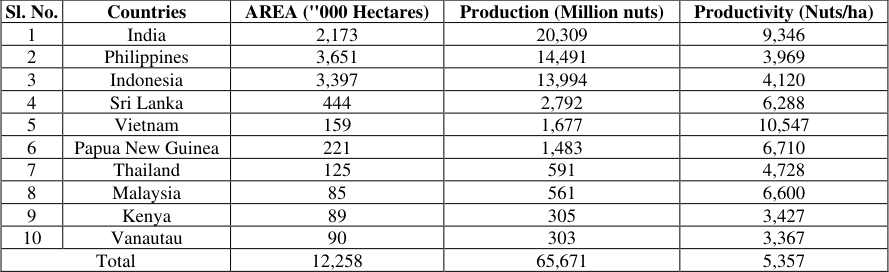 Table 1
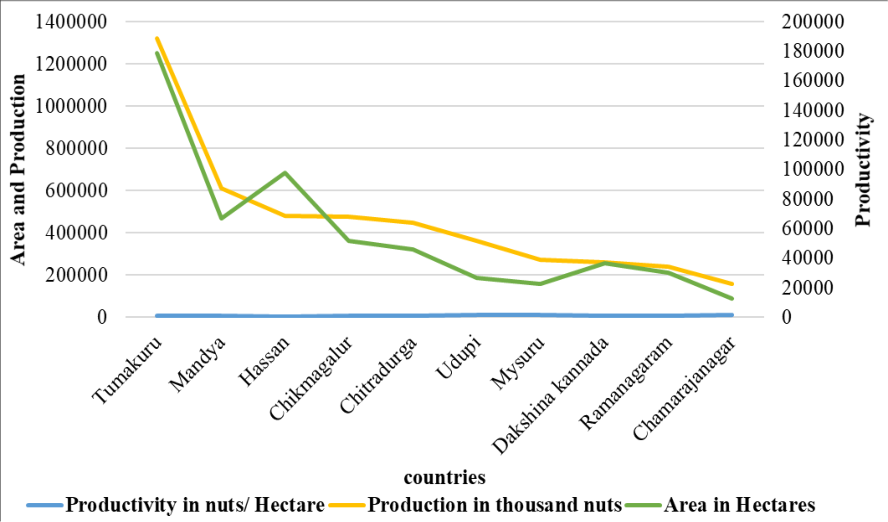 Figure 1
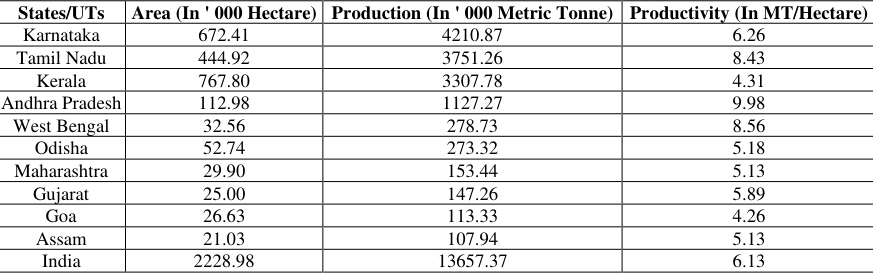 Table 2
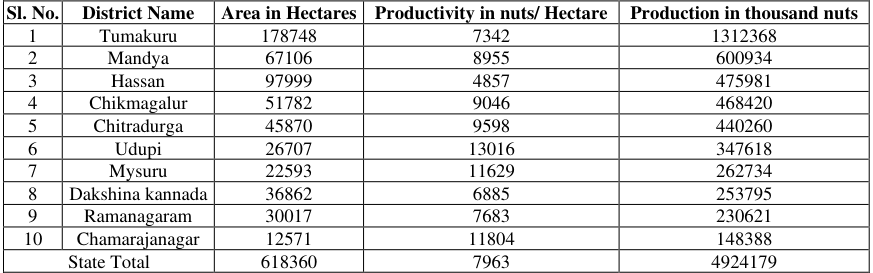 Table 3
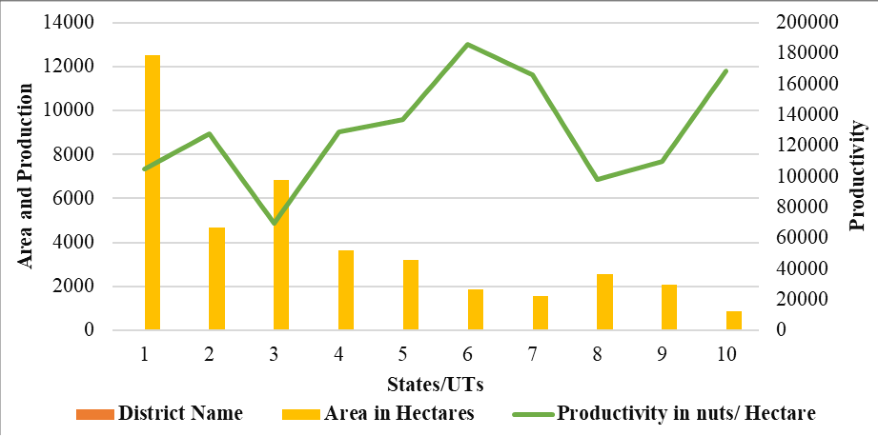 Figure 2
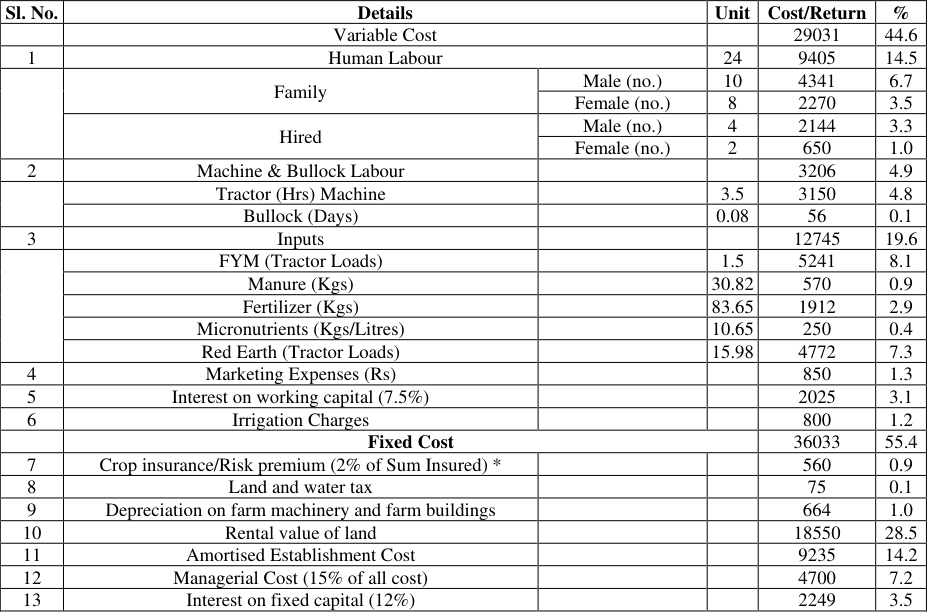 Table 4
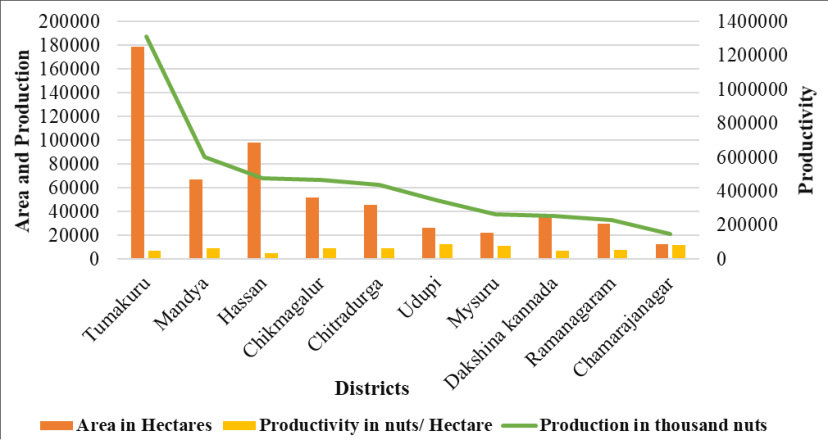 Figure 3
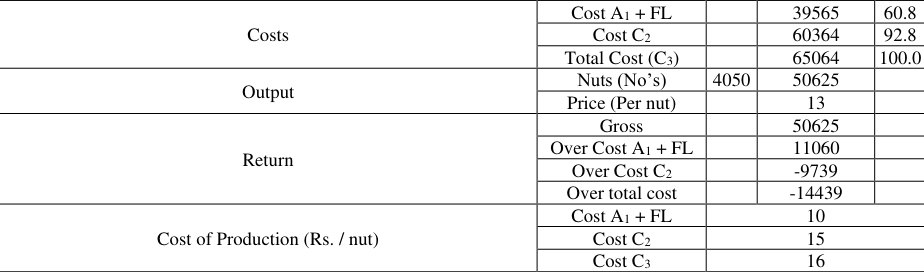 Table 5
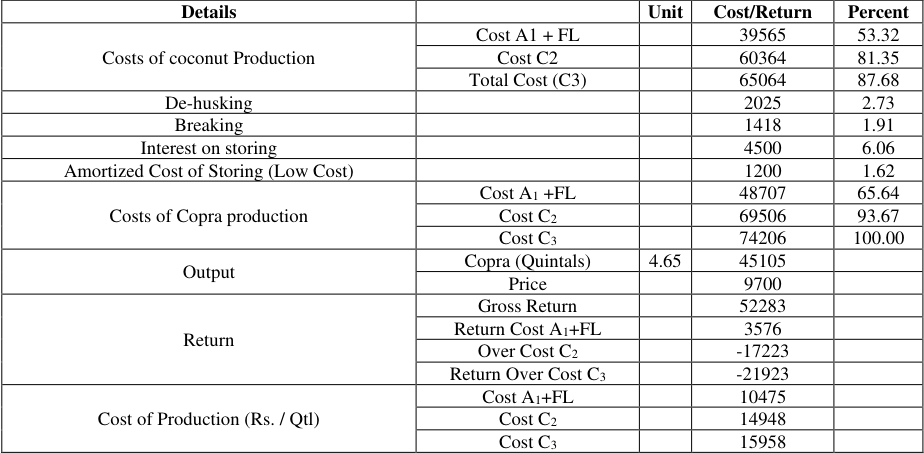 Table 5
Introduction
The coconut palm (Cocos nucifera) is found throughout the tropics, where it is interwoven into the lives of the local people. It is particularly important in the low islands of the Pacific where, in the absence of land-based natural resources, it provides almost all the necessities of life, food, drink, oil, medicine, fiber, timber, thatch, mats, fuel, and domestic utensils. For good reason, it has been called the "tree of heaven" and "tree of life." Today it remains an important economic and subsistence crop in many small Pacific Island states (Naik, 2019) [3] . All parts of the palm are used in some way or another in the daily life of the people of the west coast, the traditional coconut growing area. Its fruit is called Lakshmi-Phai and is used in social and religious functions in India irrespective of whether palm is locally grown or not. Each and every part of the coconut tree is useful to mankind. The coconut products like the wet kernel, desiccated copra, coconut water, cream flour, oil, cake, toddy, husk, fiber, shell, coir, wood, and leaves are used for one purpose or the other (Naik, 2019) [3] . In India, the coconut palm is referred to as 'Kalpavriksha'the 'tree of heaven' as each and every part of the palm is useful in one way or the other (Vinodhini et al., 2018) [4] . Ten million people in India depend on coconut for their livelihood either directly or indirectly. India ranks third in area and first in production of coconut in the world with producer of coconut 20309 million nuts from area of 2173 thousand hectares and productivity accounted with 9,346 nuts/hectares (Anon., 2019) [1] . Karnataka stands first position with an area of 672 thousand hectares, 4120 thousand tonnes with a productivity of 6.26 tonnes per hectares followed Tamil Nadu, Kerala, Andhra Pradesh, West Bengal, Odisha, Maharashtra, Gujarat, Goa and Assam [1] . Southern Karnataka accounted with total area of 618360 hectares with production of 7963 nut/hectares and productivity of 4924.18 thousand nuts. Tumakuru was highest production (1312.37 thousand nuts) and productivity (7342 nuts/ha.) followed by Mandya, Hassan, Chikmagalur, Chitradurga, Udupi, Mysuru, Dakshina Kannada, Ramanagara and Chamarajanagara [2] .
Materials and Methods
The study was conducted in the major southern districts of Karnataka pertaining to production and cultivation of coconut were Karnataka's southern districts contributes to highest area and productivity. Hence, these districts are purposively selected. Primary and secondary data were collected. Pertaining to the area, production and productivity of world, India and Southern districts of Karnataka secondary data was collected from Asian and Pacific Coconut Community (APCC) Statistical Year Book, Department of Horticulture, GoK and indiastat. Whereas, Primary data was collected from a total of 60 farmers to www.extensionjournal.com study cultivation practices and conversion of coconut to copra. The data was collected through personal interview during October 2020. The cost of cultivation of coconut included both variable cost and fixed costs. The variable cost comprises of costs incurred on variable inputs such as Farm Yard Manure (FYM)/ Neem cake, fertilizer, micronutrients, manure, red earth (tractor loads), dehusking, labour (human & tractor), irrigation charges, marketing expenses and interest on working capital. The fixed cost comprises non-cash items such as crop insurances/ risk premium, land and water tax, depreciation on farm machinery & farm building, rental value of land, amortized establishment cots, managerial cost and interest on fixed capital. Also, costs incurred by farmers on transportation, commission paid and weighment etc. were included in marketing expenses. Gross returns for coconut cultivation was computed by multiplying total physical quantity of produce with average price realized by sample respondents per unit quantity. Gross returns to crop cultivation was calculated over cost A1 + FL, C2 and cost C3. Costs involved in conversion of coconut into crop comprises of Breaking of coconut, de-husking & interest on storing and amortized cost of storing (low cost). Gross returns for coconut to copra conversion was computed by multiplying total physical quality of copra with average price realized by sample respondents per unit of copra. Gross returns to copra was calculated over cost A1 +FL, C2 and C3 were cost of production of copra computed as total cost divided by yield of copra was calculated over cost A1 +FL, C2 and C3.
Results and Discussion
Results and Discussion
Global scenario
Globally, the production of coconut in 2020 is about 65,671 million nuts with an area of 12,258 thousand hectares. India is largest producer of coconuts accounting for 20309 million nuts with an area of 2173 thousand hectares followed by Philippines, Indonesia, Sri Lanka, Vietnam, Papua New Guinea, Thailand, Malaysia, Kenya and Vanautau. By continent, coconut production has a large area in the Asian region reaching 53 million tons, followed by the American continent at 4.9 million tons, and Oceania at 2.1 million tons. While, if looked at the countries view several countries become the center of coconut plantations, because the coconut plant has several benefits, especially in terms of health, many countries are competing to cultivate this plant. Indian Scenario Among all the states, Karnataka stands first with an area of 672 thousand hectares, 4210 thousand tonnes with a productivity of 6.26 tonnes per hectare, followed by Tamil Nadu with an area of 444 thousand hectares, 3751 thousand tonnes and productivity of 8.43 tonnes per hectare, Kerala with an area of 767 thousand hectares, 3307 thousand tonnes nuts and productivity of 4.32 tonnes per hectare. These three states cover more than 80 percent of area and production to the country's total. The production in Karnataka has increased in 2021-22 due to increase in irrigation facilities in prominent growing districts of the state. The results were similar to the findings of Govindasamy (2018) [2] .
Scenario of Karnataka
In Karnataka, Tumakuru district accounts for the highest area and production with production of 1312368 thousand nuts from an area of 178748 hectares followed by Mandya, and Hassan these three districts contribute of about 48 percent of total production of the state. There is an increasing trend in production in state because good irrigation facilities and government schemes/ subsidies. The findings are inline with Naik (2019) [3] were labour had a greater influence on the productivity of coconut.
Conclusion
The coconut palm being a small land holder's plantation crop in Karnataka majorly growing in southern districts as the production, harvesting and conversion copra is done by farmers. There are various constraints mentioned when interviewed the farmers such as rhinoceros beetle which damages the coconut palms by boring into the crowns or tops of the tree where it damages growing tissues and feed on tree sap. There is no mechanization for harvesting, breaking, dehusking and conversion of copra. Hence, it suggests that yield of coconut & copra and returns to scale was decreasing. Thus, it may be concluded that among the significant variables, labor, manure, pesticides, fertilizer and irrigation were more important input resources for the growers in the study area. The variable "labor" had a greater influence on the productivity of coconut than all other variables. From the study it can also be suggested that Government should provide technical and financial assistances to these farmers.
Figures and tables from the paper
| Sl. No. | Countries | AREA (''000 Hectares) | Production (Million nuts) | Productivity (Nuts/ha) |
|---|---|---|---|---|
| 1 | India | 2,173 | 20,309 | 9,346 |
| 2 | Philippines | 3,651 | 14,491 | 3,969 |
| 3 | Indonesia | 3,397 | 13,994 | 4,120 |
| 4 | Sri Lanka | 444 | 2,792 | 6,288 |
| 5 | Vietnam | 159 | 1,677 | 10,547 |
| 6 | Papua New Guinea | 221 | 1,483 | 6,710 |
| 7 | Thailand | 125 | 591 | 4,728 |
| 8 | Malaysia | 85 | 561 | 6,600 |
| 9 | Kenya | 89 | 305 | 3,427 |
| 10 | Vanautau | 90 | 303 | 3,367 |
| Total | 12,258 | 65,671 | 5,357 |
Table text extracted from the original PDF; superscript letters are shown inline. The original table image is below.
View original table image
| States/UTs | Area (In ' 000 Hectare) | Production (In ' 000 Metric Tonne) | Productivity (In MT/Hectare) |
|---|---|---|---|
| Karnataka | 672.41 | 4210.87 | 6.26 |
| Tamil Nadu | 444.92 | 3751.26 | 8.43 |
| Kerala | 767.80 | 3307.78 | 4.31 |
| Andhra Pradesh | 112.98 | 1127.27 | 9.98 |
| West Bengal | 32.56 | 278.73 | 8.56 |
| Odisha | 52.74 | 273.32 | 5.18 |
| Maharashtra | 29.90 | 153.44 | 5.13 |
| Gujarat | 25.00 | 147.26 | 5.89 |
| Goa | 26.63 | 113.33 | 4.26 |
| Assam | 21.03 | 107.94 | 5.13 |
| India | 2228.98 | 13657.37 | 6.13 |
Table text extracted from the original PDF; superscript letters are shown inline. The original table image is below.
View original table image
| Sl. No. | District Name | Area in Hectares | Productivity in nuts/ Hectare | Production in thousand nuts |
|---|---|---|---|---|
| 1 | Tumakuru | 178748 | 7342 | 1312368 |
| 2 | Mandya | 67106 | 8955 | 600934 |
| 3 | Hassan | 97999 | 4857 | 475981 |
| 4 | Chikmagalur | 51782 | 9046 | 468420 |
| 5 | Chitradurga | 45870 | 9598 | 440260 |
| 6 | Udupi | 26707 | 13016 | 347618 |
| 7 | Mysuru | 22593 | 11629 | 262734 |
| 8 | Dakshina kannada | 36862 | 6885 | 253795 |
| 9 | Ramanagaram | 30017 | 7683 | 230621 |
| 10 | Chamarajanagar | 12571 | 11804 | 148388 |
| State Total | 618360 | 7963 | 4924179 |
Table text extracted from the original PDF; superscript letters are shown inline. The original table image is below.
View original table image
| Sl. No. | Details | — | Unit | Cost/Return | % |
|---|---|---|---|---|---|
| Variable Cost | 29031 | 44.6 | |||
| 1 | Human Labour | 24 | 9405 | 14.5 | |
| Family | Male (no.) | 10 | 4341 | 6.7 | |
| Female (no.) | 8 | 2270 | 3.5 | ||
| Hired | Male (no.) | 4 | 2144 | 3.3 | |
| Female (no.) | 2 | 650 | 1.0 | ||
| 2 | Machine & Bullock Labour | 3206 | 4.9 | ||
| Tractor (Hrs) Machine | 3.5 | 3150 | 4.8 | ||
| Bullock (Days) | 0.08 | 56 | 0.1 | ||
| 3 | Inputs | 12745 | 19.6 | ||
| FYM (Tractor Loads) | 1.5 | 5241 | 8.1 | ||
| Manure (Kgs) | 30.82 | 570 | 0.9 | ||
| Fertilizer (Kgs) | 83.65 | 1912 | 2.9 | ||
| Micronutrients (Kgs/Litres) | 10.65 | 250 | 0.4 | ||
| Red Earth (Tractor Loads) | 15.98 | 4772 | 7.3 | ||
| 4 | Marketing Expenses (Rs) | 850 | 1.3 | ||
| 5 | Interest on working capital (7.5%) | 2025 | 3.1 | ||
| 6 | Irrigation Charges | 800 | 1.2 | ||
| Fixed Cost | 36033 | 55.4 | |||
| 7 | Crop insurance/Risk premium (2% of Sum Insured) * | 560 | 0.9 | ||
| 8 | Land and water tax | 75 | 0.1 | ||
| 9 | Depreciation on farm machinery and farm buildings | 664 | 1.0 | ||
| 10 | Rental value of land | 18550 | 28.5 | ||
| 11 | Amortised Establishment Cost | 9235 | 14.2 | ||
| 12 | Managerial Cost (15% of all cost) | 4700 | 7.2 | ||
| 13 | Interest on fixed capital (12%) | 2249 | 3.5 |
Table text extracted from the original PDF; superscript letters are shown inline. The original table image is below.
View original table image
| Costs | Cost A1 + FL | — | 39565 | 60.8 |
|---|---|---|---|---|
| Cost C2 | 60364 | 92.8 | ||
| Total Cost (C3) | 65064 | 100.0 | ||
| Output | Nuts (No’s) | 4050 | 50625 | |
| Price (Per nut) | 13 | |||
| Return | Gross | 50625 | ||
| Over Cost A1 + FL | 11060 | |||
| Over Cost C2 | -9739 | |||
| Over total cost | -14439 | |||
| Cost of Production (Rs. / nut) | Cost A1 + FL | 10 | ||
| Cost C2 | 15 | |||
| Cost C3 | 16 |
Table text extracted from the original PDF; superscript letters are shown inline. The original table image is below.
View original table image
| Details | — | Unit | Cost/Return | Percent |
|---|---|---|---|---|
| Costs of coconut Production | Cost A1 + FL | 39565 | 53.32 | |
| Cost C2 | 60364 | 81.35 | ||
| Total Cost (C3) | 65064 | 87.68 | ||
| De-husking | 2025 | 2.73 | ||
| Breaking | 1418 | 1.91 | ||
| Interest on storing | 4500 | 6.06 | ||
| Amortized Cost of Storing (Low Cost) | 1200 | 1.62 | ||
| Costs of Copra production | Cost A1 +FL | 48707 | 65.64 | |
| Cost C2 | 69506 | 93.67 | ||
| Cost C3 | 74206 | 100.00 | ||
| Output | Copra (Quintals) | 4.65 | 45105 | |
| Price | 9700 | |||
| Return | Gross Return | 52283 | ||
| Return Cost A1+FL | 3576 | |||
| Over Cost C2 | -17223 | |||
| Return Over Cost C3 | -21923 | |||
| Cost of Production (Rs. / Qtl) | Cost A1+FL | 10475 | ||
| Cost C2 | 14948 | |||
| Cost C3 | 15958 |
Table text extracted from the original PDF; superscript letters are shown inline. The original table image is below.
View original table image
References
4 in the original paper- Anonymous. Statistical Year Book. Asian and Pacific Coconut Community (APCC). 2019:35-40. Available from: https://www.indiastat.com/coconut/2021-22.
- Govindasamy R. A Study on Production of Coconut in Coimbatore District, Tamilnadu. Shanlax Int. J Econ. 2018;7(1):27-35.
- Naik JN. Cost of Coconut Cultivation -Farmer Groups wise in East Godavari District. Int. J Econ Manage Stud. 2019;6(10):136-142.
- Vinodhini C, Deshmukh KV, Ajay Kumar Srivastava. Economic Analysis of Coconut Marketing and Constraints in Coconut Cultivation with Special Reference to Karur District of Tamil Nadu, India. Int. J Curr Microbiol Appl. Sci. 2018;7(10):2505-2512. Available from: https://horticulturedir.karnataka.gov.in/english.