
Research article · 2024 · Full text
International Journal of Advanced Biochemistry ResearchStatistical effect of irrigation levels and weeds management in wheat (Triticum aestivum L.) in Northern-Hill zone of (Chhattisgarh)
Volume 8(3S) · Pages 729–738 · DOI: 10.33545/26174693.2024.v8.i3sj.870 ↗
Research areasAgricultural Economics and PracticesRice Cultivation and Yield ImprovementAgricultural Science and Fertilization
Abstract
Author-writtenA field experiment was carried out for two consecutive years in rabi seasons of 2017-18 and 2018-19 at Research Cum Instructional Farm, IGKV, Lt. Dr. Ramchanra Singh Dev College of Agriculture and Research Station, Baikunthpur, Korea, Chhattisgarh. The soil of experimental field was Vertisols, neutral in reaction, low in available nitrogen, and medium in available phosphorus and high in available potassium. The experiment was laid out in Split Plot Design with three replications. The main plot treatment consisted of 03 Irrigation levels I1: 0.8 IW/ CPE, I2: 1.0 IW/ CPE, I3: 1.2 IW/ CPE and Sub-plot treatment consisted of 06 Weed management i.e. W1: Sulfosulfuran (20 g ha-1), W2: Clodinofop (60 g ha-1), W3: Metsufuron (4 g ha-1), W4: Clodinofop + Metsulfuran (60 g + 4 g ha-1), W5: Sulfosulfuran + Metsulfuran (20 g + 4 g ha-1), W6: Unweeded Control. The finding revealed that the irrigation in wheat at I3: 1.2 IW/CPE recorded significantly highest grain and straw yields under this treatment. As regards to weed management practices in wheat, treatment W4: Clodinofop + metsulfuron (60 g+4 g ha-1) registered significantly highest yield attributes and grain and straw yields and harvest index as compared to others. Total weed density and weed dry weight recorded at 40 and 80 DAS during both the years. The effect of different irrigation levels was non- significant affect on total weed density and weed dry weight of wheat. It was observed that weed density and weed dry matter were low in case of I1: 0.8 IW / CPE irrigation level. The treatment I3: 1.2 IW/ CPE irrigation level recorded maximum weed density and weed dry weight due to availability of more water for germination of weed seeds present on the top of the soil. The increase in density and dry weight weeds to such an irrigation level under treatment I3: 1.2 IW/ CPE might be attributed to uninterrupted growth of weeds throughout the crop season and more competitive nature than crop up to the harvest. Heavy weed infestation and dry weight under unweeded control have also been reported by many scientists such as Singh and Singh (2005), Hari et al. (2006), and Koli (2006).
Summary
Source-checkedPlain-language reading of the full paper, prepared with AI and checked against the text. Each point links to the authors' own words.
Why it matters
- Wheat is a globally critical cereal crop, with a worldwide production of 713 million tonnes across approximately 217 million hectares. View evidence ↗
- Weed populations significantly hinder crop productivity by competing with the crop for essential resources like light, space, nutrients, and moisture. View evidence ↗
- Chemical weed control is becoming more popular than hand weeding, which is often too costly and tedious due to labor shortages during peak periods. View evidence ↗
The question
- The study aimed to evaluate the statistical effects of different irrigation levels and weed management practices on wheat in the Northern-Hill zone of Chhattisgarh. View evidence ↗
What they did
- The field experiment was conducted over two consecutive rabi seasons (2017-18 and 2018-19) in Baikunthpur, Korea, Chhattisgarh. View evidence ↗
- Using a split-plot design with three replications, the researchers tested three irrigation levels (0.8, 1.0, and 1.2 IW/CPE) and six weed management treatments, including various herbicides and an unweeded control. View evidence ↗
- The study used the wheat variety GW-366, sown in late November for both experimental years. View evidence ↗
What they found
- The highest grain and straw yields were significantly recorded under the highest irrigation level (I3: 1.2 IW/CPE). View evidence ↗
- Among weed management options, the combination of Clodinofop and Metsulfuron (W4: 60 g + 4 g ha-1) resulted in significantly higher grain and straw yields, yield attributes, and harvest index. View evidence ↗
- Higher irrigation levels (I3: 1.2 IW/CPE) led to the maximum weed density and dry weight, as more water was available for weed seed germination. View evidence ↗
- The lowest total density of grassy weeds was significantly achieved with W4 (Clodinofop + Metsulfuron), though it performed similarly to W5 and W1 at 80 days after sowing (DAS). View evidence ↗
- The weed index showed that the lowest irrigation level (I1: 0.8 IW/CPE) caused the highest yield reduction, while the highest level (I3: 1.2 IW/CPE) caused the least. View evidence ↗
- The minimum yield reduction due to weeds was registered under the W4 treatment (Clodinofop + Metsulfuron). View evidence ↗
- The combination of the lowest irrigation level (I1) and no weed control (W6) resulted in the most significant yield reduction. View evidence ↗
What it means
- The authors conclude that combining appropriate irrigation techniques with effective herbicide treatments is essential to reduce weed competition and increase wheat productivity. View evidence ↗
- The authors recommend the use of Clodinofop + Metsulfuron (W4) for its superior efficiency in reducing weed density and dry matter. View evidence ↗
Visual summary
3 visualsIllustrations explain the paper; charts are replotted from the paper's own table values.
Irrigation Trade-off
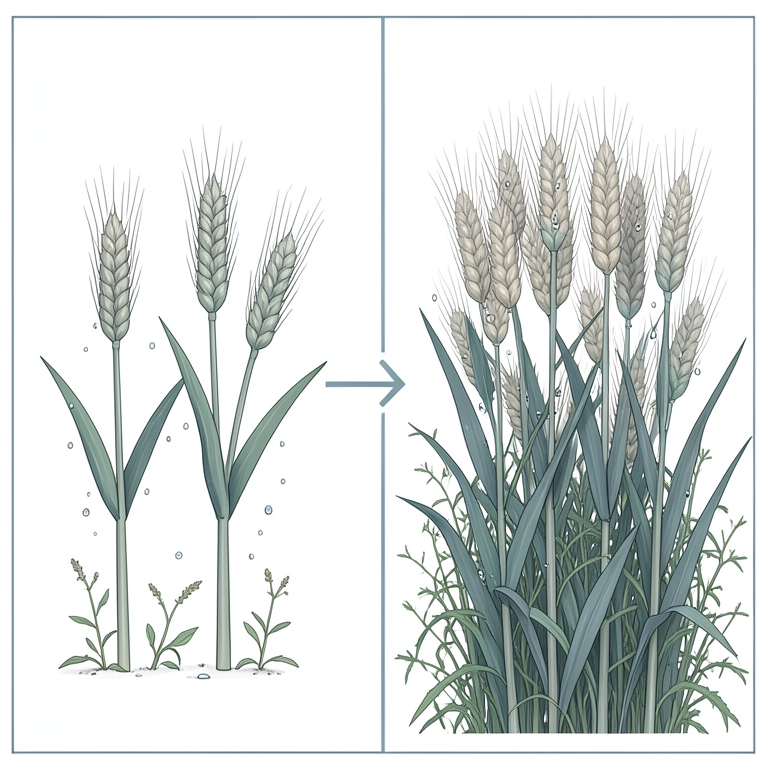
AI-generated conceptual illustration (wheat plants (Triticum aestivum L.) and common field weeds). It explains the idea and does not show study data.
View source evidence ↗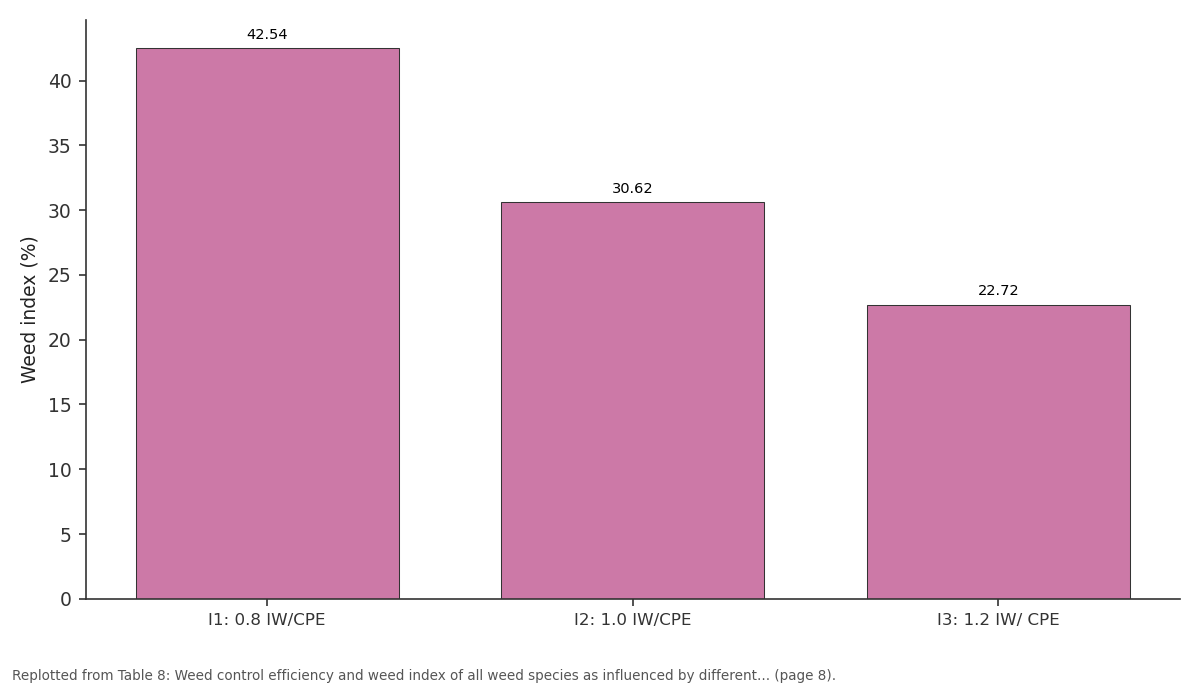
2018-19: I1: 0.8 IW/CPE vs I2: 1.0 IW/CPE vs I3: 1.2 IW/ CPE
Replotted from Table 8 (page 8) of the original paper. Every bar is the paper's own table value.
View source evidence ↗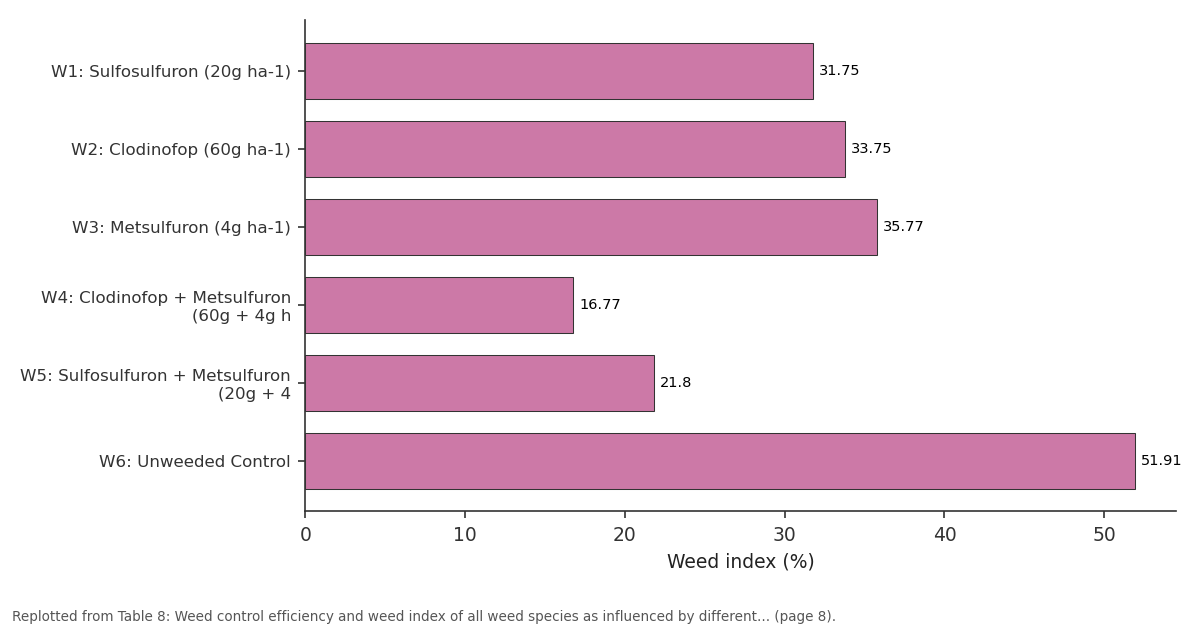
2018-19: W1: Sulfosulfuron (20g... vs W2: Clodinofop (60g... vs W3: Metsulfuron (4g... vs W4: Clodinofop +... vs W5: Sulfosulfuron +...
Replotted from Table 8 (page 8) of the original paper. Every bar is the paper's own table value.
View source evidence ↗Figures & tables
From the original paper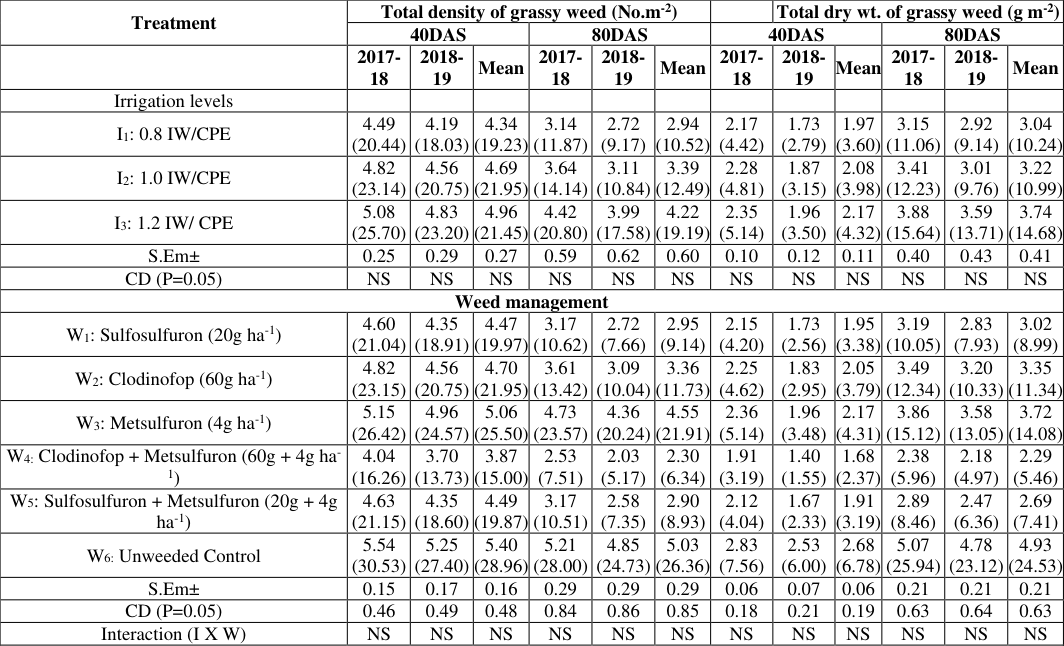 Table 1
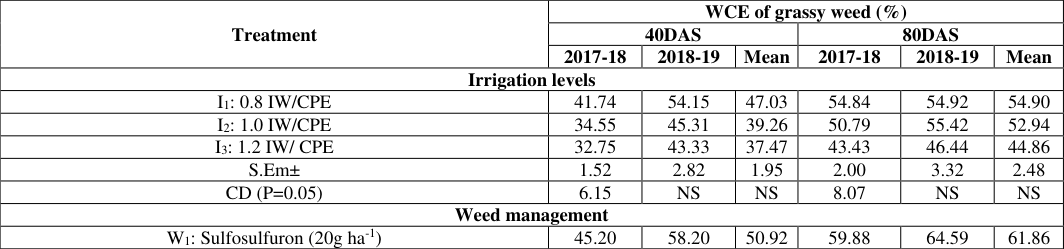 Table 2
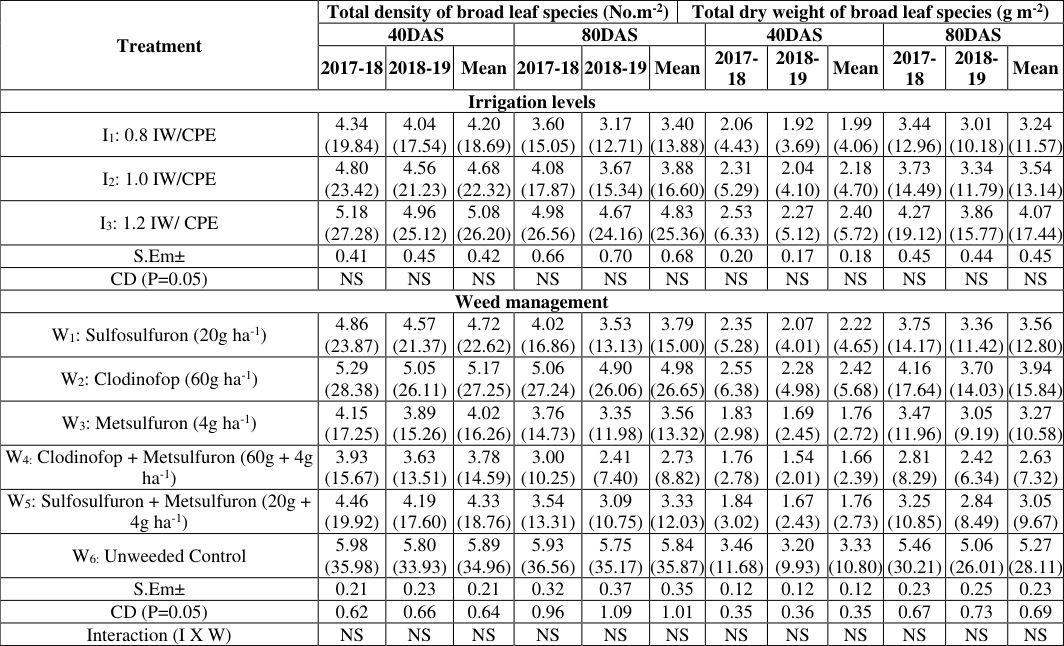 Table 3
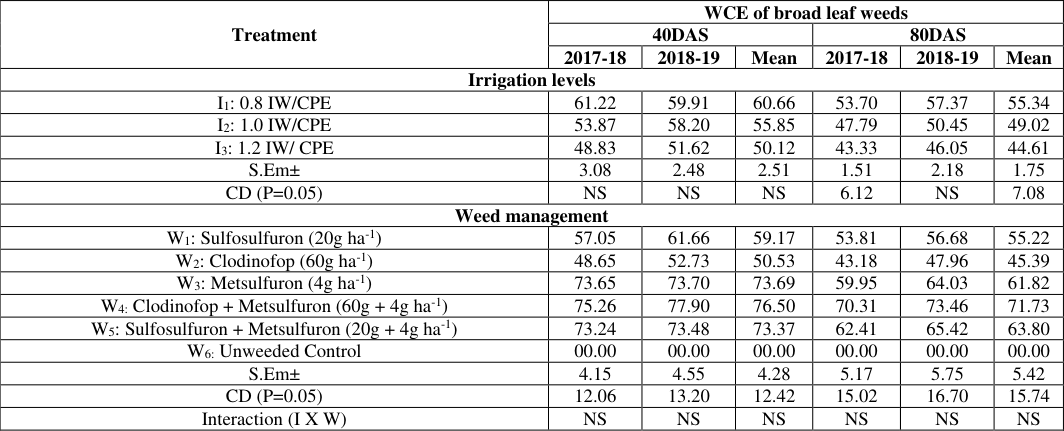 Table 4
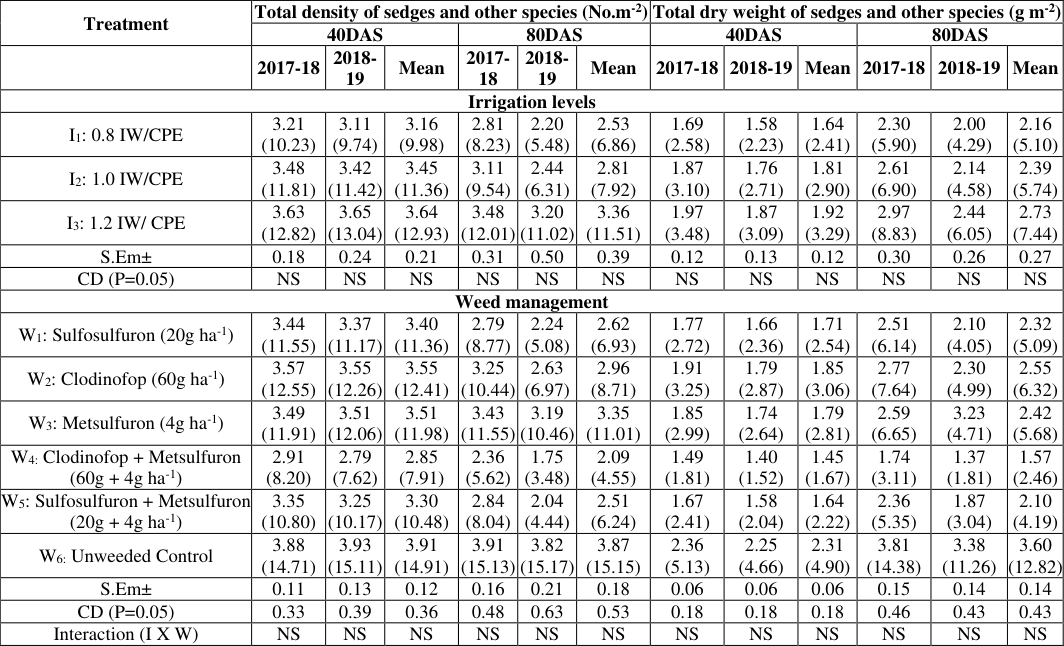 Table 5
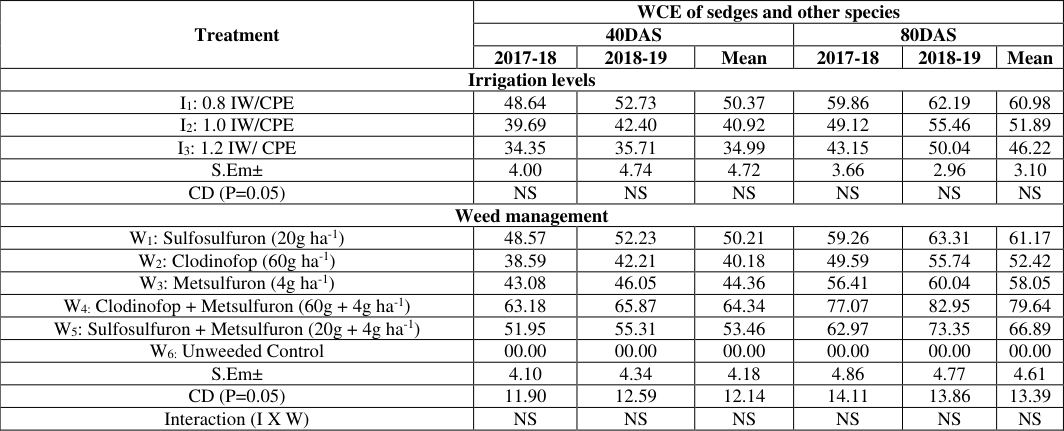 Table 6
 Table 7
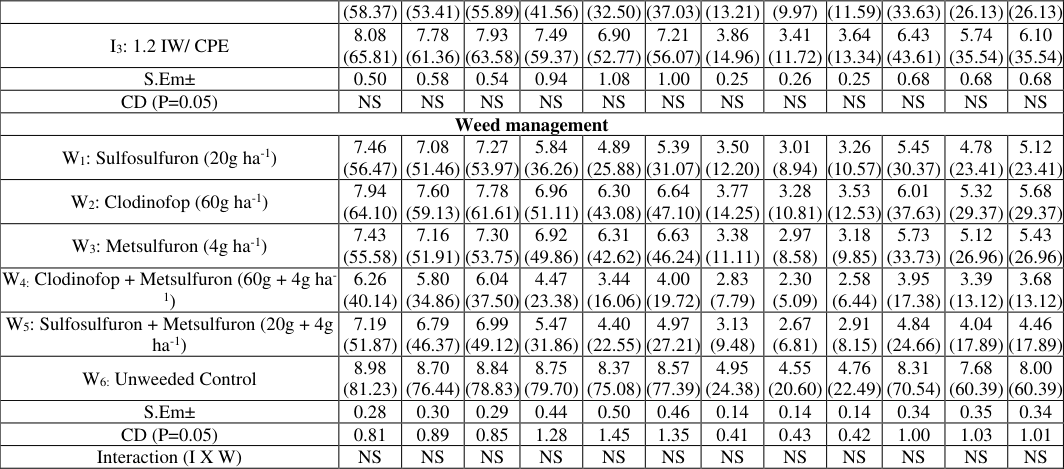 Table 8
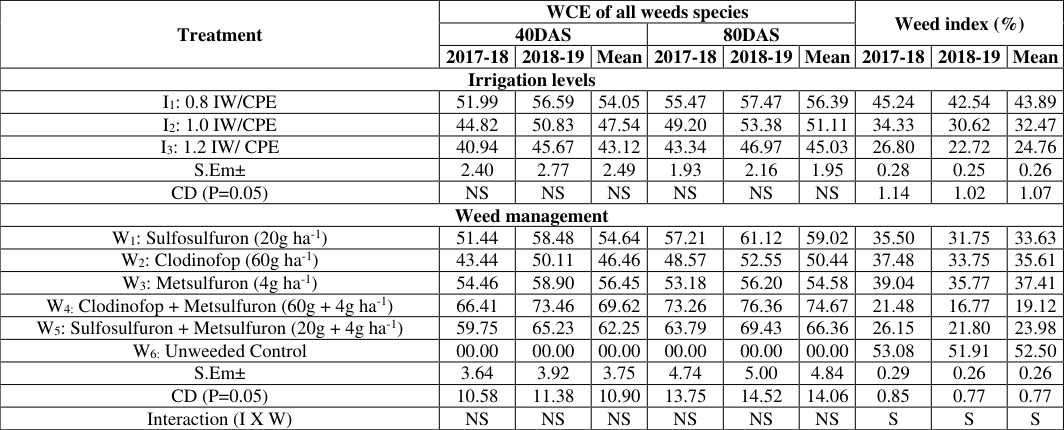 Table 8
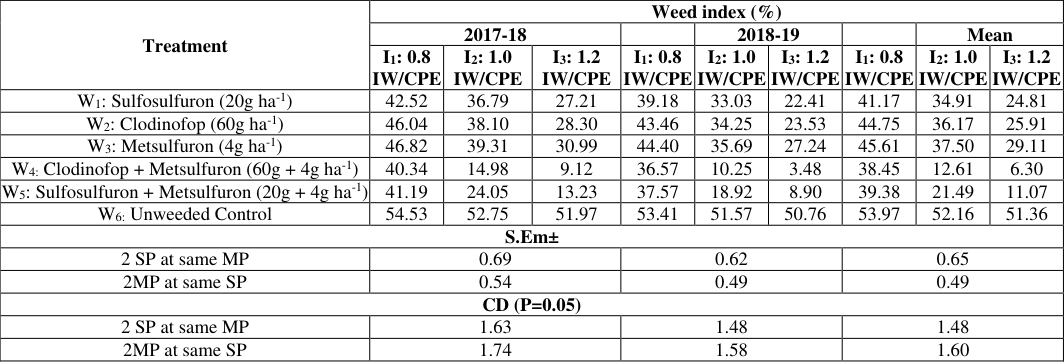 Table 9
Introduction
Wheat is one of the most important cereal crops of the world occupying around 217million hectares holding with a production of 713 million tonnes and productivity of 3371 kg ha -1 . Nearly 55 percent of the world population depends on wheat for about 20 percent of calories intake. India is second largest producer of wheat in the world after China with about 12 percent share in total world production. In India, wheat is second most important food crop, next to rice, with an area of 31.62 million hectares and production of 109.52 million tons (Anonymous, 2021) [1] . The diverse environmental conditions and food habits of people in India supports the cultivation of three types of wheat (bread, durum and dicoccum). Among these, bread wheat is contributing approximately 95 percent to total production. The average productivity is 3.5 t ha -1 . In Chhattisgarh, wheat is cultivated in an area of 3.6 million hectare with the productivity of the state ranging between 1.2 to 1.6 t ha -1 depending upon the rainfal. In the Northern-Hills Zone of Chhattisgarh especially Baikunthpur, Surajpur, Ambikapur and other districts wheat is a major cereal crop of Rabi season in rice based cropping system under irrigated condition and maximum farmers grow wheat crop after harvesting of rice in midland condition. Weed population is one of the major barriers, responsible for low productivity of crop because, weed compete with the crop for moisture, nutrients, space, light etc.
In wheat crop, studies revealed that weeds causes up to 90 percent failure of the crop. The presence of weeds like Phalaris minor, Circium spp., Avena spp., Cynodandactylon, Convolvulus spp., etc. when becomes serious causes advance effect as production in a number of ways. Weeds compete with crop species for water, nutrients and light and ultimately reduce crop yield. Chemical weed control method is popularizing day by day among the farmers because weed control through hand weeding is time consuming and tedious and become very costly due to unavailability of labor in peak period and high labor charges due to shifting of agricultural labor to industries for better and assured wages. At present, some broad spectrum new herbicides requiring in low quantity are available for weed control in wheat. The attributes of high level herbicides activity, application flexibility, excellent crop tolerance and low level of flexibility exhibited by these compounds are important characteristics of modern agriculture chemicals. Metsulfuron methyl has great importance to paralyze the weed by inhibiting acelolactate synthase (ALS) mechanization and give excellent control of weed in wheat. The recent advances in weed management showed that single application of chemical may not cover the entire weed flora, But if the mixture of two herbicides is used the total flora can be managed. Therefore, it is important to control weed to minimize the competition between weeds and the crop.
Materials and Methods
The climate of Korea district is basically tropical wet and dry. The temperature of Korea district remains moderate throughout the year, except from March to June, in this month temperature remains extremely hot. The maximum weekly temperature of Korea district goes up to 45.2 °C in the month of May. While, minimum temperature falls up to 9 °C in the month of January. Winters starts from November to January and are mild. The average annual rainfall varies between 1200-1400 mm, which is mostly received during a span of four months i.e. between June to September through south-western monsoon. The wheat variety GW-366 was sown as test crop during 27th November, 2017-18 and 30 th November 2018-19. Harvesting was done during 18 th April in the first year (2018) and 20 th April in the second year (2019), respectively.
Studies of weed
The weed samples were collected with the help of quadrate (1m 2 ) at 40 and 80 DAS.
Associated weeds in the experimental field were recorded at 40 and 80 DAS. Total weed and species-wise count were made from randomly selected three quadrates 50 cm x 50 cm (0.25 m 2 ) in each plot. Number of weeds was counted and the data so obtained were computed on m -2 basis for statistical analysis, Weed density data was then subjected to square root transformation i.e √X + 0.5.
Associated weeds in the experimental field were recorded at 40 and 80 DAS. Weeds present in quadrate 50 cm x 50 cm (0.25 m 2 ) were uprooted along with root. Root portion was deleted and shoot portion of weed was oven dried at 60 °C for 48 hours. After drying, species-wise and total dry matter production was weighed in electronic balance and converted into gm -2 using factor. Dry matter of weeds was then subjected to square root transformation i.e. √X + 0.5. It is expressed in gm -2 .
The weed control efficiency (%) of different treatment was calculated at 40 and 80 DAS stage on dry matter production basis with help of following formula.
Where, DMC = Dry matter production of weeds per unit area in control DMT = Dry matter production of weeds per unit area in the treated plot
The weed index (%) of different treatments was calculated at harvest stage with the help of following formula.
Where, X = Gain yield of weed free plot Y = Gain yield of treated plot
Results and Discussion
Total density of grassy weeds (No. m -2 )
The data on total density of grassy weeds recorded at 40 and 80 DAS as influenced by irrigation levels and weed management practices in wheat are presented in Table 1.
| Treatment | Total density of grassy weed (No.m-2) | — | — | — | — | — | — | Total dry wt. of grassy weed (g m-2) | — | — | — | — |
|---|---|---|---|---|---|---|---|---|---|---|---|---|
| 40DAS | 80DAS | 40DAS | 80DAS | |||||||||
| 2017- 18 | 2018- 19 | Mean | 2017- 18 | 2018- 19 | Mean | 2017- 18 | 2018- 19 | Mean | 2017- 18 | 2018- 19 | Mean | |
| Irrigation levels | ||||||||||||
| I1: 0.8 IW/CPE | 4.49 (20.44) | 4.19 (18.03) | 4.34 (19.23) | 3.14 (11.87) | 2.72 (9.17) | 2.94 (10.52) | 2.17 (4.42) | 1.73 (2.79) | 1.97 (3.60) | 3.15 (11.06) | 2.92 (9.14) | 3.04 (10.24) |
| I2: 1.0 IW/CPE | 4.82 (23.14) | 4.56 (20.75) | 4.69 (21.95) | 3.64 (14.14) | 3.11 (10.84) | 3.39 (12.49) | 2.28 (4.81) | 1.87 (3.15) | 2.08 (3.98) | 3.41 (12.23) | 3.01 (9.76) | 3.22 (10.99) |
| I3: 1.2 IW/ CPE | 5.08 (25.70) | 4.83 (23.20) | 4.96 (21.45) | 4.42 (20.80) | 3.99 (17.58) | 4.22 (19.19) | 2.35 (5.14) | 1.96 (3.50) | 2.17 (4.32) | 3.88 (15.64) | 3.59 (13.71) | 3.74 (14.68) |
| S.Em± | 0.25 | 0.29 | 0.27 | 0.59 | 0.62 | 0.60 | 0.10 | 0.12 | 0.11 | 0.40 | 0.43 | 0.41 |
| CD (P=0.05) | NS | NS | NS | NS | NS | NS | NS | NS | NS | NS | NS | NS |
| Weed management | ||||||||||||
| W1: Sulfosulfuron (20g ha-1) | 4.60 (21.04) | 4.35 (18.91) | 4.47 (19.97) | 3.17 (10.62) | 2.72 (7.66) | 2.95 (9.14) | 2.15 (4.20) | 1.73 (2.56) | 1.95 (3.38) | 3.19 (10.05) | 2.83 (7.93) | 3.02 (8.99) |
| W2: Clodinofop (60g ha-1) | 4.82 (23.15) | 4.56 (20.75) | 4.70 (21.95) | 3.61 (13.42) | 3.09 (10.04) | 3.36 (11.73) | 2.25 (4.62) | 1.83 (2.95) | 2.05 (3.79) | 3.49 (12.34) | 3.20 (10.33) | 3.35 (11.34) |
| W3: Metsulfuron (4g ha-1) | 5.15 (26.42) | 4.96 (24.57) | 5.06 (25.50) | 4.73 (23.57) | 4.36 (20.24) | 4.55 (21.91) | 2.36 (5.14) | 1.96 (3.48) | 2.17 (4.31) | 3.86 (15.12) | 3.58 (13.05) | 3.72 (14.08) |
| W4: Clodinofop + Metsulfuron (60g + 4g ha- 1) | 4.04 (16.26) | 3.70 (13.73) | 3.87 (15.00) | 2.53 (7.51) | 2.03 (5.17) | 2.30 (6.34) | 1.91 (3.19) | 1.40 (1.55) | 1.68 (2.37) | 2.38 (5.96) | 2.18 (4.97) | 2.29 (5.46) |
| W5: Sulfosulfuron + Metsulfuron (20g + 4g ha-1) | 4.63 (21.15) | 4.35 (18.60) | 4.49 (19.87) | 3.17 (10.51) | 2.58 (7.35) | 2.90 (8.93) | 2.12 (4.04) | 1.67 (2.33) | 1.91 (3.19) | 2.89 (8.46) | 2.47 (6.36) | 2.69 (7.41) |
| W6: Unweeded Control | 5.54 (30.53) | 5.25 (27.40) | 5.40 (28.96) | 5.21 (28.00) | 4.85 (24.73) | 5.03 (26.36) | 2.83 (7.56) | 2.53 (6.00) | 2.68 (6.78) | 5.07 (25.94) | 4.78 (23.12) | 4.93 (24.53) |
| S.Em± | 0.15 | 0.17 | 0.16 | 0.29 | 0.29 | 0.29 | 0.06 | 0.07 | 0.06 | 0.21 | 0.21 | 0.21 |
| CD (P=0.05) | 0.46 | 0.49 | 0.48 | 0.84 | 0.86 | 0.85 | 0.18 | 0.21 | 0.19 | 0.63 | 0.64 | 0.63 |
| Interaction (I X W) | NS | NS | NS | NS | NS | NS | NS | NS | NS | NS | NS | NS |
Table text extracted from the original PDF; superscript letters are shown inline. The original table image is below.
View original table image
Among the irrigation levels in wheat, at 40 and 80 DAS, did not have significant effect on total density of grassy weeds during both the years and on mean basis. However, the lowest total density of grassy weeds was noted under I1: 0.8 IW/CPE and highest that was recorded under I 3 : 1.2 IW/CPE during both the years and on mean basis. As regards to weed management practices in wheat, at 40 and 80 DAS, significantly lowest total density of grassy weeds was registered under W 4 : clodinofop + metsulfuron (60g+4g ha -1 ) but, it was found at par to treatment W 5 : sulfosulfuron + metsulfuron (20g + 4g ha -1 ) and W 1 : sulfosulfuron (20g ha -1 ) at 80 DAS during both the years and on mean basis. The highest density was recorded under W 6: unweeded control during both the years and on mean basis.
The results revealed that interaction effect of irrigation levels and weed management practices remained unaffected with respect to total density of grassy weeds at 40 and 80 DAS during both the years and on mean basis.
Regarding data on total dry weight of grassy weeds recorded at 40 and 80 DAS as influenced by irrigation levels and weed management practices in wheat are presented in Table 1.
Among the irrigation levels in wheat, at 40 and 80 DAS, did not have significant effect on total dry weight of grassy weeds during both the years and on mean basis. However, the lowest dry weight was noted under I1: 0.8 IW/CPE and the highest were recorded under I 3 : 1.2 IW/CPE during both the years and on mean basis. As regard to weed management practices in wheat, at 40 and 80 DAS, significantly the lowest total dry weight of grassy weeds was registered under W 4 : clodinofop + metsulfuron (60g+4g ha -1 ) however, it was found comparable to treatment W 5 : sulfosulfuron + metsulfuron (20g + 4g ha -1 ) at 80 DAS during both the years and on mean basis. The highest dry weight was recorded under W 6: unweeded control during both the years and on mean basis. The interaction effect between irrigation levels and weed management practices on total dry weight of grassy weeds remained unaffected at 40 and 80 DAS during both the years and on mean basis.
The data on weed control efficiency of grassy weeds at 40 and 80 DAS are presented in The data pertaining to total density of broad leaf weeds at 40 and 80 DAS as influenced by irrigation levels and weed management practices in wheat during both the years and on mean basis are given in Table 3.
| Treatment | Total density of broad leaf species (No.m-2) | — | — | — | — | — | Total dry weight of broad leaf species (g m-2) | — | — | — | — | — | — |
|---|---|---|---|---|---|---|---|---|---|---|---|---|---|
| 40DAS | 80DAS | 40DAS | 80DAS | ||||||||||
| 2017-18 | 2018-19 | Mean | 2017-18 | 2018-19 | Mean | 2017- 18 | 2018- 19 | Mean | 2017- 18 | 2018- 19 | Mean | ||
| Irrigation levels | |||||||||||||
| I1: 0.8 IW/CPE | 4.34 (19.84) | 4.04 (17.54) | 4.20 (18.69) | 3.60 (15.05) | 3.17 (12.71) | 3.40 (13.88) | 2.06 (4.43) | 1.92 (3.69) | 1.99 (4.06) | 3.44 (12.96) | 3.01 (10.18) | 3.24 (11.57) | |
| I2: 1.0 IW/CPE | 4.80 (23.42) | 4.56 (21.23) | 4.68 (22.32) | 4.08 (17.87) | 3.67 (15.34) | 3.88 (16.60) | 2.31 (5.29) | 2.04 (4.10) | 2.18 (4.70) | 3.73 (14.49) | 3.34 (11.79) | 3.54 (13.14) | |
| I3: 1.2 IW/ CPE | 5.18 (27.28) | 4.96 (25.12) | 5.08 (26.20) | 4.98 (26.56) | 4.67 (24.16) | 4.83 (25.36) | 2.53 (6.33) | 2.27 (5.12) | 2.40 (5.72) | 4.27 (19.12) | 3.86 (15.77) | 4.07 (17.44) | |
| S.Em± | 0.41 | 0.45 | 0.42 | 0.66 | 0.70 | 0.68 | 0.20 | 0.17 | 0.18 | 0.45 | 0.44 | 0.45 | |
| CD (P=0.05) | NS | NS | NS | NS | NS | NS | NS | NS | NS | NS | NS | NS | |
| Weed management | |||||||||||||
| W1: Sulfosulfuron (20g ha-1) | 4.86 (23.87) | 4.57 (21.37) | 4.72 (22.62) | 4.02 (16.86) | 3.53 (13.13) | 3.79 (15.00) | 2.35 (5.28) | 2.07 (4.01) | 2.22 (4.65) | 3.75 (14.17) | 3.36 (11.42) | 3.56 (12.80) | |
| W2: Clodinofop (60g ha-1) | 5.29 (28.38) | 5.05 (26.11) | 5.17 (27.25) | 5.06 (27.24) | 4.90 (26.06) | 4.98 (26.65) | 2.55 (6.38) | 2.28 (4.98) | 2.42 (5.68) | 4.16 (17.64) | 3.70 (14.03) | 3.94 (15.84) | |
| W3: Metsulfuron (4g ha-1) | 4.15 (17.25) | 3.89 (15.26) | 4.02 (16.26) | 3.76 (14.73) | 3.35 (11.98) | 3.56 (13.32) | 1.83 (2.98) | 1.69 (2.45) | 1.76 (2.72) | 3.47 (11.96) | 3.05 (9.19) | 3.27 (10.58) | |
| W4: Clodinofop + Metsulfuron (60g + 4g ha-1) | 3.93 (15.67) | 3.63 (13.51) | 3.78 (14.59) | 3.00 (10.25) | 2.41 (7.40) | 2.73 (8.82) | 1.76 (2.78) | 1.54 (2.01) | 1.66 (2.39) | 2.81 (8.29) | 2.42 (6.34) | 2.63 (7.32) | |
| W5: Sulfosulfuron + Metsulfuron (20g + 4g ha-1) | 4.46 (19.92) | 4.19 (17.60) | 4.33 (18.76) | 3.54 (13.31) | 3.09 (10.75) | 3.33 (12.03) | 1.84 (3.02) | 1.67 (2.43) | 1.76 (2.73) | 3.25 (10.85) | 2.84 (8.49) | 3.05 (9.67) | |
| W6: Unweeded Control | 5.98 (35.98) | 5.80 (33.93) | 5.89 (34.96) | 5.93 (36.56) | 5.75 (35.17) | 5.84 (35.87) | 3.46 (11.68) | 3.20 (9.93) | 3.33 (10.80) | 5.46 (30.21) | 5.06 (26.01) | 5.27 (28.11) | |
| S.Em± | 0.21 | 0.23 | 0.21 | 0.32 | 0.37 | 0.35 | 0.12 | 0.12 | 0.12 | 0.23 | 0.25 | 0.23 | |
| CD (P=0.05) | 0.62 | 0.66 | 0.64 | 0.96 | 1.09 | 1.01 | 0.35 | 0.36 | 0.35 | 0.67 | 0.73 | 0.69 | |
| Interaction (I X W) | NS | NS | NS | NS | NS | NS | NS | NS | NS | NS | NS | NS |
Table text extracted from the original PDF; superscript letters are shown inline. The original table image is below.
View original table image
Among the irrigation levels in wheat, at 40 and 80 DAS, did not have significant effect on total density of broad leaf weeds during both the years and on mean basis. However, the lowest total density of broad leaf weeds was noted under I1: 0.8 IW/CPE and the highest total density of broad leaf weeds were recorded under I 3 : 1.2 IW/CPE during both the years and on mean basis. Among the weed management practices in wheat, at 40 and 80 DAS, significantly the lowest total density of broad leaf weeds was registered under W 4 : clodinofop + metsulfuron (60g+4g ha -1 ) however, it was found comparable to treatment W 3 : Metsulfuron (4g ha -1 ) and W 5 : sulfosulfuron + metsulfuron (20g + 4g ha -1 ) at 40 and 80 DASduring both the years and on mean basis. The highest total density of broad leaf weeds was recorded under W 6: unweeded control during both the years and on mean basis. The interaction effect between irrigation levels and weed management practices on total density of broad leaf weeds remained unaffected at 40 and 80 DAS during both the years and on mean basis.
The data pertaining to total dry weight of broad leaf weeds at 40 and 80 DAS as influenced by irrigation levels and weed management practices during both the years and on mean basis are given in Table 3. Among the irrigation levels in wheat, at 40 and 80 DAS, did not have significant effect on total dry weight of broad leaf weeds during both the years and on mean basis. However, the lowest total dry weight of broad leaf weeds was noted under I1: 0.8 IW/CPE and the highest total dry weight of different broad leaf weeds was recorded under I 3 : 1.2 IW/CPE during both the years and on mean basis. Among the weed management practices in wheat, at 40 and 80 DAS, significantly the lowest total dry weight of different broad leaf weeds was registered under W 4 : clodinofop + metsulfuron (60g+4g ha -1 ) but, it was found at par to treatment W 3 : Metsulfuron (4g ha -1 ) and W 5 : sulfosulfuron + metsulfuron (20g + 4g ha -1 ) at 40 and 80 DAS during both the years and on mean basis. The highest total density of broad leaf weeds was recorded under W 6: unweeded control during both the years and on mean basis. The interaction effect between irrigation levels and weed management practices on total dry weight of different broad leaf weeds remained unaffected at 40 and 80 DAS during both the years and on mean basis.
The data on weed control efficiency of board leaf weeds at 40 and 80 DAS are presented in Table 4. The data on total density of sedges and other weeds recorded at 40 and 80 DAS as influenced by irrigation levels and weed management practices in wheat during both the years and on mean basis are presented in Table 5.
| Treatment | Total density of sedges and other species (No.m-2) | — | — | — | — | — | Total dry weight of sedges and other species (g m-2) | — | — | — | — | — |
|---|---|---|---|---|---|---|---|---|---|---|---|---|
| 40DAS | 80DAS | 40DAS | 80DAS | |||||||||
| 2017-18 | 2018- 19 | Mean | 2017- 18 | 2018- 19 | Mean | 2017-18 | 2018-19 | Mean | 2017-18 | 2018-19 | Mean | |
| Irrigation levels | ||||||||||||
| I1: 0.8 IW/CPE | 3.21 (10.23) | 3.11 (9.74) | 3.16 (9.98) | 2.81 (8.23) | 2.20 (5.48) | 2.53 (6.86) | 1.69 (2.58) | 1.58 (2.23) | 1.64 (2.41) | 2.30 (5.90) | 2.00 (4.29) | 2.16 (5.10) |
| I2: 1.0 IW/CPE | 3.48 (11.81) | 3.42 (11.42) | 3.45 (11.36) | 3.11 (9.54) | 2.44 (6.31) | 2.81 (7.92) | 1.87 (3.10) | 1.76 (2.71) | 1.81 (2.90) | 2.61 (6.90) | 2.14 (4.58) | 2.39 (5.74) |
| I3: 1.2 IW/ CPE | 3.63 (12.82) | 3.65 (13.04) | 3.64 (12.93) | 3.48 (12.01) | 3.20 (11.02) | 3.36 (11.51) | 1.97 (3.48) | 1.87 (3.09) | 1.92 (3.29) | 2.97 (8.83) | 2.44 (6.05) | 2.73 (7.44) |
| S.Em± | 0.18 | 0.24 | 0.21 | 0.31 | 0.50 | 0.39 | 0.12 | 0.13 | 0.12 | 0.30 | 0.26 | 0.27 |
| CD (P=0.05) | NS | NS | NS | NS | NS | NS | NS | NS | NS | NS | NS | NS |
| Weed management | ||||||||||||
| W1: Sulfosulfuron (20g ha-1) | 3.44 (11.55) | 3.37 (11.17) | 3.40 (11.36) | 2.79 (8.77) | 2.24 (5.08) | 2.62 (6.93) | 1.77 (2.72) | 1.66 (2.36) | 1.71 (2.54) | 2.51 (6.14) | 2.10 (4.05) | 2.32 (5.09) |
| W2: Clodinofop (60g ha-1) | 3.57 (12.55) | 3.55 (12.26) | 3.55 (12.41) | 3.25 (10.44) | 2.63 (6.97) | 2.96 (8.71) | 1.91 (3.25) | 1.79 (2.87) | 1.85 (3.06) | 2.77 (7.64) | 2.30 (4.99) | 2.55 (6.32) |
| W3: Metsulfuron (4g ha-1) | 3.49 (11.91) | 3.51 (12.06) | 3.51 (11.98) | 3.43 (11.55) | 3.19 (10.46) | 3.35 (11.01) | 1.85 (2.99) | 1.74 (2.64) | 1.79 (2.81) | 2.59 (6.65) | 3.23 (4.71) | 2.42 (5.68) |
| W4: Clodinofop + Metsulfuron (60g + 4g ha-1) | 2.91 (8.20) | 2.79 (7.62) | 2.85 (7.91) | 2.36 (5.62) | 1.75 (3.48) | 2.09 (4.55) | 1.49 (1.81) | 1.40 (1.52) | 1.45 (1.67) | 1.74 (3.11) | 1.37 (1.81) | 1.57 (2.46) |
| W5: Sulfosulfuron + Metsulfuron (20g + 4g ha-1) | 3.35 (10.80) | 3.25 (10.17) | 3.30 (10.48) | 2.84 (8.04) | 2.04 (4.44) | 2.51 (6.24) | 1.67 (2.41) | 1.58 (2.04) | 1.64 (2.22) | 2.36 (5.35) | 1.87 (3.04) | 2.10 (4.19) |
| W6: Unweeded Control | 3.88 (14.71) | 3.93 (15.11) | 3.91 (14.91) | 3.91 (15.13) | 3.82 (15.17) | 3.87 (15.15) | 2.36 (5.13) | 2.25 (4.66) | 2.31 (4.90) | 3.81 (14.38) | 3.38 (11.26) | 3.60 (12.82) |
| S.Em± | 0.11 | 0.13 | 0.12 | 0.16 | 0.21 | 0.18 | 0.06 | 0.06 | 0.06 | 0.15 | 0.14 | 0.14 |
| CD (P=0.05) | 0.33 | 0.39 | 0.36 | 0.48 | 0.63 | 0.53 | 0.18 | 0.18 | 0.18 | 0.46 | 0.43 | 0.43 |
| Interaction (I X W) | NS | NS | NS | NS | NS | NS | NS | NS | NS | NS | NS | NS |
Table text extracted from the original PDF; superscript letters are shown inline. The original table image is below.
View original table image
| Treatment | WCE of broad leaf weeds | — | — | — | — | — |
|---|---|---|---|---|---|---|
| 40DAS | 80DAS | |||||
| 2017-18 | 2018-19 | Mean | 2017-18 | 2018-19 | Mean | |
| Irrigation levels | ||||||
| I1: 0.8 IW/CPE | 61.22 | 59.91 | 60.66 | 53.70 | 57.37 | 55.34 |
| I2: 1.0 IW/CPE | 53.87 | 58.20 | 55.85 | 47.79 | 50.45 | 49.02 |
| I3: 1.2 IW/ CPE | 48.83 | 51.62 | 50.12 | 43.33 | 46.05 | 44.61 |
| S.Em± | 3.08 | 2.48 | 2.51 | 1.51 | 2.18 | 1.75 |
| CD (P=0.05) | NS | NS | NS | 6.12 | NS | 7.08 |
| Weed management | ||||||
| W1: Sulfosulfuron (20g ha-1) | 57.05 | 61.66 | 59.17 | 53.81 | 56.68 | 55.22 |
| W2: Clodinofop (60g ha-1) | 48.65 | 52.73 | 50.53 | 43.18 | 47.96 | 45.39 |
| W3: Metsulfuron (4g ha-1) | 73.65 | 73.70 | 73.69 | 59.95 | 64.03 | 61.82 |
| W4: Clodinofop + Metsulfuron (60g + 4g ha-1) | 75.26 | 77.90 | 76.50 | 70.31 | 73.46 | 71.73 |
| W5: Sulfosulfuron + Metsulfuron (20g + 4g ha-1) | 73.24 | 73.48 | 73.37 | 62.41 | 65.42 | 63.80 |
| W6: Unweeded Control | 00.00 | 00.00 | 00.00 | 00.00 | 00.00 | 00.00 |
| S.Em± | 4.15 | 4.55 | 4.28 | 5.17 | 5.75 | 5.42 |
| CD (P=0.05) | 12.06 | 13.20 | 12.42 | 15.02 | 16.70 | 15.74 |
| Interaction (I X W) | NS | NS | NS | NS | NS | NS |
Table text extracted from the original PDF; superscript letters are shown inline. The original table image is below.
View original table image
As regards to irrigation levels in wheat, at 40 and 80 DAS, did not have significant effect on total density of sedges and other weeds during both the years and on mean basis. However, the lowest total density was noted under I1: 0.8 IW/CPE and the highest total density of sedges and other weeds was recorded under I 3 : 1.2 IW/CPE during both the years and on mean basis. Among the weed management practices in wheat, at 40 and 80 DAS, significantly the lowest total density of sedges and other weeds was recorded under W 4 : clodinofop + metsulfuron (60g+4g ha -1 ) however, it was statistically similar to treatment W 5 : sulfosulfuron + metsulfuron (20g + 4g ha -1 ) and W 1 : sulfosulfuron (20g ha -1 ) at 80 DAS during both the years and on mean basis. The highest total density of sedges and other weeds was recorded under W 6: unweeded control during both the years and on mean basis. The interaction effect between irrigation levels and weed management practices on total density of sedges and other weeds remained unaffected at 40 and 80 DAS during both the years and on mean basis.
The data on total dry weight of sedges and other weeds recorded at 40 and 80 DAS in wheat as influenced by irrigation levels and weed management practices in wheat during both the years and on mean basis are presented in Table 5.
As regards to irrigation levels in wheat, at 40 and 80 DAS, did not have significant effect on total dry weight of sedges and other weeds during both the years and on mean basis. However, the lowest total dry weight was noted under I 1 : 0.8 IW/CPE and the highest total dry weight of sedges and other weeds was recorded under I 3 : 1.2 IW/CPE during both the years and on mean basis. Among the weed management practices in wheat, at 40 and 80 DAS, significantly the lowest total dry weight of sedges and other weeds was recorded under W 4 : clodinofop + metsulfuron (60g+4g ha -1 ) however, it was statistically similar to treatment W 5 : sulfosulfuron + metsulfuron (20g + 4g ha -1 ) at 40 DAS during both the years and on mean basis. The highest dry weight of total sedges and other weeds was recorded under W 6: unweeded control during both the years and on mean basis. The interaction effect between irrigation levels and weed management practices on total dry weight of sedges and other weeds remained unaffected at 40 and 80 DAS during both the years and on mean basis.
The data on weed control efficiency of sedges and others weeds at 40 and 80 DAS are presented in Table 6.
| Treatment | WCE of sedges and other species | — | — | — | — | — |
|---|---|---|---|---|---|---|
| 40DAS | 80DAS | |||||
| 2017-18 | 2018-19 | Mean | 2017-18 | 2018-19 | Mean | |
| Irrigation levels | ||||||
| I1: 0.8 IW/CPE | 48.64 | 52.73 | 50.37 | 59.86 | 62.19 | 60.98 |
| I2: 1.0 IW/CPE | 39.69 | 42.40 | 40.92 | 49.12 | 55.46 | 51.89 |
| I3: 1.2 IW/ CPE | 34.35 | 35.71 | 34.99 | 43.15 | 50.04 | 46.22 |
| S.Em± | 4.00 | 4.74 | 4.72 | 3.66 | 2.96 | 3.10 |
| CD (P=0.05) | NS | NS | NS | NS | NS | NS |
| Weed management | ||||||
| W1: Sulfosulfuron (20g ha-1) | 48.57 | 52.23 | 50.21 | 59.26 | 63.31 | 61.17 |
| W2: Clodinofop (60g ha-1) | 38.59 | 42.21 | 40.18 | 49.59 | 55.74 | 52.42 |
| W3: Metsulfuron (4g ha-1) | 43.08 | 46.05 | 44.36 | 56.41 | 60.04 | 58.05 |
| W4: Clodinofop + Metsulfuron (60g + 4g ha-1) | 63.18 | 65.87 | 64.34 | 77.07 | 82.95 | 79.64 |
| W5: Sulfosulfuron + Metsulfuron (20g + 4g ha-1) | 51.95 | 55.31 | 53.46 | 62.97 | 73.35 | 66.89 |
| W6: Unweeded Control | 00.00 | 00.00 | 00.00 | 00.00 | 00.00 | 00.00 |
| S.Em± | 4.10 | 4.34 | 4.18 | 4.86 | 4.77 | 4.61 |
| CD (P=0.05) | 11.90 | 12.59 | 12.14 | 14.11 | 13.86 | 13.39 |
| Interaction (I X W) | NS | NS | NS | NS | NS | NS |
Table text extracted from the original PDF; superscript letters are shown inline. The original table image is below.
View original table image
As regards to irrigation levels in wheat, at 40 and 80 DAS, did not have significant effect on weed control efficiency of sedges and others weeds during both the years and on mean basis. However, the highest weed control efficiency of sedges and others weeds was noted under I1: 0.8 IW/CPE and the lowest was recorded under I 3 : 1.2 IW/CPE during both the years and on mean basis. Among the weed management practices in wheat, at 40 and 80 DAS, significantly the highest weed control efficiency of sedges and others weeds was recorded under W 4 : clodinofop + metsulfuron (60g+4g ha -1 ), but, it was statistically similar to treatment W 5 : sulfosulfuran + metsulfuran (20g+4g ha -1 ) during both the years and on mean basis. Whereas, the lowest weed controls efficiency of sedges and others weeds was noted under W 6: unweeded control at 40 and 80 DAS during both the years and on mean basis. The interaction effect between irrigation levels and weed management practices on weed control efficiency of sedges and others weeds remained unaffected at 40 and 80 DAS during both the years and on mean basis.
The data on total density of all species recorded at 40 and 80 DAS as influenced by irrigation levels and weed management practices in wheat during both the years and on mean basis are presented in Table 7.
| Treatment | Total density of all weeds species (No.m-2) | — | — | — | — | — | Total dry wt. of all weeds species (g m-2) | — | — | — | — | — |
|---|---|---|---|---|---|---|---|---|---|---|---|---|
| 40DAS | 80DAS | 40DAS | 80DAS | |||||||||
| 2017- 18 | 2018- 19 | Mean | 2017- 18 | 2018- 19 | Mean | 2017- 18 | 2018- 19 | Mean | 2017- 18 | 2018- 19 | Mean | |
| Irrigation levels | ||||||||||||
| I1: 0.8 IW/CPE | 6.96 (50.52) | 6.54 (45.32) | 6.75 (47.92) | 5.47 (35.16) | 4.62 (27.37) ( | 5.07 31.26) | 3.30 (11.44) | 2.85 (8.72) | 3.09 (10.08) | 5.11 (29.93) | 4.54 (23.89) | 4.83 (23.89) |
| I2: 1.0 IW/CPE | 7.60 | 7.25 | 7.42 | 6.24 | 5.34 | 5.82 | 3.62 | 3.13 | 3.38 | 5.61 | 4.89 | 5.26 |
Table text extracted from the original PDF; superscript letters are shown inline. The original table image is below.
View original table image
As regards to irrigation levels in wheat, at 40 and 80 DAS, did not have significant effect on total density of all species during both the years and on mean basis. However, the lowest all total weed density was noted under I1: 0.8 IW/CPE and however, the highest total density of all species was recorded under I 3 : 1.2 IW/CPE during both the years and on mean basis. Among the weed management practices in wheat, at 40 and 80 DAS, significantly the lowest total density of all species was recorded under W 4 : clodinofop + metsulfuron (60g+4g ha -1 ) however, it was statistically similar to treatment, W 5 : sulfosulfuran + metsulfuran (20g+4g ha -1 ) at 80 DAS during both the years and on mean basis. The highest total density of all species was noted under W 6: unweeded control at 40 and 80 DAS during both the years and on mean basis. The interaction effect between irrigation levels and weed management practices on total density of all species remained unaffected at 40 and 80 DAS during both the years and on mean basis.
The data on total dry weight of all weeds recorded at 40 and 80 DAS as influenced by irrigation levels and weed management practices in wheat during both the years and on mean basis are presented in Table 7.
As regards to irrigation levels in wheat, at 40 and 80 DAS, did not have significant effect on total dry weight of all weeds during both the years and on mean basis. However, the lowest total dry weight of all weeds was noted under I1: 0.8 IW/CPE and the highest total dry weight of all species were recorded under I 3 : 1.2 IW/CPE during both the years and on mean basis. Among the weed management practices in wheat, at 40 and 80 DAS, significantly minimum total dry weight of all weeds was recorded under W 4 : clodinofop + metsulfuron (60g+4g ha -1 ) however, it was statistically similar to treatment, W 5 : sulfosulfuran + metsulfuran (20g+4g ha -1 ) at 40 and 80 DAS during both the years and on mean basis. The highest total weed dry weight of all weeds was noted under W 6: unweeded control at 40 and 80 DAS during both the years and on mean basis. The interaction effect between irrigation levels and weed management practices on total dry weight remained unaffected at 40 and 80 DAS during both the years and on mean basis.
The data on weed control efficiency of all species was computed at 40 and 80 DAS as influenced by irrigation levels and weed management practices in wheat during both the years and on mean basis are presented in Table 8.
| Treatment | WCE of all weeds species | — | — | — | — | — | Weed index (%) | — | — |
|---|---|---|---|---|---|---|---|---|---|
| 40DAS | 80DAS | ||||||||
| 2017-18 | 2018-19 | Mean | 2017-18 | 2018-19 | Mean | 2017-18 | 2018-19 | Mean | |
| Irrigation levels | |||||||||
| I1: 0.8 IW/CPE | 51.99 | 56.59 | 54.05 | 55.47 | 57.47 | 56.39 | 45.24 | 42.54 | 43.89 |
| I2: 1.0 IW/CPE | 44.82 | 50.83 | 47.54 | 49.20 | 53.38 | 51.11 | 34.33 | 30.62 | 32.47 |
| I3: 1.2 IW/ CPE | 40.94 | 45.67 | 43.12 | 43.34 | 46.97 | 45.03 | 26.80 | 22.72 | 24.76 |
| S.Em± | 2.40 | 2.77 | 2.49 | 1.93 | 2.16 | 1.95 | 0.28 | 0.25 | 0.26 |
| CD (P=0.05) | NS | NS | NS | NS | NS | NS | 1.14 | 1.02 | 1.07 |
| Weed management | |||||||||
| W1: Sulfosulfuron (20g ha-1) | 51.44 | 58.48 | 54.64 | 57.21 | 61.12 | 59.02 | 35.50 | 31.75 | 33.63 |
| W2: Clodinofop (60g ha-1) | 43.44 | 50.11 | 46.46 | 48.57 | 52.55 | 50.44 | 37.48 | 33.75 | 35.61 |
| W3: Metsulfuron (4g ha-1) | 54.46 | 58.90 | 56.45 | 53.18 | 56.20 | 54.58 | 39.04 | 35.77 | 37.41 |
| W4: Clodinofop + Metsulfuron (60g + 4g ha-1) | 66.41 | 73.46 | 69.62 | 73.26 | 76.36 | 74.67 | 21.48 | 16.77 | 19.12 |
| W5: Sulfosulfuron + Metsulfuron (20g + 4g ha-1) | 59.75 | 65.23 | 62.25 | 63.79 | 69.43 | 66.36 | 26.15 | 21.80 | 23.98 |
| W6: Unweeded Control | 00.00 | 00.00 | 00.00 | 00.00 | 00.00 | 00.00 | 53.08 | 51.91 | 52.50 |
| S.Em± | 3.64 | 3.92 | 3.75 | 4.74 | 5.00 | 4.84 | 0.29 | 0.26 | 0.26 |
| CD (P=0.05) | 10.58 | 11.38 | 10.90 | 13.75 | 14.52 | 14.06 | 0.85 | 0.77 | 0.77 |
| Interaction (I X W) | NS | NS | NS | NS | NS | NS | S | S | S |
Table text extracted from the original PDF; superscript letters are shown inline. The original table image is below.
View original table image
| — | (58.37) | (53.41) | (55.89) | (41.56) | (32.50) | (37.03) | (13.21) | (9.97) | (11.59) | (33.63) | (26.13) | (26.13) |
|---|---|---|---|---|---|---|---|---|---|---|---|---|
| I3: 1.2 IW/ CPE | 8.08 (65.81) | 7.78 (61.36) | 7.93 (63.58) | 7.49 (59.37) | 6.90 (52.77) | 7.21 (56.07) | 3.86 (14.96) | 3.41 (11.72) | 3.64 (13.34) | 6.43 (43.61) | 5.74 (35.54) | 6.10 (35.54) |
| S.Em± | 0.50 | 0.58 | 0.54 | 0.94 | 1.08 | 1.00 | 0.25 | 0.26 | 0.25 | 0.68 | 0.68 | 0.68 |
| CD (P=0.05) | NS | NS | NS | NS | NS | NS | NS | NS | NS | NS | NS | NS |
| Weed management | ||||||||||||
| W1: Sulfosulfuron (20g ha-1) | 7.46 (56.47) | 7.08 (51.46) | 7.27 (53.97) | 5.84 (36.26) | 4.89 (25.88) | 5.39 (31.07) | 3.50 (12.20) | 3.01 (8.94) | 3.26 (10.57) | 5.45 (30.37) | 4.78 (23.41) | 5.12 (23.41) |
| W2: Clodinofop (60g ha-1) | 7.94 (64.10) | 7.60 (59.13) | 7.78 (61.61) | 6.96 (51.11) | 6.30 (43.08) | 6.64 (47.10) | 3.77 (14.25) | 3.28 (10.81) | 3.53 (12.53) | 6.01 (37.63) | 5.32 (29.37) | 5.68 (29.37) |
| W3: Metsulfuron (4g ha-1) | 7.43 (55.58) | 7.16 (51.91) | 7.30 (53.75) | 6.92 (49.86) | 6.31 (42.62) | 6.63 (46.24) | 3.38 (11.11) | 2.97 (8.58) | 3.18 (9.85) | 5.73 (33.73) | 5.12 (26.96) | 5.43 (26.96) |
| W4: Clodinofop + Metsulfuron (60g + 4g ha- 1) | 6.26 (40.14) | 5.80 (34.86) | 6.04 (37.50) | 4.47 (23.38) | 3.44 (16.06) | 4.00 (19.72) | 2.83 (7.79) | 2.30 (5.09) | 2.58 (6.44) | 3.95 (17.38) | 3.39 (13.12) | 3.68 (13.12) |
| W5: Sulfosulfuron + Metsulfuron (20g + 4g ha-1) | 7.19 (51.87) | 6.79 (46.37) | 6.99 (49.12) | 5.47 (31.86) | 4.40 (22.55) | 4.97 (27.21) | 3.13 (9.48) | 2.67 (6.81) | 2.91 (8.15) | 4.84 (24.66) | 4.04 (17.89) | 4.46 (17.89) |
| W6: Unweeded Control | 8.98 (81.23) | 8.70 (76.44) | 8.84 (78.83) | 8.75 (79.70) | 8.37 (75.08) | 8.57 (77.39) | 4.95 (24.38) | 4.55 (20.60) | 4.76 (22.49) | 8.31 (70.54) | 7.68 (60.39) | 8.00 (60.39) |
| S.Em± | 0.28 | 0.30 | 0.29 | 0.44 | 0.50 | 0.46 | 0.14 | 0.14 | 0.14 | 0.34 | 0.35 | 0.34 |
| CD (P=0.05) | 0.81 | 0.89 | 0.85 | 1.28 | 1.45 | 1.35 | 0.41 | 0.43 | 0.42 | 1.00 | 1.03 | 1.01 |
| Interaction (I X W) | NS | NS | NS | NS | NS | NS | NS | NS | NS | NS | NS | NS |
Table text extracted from the original PDF; superscript letters are shown inline. The original table image is below.
View original table image
As regards to irrigation levels in wheat, at 40 and 80 DAS, did not have significant effect on weed control efficiency all species of during both the years and on mean basis. However, the maximum weeds control efficiency all species was noted under I1: 0.8 IW/CPE and the minimum were recorded under I 3 : 1.2 IW/CPE during both the years and on mean basis. Among weed management practices in wheat, at 40 and 80 DAS, significantly maximum weed control efficiency all species was recorded under treatment W 4 : clodinofop + metsulfuron (60g+4g ha -1 ) but, it was found at par with treatment W 5 : sulfosulfuran + metsulfuran (20g+4g ha -1 ) at 40 and 80 DAS during both the years and on mean basis. The minimum weed control efficiency of all species was noted under W 6: unweeded control during both the years and on mean basis. The interaction effect between irrigation levels and weed management practices on weed control efficiency all species remained unaffected at 40 and 80 DAS during both the years and on mean basis.
The data on weed Index was significantly influenced by irrigation levels and weed management practices during both the years and on mean basis and presented in Table 8. The weed Index was significantly affected due to different irrigation management practices during both the years and on mean basis. The significantly highest yield reduction was recorded in treatment I1: 0.8 IW/CPE as compared to others during both the years and on mean basis. The least yield reduction was recorded in treatment I 3 : 1.2 IW/CPE during both the years and on mean basis. As regards to weed management practices in wheat, treatment W 6 : unweeded control was registered significantly higher yield reduction as compared to other treatments during both the years and on mean basis. However, the significantly minimum yield reduction was registered under treatment W 4 : clodinofop + metsulfuron (60g+4g ha -1 ) as compared to W 5 : sulfosulfuron + metsulfuron (20g+4g ha -1 ) and W 1 : sulfosulfuron (20g ha -1 ) during both the years and on mean basis. The interaction effect between irrigation levels and weed management practices in wheat presented in Table 9 on weed index was found significant during both the years and on mean basis. The findings revealed that the interaction between I 1 : 0.8 IW/CPE and W 6: unweeded control recorded significantly highest yield reduction as compared to other interactions. However, the minimum yield reduction was noted under interaction between I 3 : 1.2 IW/CPE and W 4 : clodinofop + metsulfuron (60g+4g ha -1 ) during both the years and on mean basis as compared to other treatment. [12] , Hari et al. (2006) [5] , and Koli (2006) [7] . Among irrigation levels, lack of moisture occurred and thus, some weeds do not survive under low moisture condition and therefore lower number of weed was observed with less irrigation level. Some findings by Nadeem et al. (2007) [10] . The significantly lower dry matter observed under minimum irrigation levels due to lack availability of moisture, resulting poor weed growth. While on the other hand higher dry matter of weed in increasing irrigation levels is associated with more water and that leads profuse growth of weed due to good availability of moisture and nutrient from soil. These finding are supported by Yaghobi (2008) [15] . The higher weed density and dry weight was observed under treatment W 6: unweeded control at all the growth stages of crop during both the years. This was mainly due to the higher and uninterrupted growth of weeds which made best use of the growth resources and resulted in higher dry weight of grasses, broadleaf weeds and sedges at all the stages of crop growth. The other explanations of the lower weed dry weight in the above treatments was mainly due to better weed control efficiency with these treatments which resulted in lower population of grasses, broadleaf and sedges. The results are in conformity with the findings of Balyan and Bhan (1987) [2] . It might be due to effective weed management by W 4 : clodinofop + metsulfuron (60g+4g ha -1 ) affected the growth and development of different weeds spp. Almost similar trend was seen during 40 and 80 DAS where these treatments observed good weed control and recorded least total weed density and dry weight. These findings are in agreement with the results reported by Tripathi et al. (2005) [14] , Choubey et al. (1998) [3] and Singh and Singh (2004) [13] . The W 4 : clodinofop + metsulfuron (60g+4g ha -1 ) reduced total weed density and dry matter compared to unweeded control and other herbicide treatments might be due to broad spectrum control of weeds viz., grassy and broad leaf weeds. The superiority of Metsulfuron-methyl over their other application in reducing weed density and dry matter has also been reported by Jat et al. (2007) [6] , Mahida (2008) [8] and Padheriya et al. (2014) [11] . Among weed management practices tried under study, treatment W 4 : Clodonofop + Metsulfuron (60g + 4g ha -1 ) recorded the highest weed control efficiency followed by W 5 : Sulfosulfuran + Metsulfuran (20g + 4g ha -1 ) It might be due to lower weed density and dry matter and higher grain yield observed under these treatments. Similar findings by Malik et al. (2008) [9] and Padheriya et al. (2014) [11] . Weed index, which is a measure of yield reduction due to weed competition, was highest in W 6: unweeded control over highest weed control treatment followed by postemergence application of W 4 : clodinofop + metsulfuron (60g+4g ha -1 ) and W 5 : sulfosulfuron + metsulfuron (20g + 4g ha -1 ). This was due to competition offered by W 6: unweeded control growth for nutrients, moisture and light as indicated by poor growth and yield components. However the lowest yield reduction was obtained under W 4 :
| Treatment | Weed index (%) | — | — | — | — | — | — | — | — |
|---|---|---|---|---|---|---|---|---|---|
| 2017-18 | 2018-19 | Mean | |||||||
| I1: 0.8 IW/CPE | I2: 1.0 IW/CPE | I3: 1.2 IW/CPE | I1: 0.8 IW/CPE | I2: 1.0 IW/CPE | I3: 1.2 IW/CPE | I1: 0.8 IW/CPE | I2: 1.0 IW/CPE | I3: 1.2 IW/CPE | |
| W1: Sulfosulfuron (20g ha-1) | 42.52 | 36.79 | 27.21 | 39.18 | 33.03 | 22.41 | 41.17 | 34.91 | 24.81 |
| W2: Clodinofop (60g ha-1) | 46.04 | 38.10 | 28.30 | 43.46 | 34.25 | 23.53 | 44.75 | 36.17 | 25.91 |
| W3: Metsulfuron (4g ha-1) | 46.82 | 39.31 | 30.99 | 44.40 | 35.69 | 27.24 | 45.61 | 37.50 | 29.11 |
| W4: Clodinofop + Metsulfuron (60g + 4g ha-1) | 40.34 | 14.98 | 9.12 | 36.57 | 10.25 | 3.48 | 38.45 | 12.61 | 6.30 |
| W5: Sulfosulfuron + Metsulfuron (20g + 4g ha-1) | 41.19 | 24.05 | 13.23 | 37.57 | 18.92 | 8.90 | 39.38 | 21.49 | 11.07 |
| W6: Unweeded Control | 54.53 | 52.75 | 51.97 | 53.41 | 51.57 | 50.76 | 53.97 | 52.16 | 51.36 |
| S.Em± | |||||||||
| 2 SP at same MP | 0.69 | 0.62 | 0.65 | ||||||
| 2MP at same SP | 0.54 | 0.49 | 0.49 | ||||||
| CD (P=0.05) | |||||||||
| 2 SP at same MP | 1.63 | 1.48 | 1.48 | ||||||
| 2MP at same SP | 1.74 | 1.58 | 1.60 |
Table text extracted from the original PDF; superscript letters are shown inline. The original table image is below.
View original table image
clodinofop + metsulfuron (60g+4g ha -1 ) performed at 40 and 80 DAS followed by and W 5 : sulfosulfuron + metsulfuron (20g + 4g ha -1 ). This was mainly due to improved growth of wheat as a consequence of effective control of weeds and reduction in the crop weed competition. This might have enabled the crop to take up more water and nutrients. A similar finding was reported by Deshmukh et al. (2009) [4] .
Conclusion
In conclusion, the study on weed management in wheat cultivation revealed several significant insights. The irrigation levels demonstrated varying effects on weed density and dry weight, with higher irrigation levels leading to increased weed growth due to ample moisture availability. Conversely, lower irrigation levels resulted in reduced weed growth due to moisture scarcity. Effective herbicide treatments, particularly W4: clodinofop + metsulfuron (60g + 4g ha -1 ), exhibited superior weed control efficiency, significantly reducing both weed density and dry matter. This translated into higher grain yields by minimizing the competition between weeds and crops for resources such as nutrients, moisture, and light. Moreover, the weed index highlighted the substantial yield reduction caused by uncontrolled weed growth, emphasizing the importance of effective weed management strategies.
Overall, the study underscores the significance of employing appropriate irrigation techniques and implementing effective herbicide treatments to mitigate weed competition and enhance wheat productivity.
Figures and tables from the paper
| Treatment | WCE of grassy weed (%) | — | — | — | — | — |
|---|---|---|---|---|---|---|
| 40DAS | 80DAS | |||||
| 2017-18 | 2018-19 | Mean | 2017-18 | 2018-19 | Mean | |
| Irrigation levels | ||||||
| I1: 0.8 IW/CPE | 41.74 | 54.15 | 47.03 | 54.84 | 54.92 | 54.90 |
| I2: 1.0 IW/CPE | 34.55 | 45.31 | 39.26 | 50.79 | 55.42 | 52.94 |
| I3: 1.2 IW/ CPE | 32.75 | 43.33 | 37.47 | 43.43 | 46.44 | 44.86 |
| S.Em± | 1.52 | 2.82 | 1.95 | 2.00 | 3.32 | 2.48 |
| CD (P=0.05) | 6.15 | NS | NS | 8.07 | NS | NS |
| Weed management | ||||||
| W1: Sulfosulfuron (20g ha-1) | 45.20 | 58.20 | 50.92 | 59.88 | 64.59 | 61.86 |
Table text extracted from the original PDF; superscript letters are shown inline. The original table image is below.
View original table image
References
11 in the original paper- Balyan RS, Bhan VM. Studies on cultural and chemical weed control in maize. Indian J Agron. 1987;32(1):4143.
- Choubey NK, Tripathi RS, Ghosh BC. Influence of irrigation scheduling and weed control methods on weed growth and yield of wheat (Triticum aestivum L.). Indian J Weed Sci. 1998;30(1-2):28-31.
- Deshmukh LS, Jadhav AS, Jathure RS, Raskar SK. Effect of nutrient and weed management on weed growth and productivity of kharif maize under rainfed condition. Karnataka J Agric Sci. 2009;22(4):889-891.
- Hari O, Nandal DP, Dhiman SD, Ram M. Weed control in wheat (Triticum aestivum L.) sown by zero tillage. Indian J Agronomy. 2006;51(3):199-201.
- Jat RK, Punia SS, Malik RK. Effect of different herbicide treatments on nutrient uptake behaviour of weeds and wheat (Triticum aestivum L.). Indian J Weed Sci. 2007;39(1-2):135-137.
- Malik RS, Yadav A, Malik RK. Evaluation of different herbicides against broadleaf weeds in wheat and their residual effects on sorghum. Indian J Weed Sci. 2008;40(1-2):23-27.
- Nadeem MA, Asif T, Ali A, Ayuh M, Tahir M. Effect of weed-control practice and irrigation levels on weeds and yield of wheat (Triticum aestivum). Indian J Agronomy. 2007;52:60-63.
- Padheriya DR, Sadhu AC, Suryawanshi PK, Shitap MS. Time of nitrogen application and weed management practices for increased production of wheat in Gujarat. Indian J Weed Sci. 2014;46(3):286-288.
- Singh G, Singh VP. Compatibility of clodinafoppropargyl and fenoxaprop-p ethyl with carfentrazoneethyl, metsulfurom methyl and 2,4-D. Indian J Weed Sci. 2005;37(1-2):1-5.
- Singh R, Singh B. Effect of irrigation time and weed management practices on weeds and wheat yield. Indian J Weed Sci. 2004;36(1-2):25-27.
- Tripathi AK, Tewari AN, Prasad A. Integrated weed management in rainy season maize (Zea mays L.) in Central Uttar Pradesh. Indian J Weed Sci. 2005;37(34):269-270.