
Research article · 2024 · Full text
International Journal of Research in AgronomyA comparative study on area, production, productivity, cost of cultivation and production of cotton crop in Telangana and India
Volume 7(3S) · Pages 354–357 · DOI: 10.33545/2618060x.2024.v7.i3se.481 ↗
Research areasAgricultural Economics and PracticesResearch in Cotton Cultivation
Abstract
Author-writtenThis study deals with area, production, productivity, cost of cultivation, cost of production of cotton in Telangana state & India. The study is based on secondary data collected from different sources. The reference years of the study pertained to a period from 2000-01 to 2020-21. Data related to different variable were presented at an interval of five years during the period of the study. The results of the study revealed that both in Telangana state and India the area under cotton increased to a greater extent as compared to total cropped area. Total cropped area in India recorded a negative change during the entire period. Both the area under cotton and gross cropped area in Telangana state exhibited higher degree of percentage change as compared to those in India. Percentage share of area under cotton in Telangana with respect to the area in India gradually increased in each of the interval of time period. More or less same phenomenon occurred in the case of share of production of cotton. But productivity of this crop in Telangana remained low as compared to that in India in each of the intervals of the entire time period. Production of cotton increased to a large extent in both Telangana and India. This was attributed to increase in area and productivity of this crop. Level of the production in Telangana increased to a greater extent as compared to that in India. But yield or productivity of this crop increased to a greater extent in India as compared to that in Telangana. Cost of cultivation (comprehensive cost) recorded a higher degree of change in India than in Telangana. But Telangana recorded higher level of cost of cultivation than that of India in each of the intervals of the entire time period. Change in minimum support price (MSP) of cotton was greater than change in cost of production in India. But change in MSP of this crop was low as compared to the change in cost of production in Telangana. Also MSP of cotton was low as compared to its cost of production of both Telangana and India in each of the intervals of entire time period.
Summary
Source-checkedPlain-language reading of the full paper, prepared with AI and checked against the text. Each point links to the authors' own words.
Why it matters
- Cotton is a critical commercial crop that significantly contributes to the economy of India. View evidence ↗
- The cost of production is a vital economic factor because it directly impacts the profitability for cotton farmers. View evidence ↗
The question
- The study aims to compare the area, production, productivity, and cost of production of cotton crops between the state of Telangana and India as a whole. View evidence ↗
What they did
- The research utilized secondary data covering the period from 2000-01 to 2020-21. View evidence ↗
- Variables including area, production, productivity, cost of cultivation, cost of production, and minimum support price were analyzed at five-year intervals and for the total study period. View evidence ↗
- The authors used a tabular method to analyze the collected data. View evidence ↗
What they found
- From 2000-01 to 2020-21, the area under cotton increased by 288.81% in Telangana and 54.90% across India. View evidence ↗
- While cotton area grew, the total cropped area in India decreased by 2.07% over the entire study period. View evidence ↗
- Cotton production increased significantly from 2000-01 to 2020-21, rising by 432.01% in Telangana and 151.77% in India. View evidence ↗
- Yield increased by 46.92% in Telangana and 62.51% in India between 2000-01 and 2020-21, indicating that India's yield growth was higher. View evidence ↗
- The cost of cultivation for cotton was consistently higher in Telangana than the national average across all five-year intervals. View evidence ↗
- In every time interval, the Minimum Support Price (MSP) per quintal was lower than the actual cost of production per quintal for both Telangana and India. View evidence ↗
What it means
- The authors conclude that Telangana's lower cotton productivity compared to the national level suggests a lack of efficiency in resource use. View evidence ↗
- The authors recommend that the MSP be based on the comprehensive cost of cultivation to better encourage farmers to invest in cotton. View evidence ↗
Visual summary
3 visualsIllustrations explain the paper; charts are replotted from the paper's own table values.
Cotton Growth Comparison
AI-generated conceptual illustration (cotton plants in fields). It explains the idea and does not show study data.
View source evidence ↗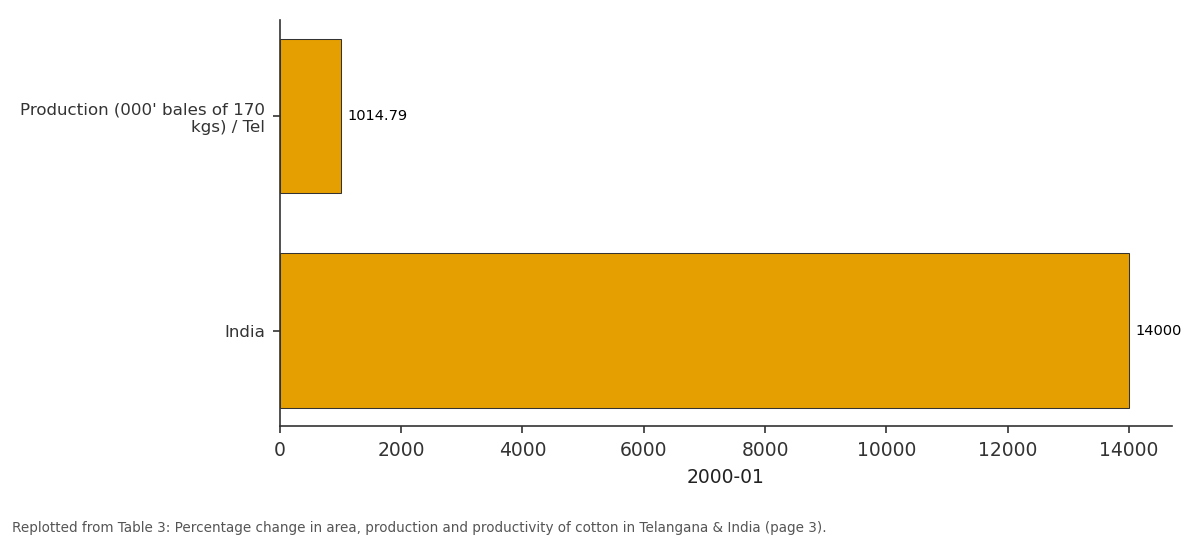
2000-01: Production (000' bales... vs India
Replotted from Table 3 (page 3) of the original paper. Every bar is the paper's own table value.
View source evidence ↗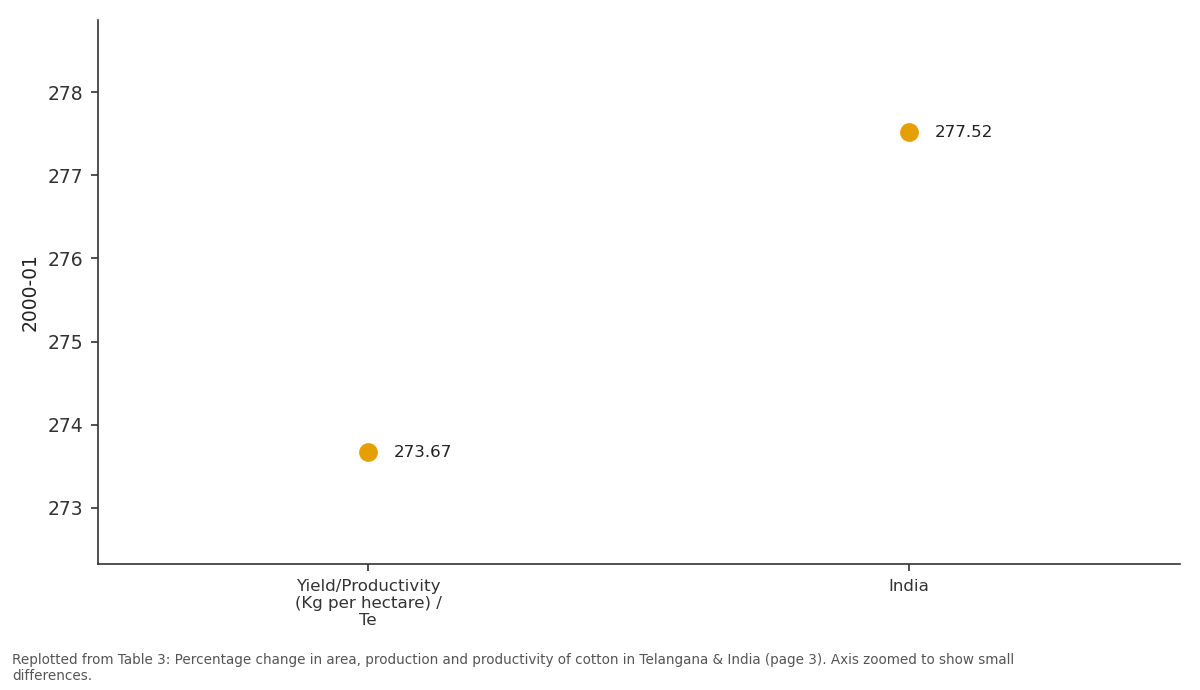
2000-01: Yield/Productivity (Kg... vs India
Replotted from Table 3 (page 3) of the original paper. Every bar is the paper's own table value.
View source evidence ↗Figures & tables
From the original paper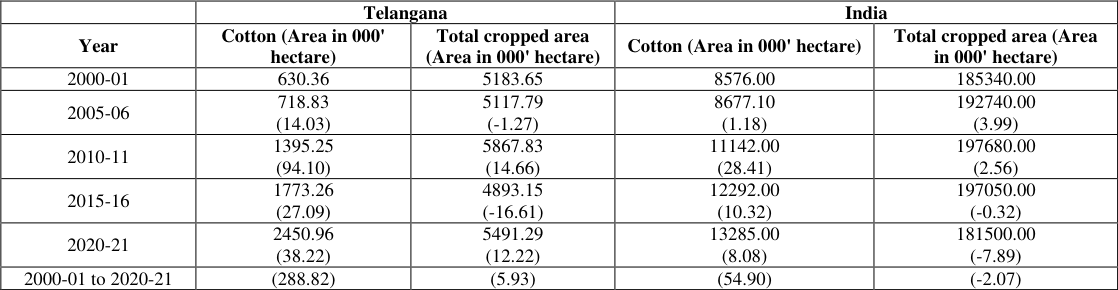 Table 1
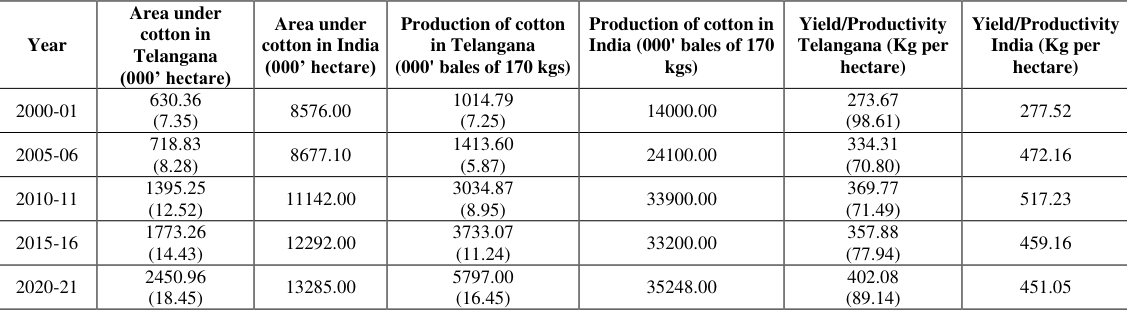 Table 2
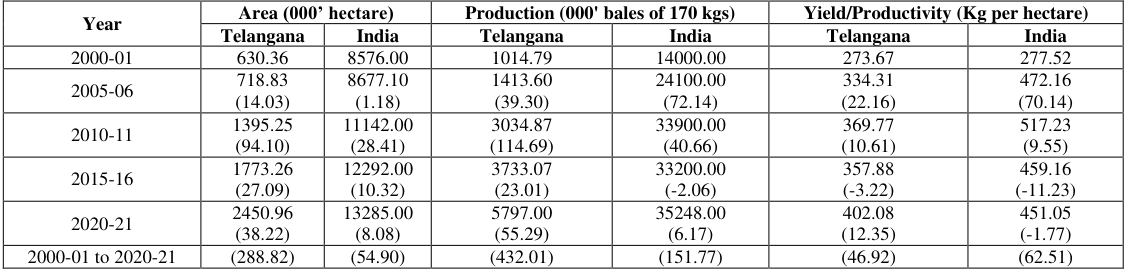 Table 3
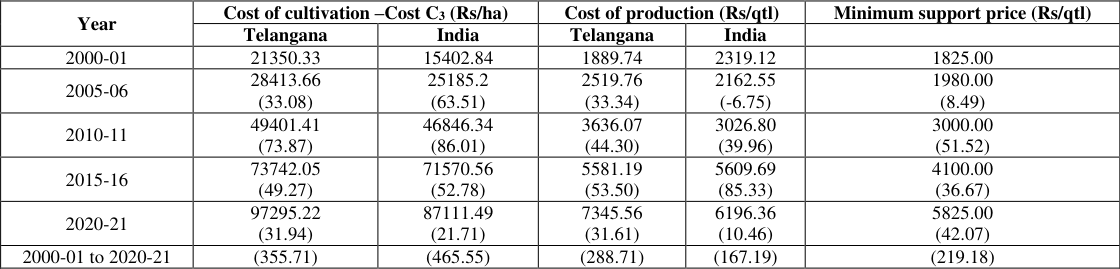 Table 4
Introduction
Cotton is one of the most important commercial crop in India and its cultivation is a significant contributor to the country's economy. On a global level, the 2021-22 cotton area covered 32.10 million hectares with production and productivity amounting to 257.71 bales per hectare (ha) and 1370 kilograms per hectare (kg/ha) respectively (Angrau Cotton Outlook Report). India, as a whole, has a total cropped area of around 181 million hectares, with cotton being a major cash crop grown in a number of state. India is one of the largest cotton-producing countries in the world, with the majority of its production coming from states such as Gujarat, Maharashtra, Telangana, and Andhra Pradesh. Cotton cultivation covers around 13 million hectares in India, making it a crucial contributor to the country's agricultural economy. In Telangana, the total cropped area is around 5.4 million hectares. Cotton cultivation in Telangana covers around 2.4 million hectares, making it one of the largest cotton-producing states in India. The state has made significant progress in increasing the productivity and profitability of its cotton sector in recent years, with a focus on promoting modern farming practices. In terms of productivity, the yield of cotton crops in India has improved over the years due to better farming practices and the use of high-yielding varieties of cotton. Cost of production is a critical economic factor in cotton production, as it directly affects profitability for farmers.
The cost of producing cotton can vary widely depending on factors such as input costs (e.g. seeds, fertilizers, Pesticides), labour costs and machinery costs. In addition, changes in market prices for cotton can also have a significant impact on the profitability of cotton farming. Overall, cotton farming in Telangana and India plays a significant role in the agricultural economy of the region, efforts made to improve productivity and reduce the cost of production will benefit the cotton farmers. Thus in the study, a comparative study is done on area, production, productivity and cost of production of cotton crops in Telangana and India.
Materials and Methods
The study was based on secondary data collected from different sources like Directorate of Economics and Statistics, Government of India; Cotton Corporation of India, Agricultural statistics at a glance. The reference years of the study pertained to a long period of time from 2000-01 to 2020-21. Changes in different variables like area, production, productivity and cost of cultivation, production of cotton crop and minimum support price were estimated at an interval of five years and in respect of entire period of the study. The changes in different variables were estimated in terms of percentage at an interval of five years and entire time period of this study. Tabular method of analysis was employed in this study. The table-1 shows percentage change in area under cotton and percentage change in total cropped area in Telangana and India. These changes pertained to the time period from 2000-01 to 2020-21 at interval of five years. Area under cotton in Telangana was found to increase in each interval of five years during the period. The highest increase in area under cotton was recorded 94.10 percent during the period from 2005-06 to 2010-11. A lowest increase of 14.03 percent was estimated during the period from 2000-01 to 2005-06. During the entire period from 2000-01 to 2020-21 area under cotton in Telangana was found to increase by 288.81 percent. But total cropped area (gross cropped area) was noted to record changes in two directions. During the period from 2000-01 to 2005-06 the cropped area decreased by 1.27 percent in the next interval of five years, i.e. between the period from 2005-06 to 2010-11 a positive change of 14.66 percent was estimated for total cropped area. During the period from 2010-11 to 2015-16 the total cropped area in Telangana state was found to decline by 16.61 percent. But during the period from 2015-16 to 2020-21 the total cropped area was recorded to be changed positively by 12.22 percent. In the entire period from 2000-01 to 2020-21 total cropped area in the state was found to increase by 5.93 percent. A wide difference was noted between change in area under cotton and the total cropped area in Telangana state. This also indicated that the cultivators allocated more land as compared to other crops in this state during the period from 2000-01 to 2020-21. In respect of India area under cotton was also found to record positive change in each of the intervals of five years during the period from 2000-01 to 2020-21. The highest increase in area under cotton in the country was noted to record 28.41 percent during the period from 2005-06 to 2010-11. A lowest increase of 1.18 percent was recorded in the same period as in the case of Telangana state. During the entire period from 2000-01 to 2020-21 area under cotton was noted to increase by 54.90 percent. So, both highest and lowest increase in area under cotton in both the Telangana state and the country were found to occur during same period of time. So far total cropped area (gross cropped area) of the country was concerned it was observed that the change did not take place in same direction in each of the intervals of five year during the entire period. Positive changes were recorded in first and second intervals of five years. But negative changes in total cropped area were recorded for third and last intervals of five years. During the entire period from 2000-01 to 2020-21 total cropped area in the country was found to decrease by 2.07 percent. The table-2 furnishes percentage share of area, production and productivity of cotton in Telangana state with respect to the country. It was observed that percentage share of area under cotton gradually increased in each interval of five years during 2000-01 to 2020-21. Percentage share of production of cotton in Telangana state was found to be highest in 2020-21. It was noted to be lowest in 2005-06. It was also found that percentage share of production of this crop in the state was lower than the percentage share of area under this crop in each of the years of five years intervals. This indicated a lower yield of cotton in Telangana as compared to the yield at country level. Yield level of this crop in each of the years of five years interval was found to support the phenomenon. In Telangana highest yield was noted to be attained in 2020-21. In this year yield of cotton in Telangana was estimated 89.15 percent of the yield at national level. The lowest yield was recorded in 2000-01. It was noted to be 98.44 percent of the yield at country level. Yield of the cotton at country level was found to be highest in 2010-11. It was lowest in 2015-16. The table-3 displays percentage change in area, production and yield of cotton in each year of five years interval. Change in area under cotton in Telangana state was found to be faster towards positive direction than that in the country as a whole. In both Telangana and India the highest increase in area under this crop was noted to be highest during the period from 2005-06 to 2010-11. A lowest increase in area under this crop was found to be recorded during the period from 2000-01 to 2005-06 in both the cases of Telangana and India. The increase in area under this crop during the period from 2000-01 to 2020-21 were found to be 288.82 percent and 54.90 respectively for Telangana and the country as a whole. The production of cotton in Telangana state was noted to increase in each of the year of five years interval and the highest increase in production was recorded during the same period as for the increase in area under this crop. But it was also observed that increase in production of this crop was greater than increase in area of this crop indicating adoption of improved package of practice by the cultivators and existence of good weather condition in Telangana state. The same phenomenon happened in other years excepting 2015-16 when increase in production was noted to be lower than the increase in area under this crop. The production of cotton in India was found to increase in each year of five years interval excepting in 2015-16. The highest increase in production was recorded during the period from 2000-01 to 2005-06. The extent of increase was noted to be 72.14 percent. A lowest increase in production to the extent of 6.17 percent was recorded during to the period from 2015-16 to 2020-21. Production of cotton was to found decline by 2.06 percent during the period from 2010-11 to 2015-16. The increase in production of cotton during the period from 2000-01 to 2020-21 were found to be 432.01 percent and 151.77 percent respectively in Telangana and the country as a whole. So far yield of cotton was concerned it was noted that yield of this crop increased in Telangana state in each of the five years interval excepting the same year as in the case of production. The highest increase in yield in this state was recorded as 22.15% during the period from 2000-01 to 2005-06. In India the yield was found to increase during the period from 2000-01 to 2005-06 and to 2010-11. A large increase to the extent of 70.14 percent was recorded during the period from 2000-01 to 2005-06. In this year increase in yield of cotton in the country was noted to be higher than that in Telangana state. But in the subsequent period increase in yield in Telangana was observed to be slightly higher than that in the country. During the entire period from 2000-01 to 2020-21 increase in yield was found to be 46.92 percent and 62.51 percent respectively in Telangana and India. The table -4 shows percentage change in cost of cultivation, cost of production of cotton in Telangana and India along with change in minimum support price of this crop at an interval of five years and in respect of the entire period of the study. It was found that cost of cultivation of this crop was higher in Telangana as compared to those in India in each of the intervals of five years. Percentage change in cost of cultivation of this crop in Telangana was found to be highest during the period from 2005-06 to 2010-11. In India this change was recorded to be highest during the same period of time as in the case of Telangana. This change was observed to gradually increase upto 2010-11. Then it declined upto 2020-21. In respect of entire time period percentage change in cost of cultivation was estimated to be higher in India than that in Telangana. So far cost of production was concerned it was found to be higher in Telangana state than in India in 2005-06, 2010-11 and in 2020-21. This was noted to be higher in India than in Telangana in 2000-01 and 2015-16. Percentage change in cost of production in Telangana was found to gradually increase in each of the intervals upto 2015-16. In last interval of time period it was noted to decline. The highest percentage of change was recorded during the period for 2010-11 to 2015-16. During the entire period this change was found to be higher in Telangana state as compared to that in India. In India this change was noted to be negative during 2000-01 and 2005-06. It was evident from the table that the highest percentage increase in minimum support price (MSP) was recorded during the period from 2005-06 to 2010-11. It was also found that the MSP/qtl in each of the intervals of time period was noted to be lower than cost of production/qtl recorded for both Telangana state and India as a whole.
Results and Discussion
Results and Discussion
Conclusion
A higher percentage increase in area under cotton as compared to increase in gross cropped area in Telangana indicated that the farmers in the state put emphasis on allocation of resources in favour of cotton crop. A relatively low level of yield or productivity of this crop in Telangana as compared to its national level productivity indicated a shortfall in resource use efficiency. Fixation of minimum support price of cotton based on at least comprehensive cost of cultivation rather than Cost A2 plus Value of family labour is suggested to encourage the farmers to allocate more resources in favour of this crop.
Figures and tables from the paper
References
2 in the original paper- Blaise D, Kranthi KR. Cotton production in India. Cotton production; 2019. p. 193-215.
- Geetha RS, Mahesh V. Minimum support prices (MSP) and its influence on cotton farming in India. Asian J. of Agri. Ext. Soc. 2019; 30(4):1-8.