
Research article · 2024 · Full text
International Journal of Research in AgronomyA study: Socio-profile survey to analyze sugarcane & maize crop diseases awareness through video visuals among farmers of Kharar Tehsil in Punjab
Volume 7(3S) · Pages 589–595 · DOI: 10.33545/2618060x.2024.v7.i3se.485 ↗
Research areasPlant Virus Research Studies
Abstract
Author-writtenThis research paper delves into the intricate interplay between the socio-profile status of farmers and the effective management of diseases affecting two vital crops, sugarcane and maize. Drawing upon comprehensive surveys and statistical analyses, to study socio-profiles of farmers, encompassing factors such as, land holdings, educational backgrounds, and Livestock holdings, agricultural scheme awareness, age groups etc. Moreover, the paper explores innovative methods to disseminate crucial information on disease management to farmers, with a particular focus on utilising video visual aids. Recognizing the limitations of traditional extension services, the research advocates for the integration of modern communication technologies to bridge the gap between scientific knowledge and practical application at the grassroots level. Through a multi-faceted approach combining qualitative interviews, quantitative data analysis, and participatory video development, the study demonstrates the efficacy of visual storytelling in enhancing farmers' understanding and adoption of disease management practices. By leveraging the power of visual mediums, such as instructional videos and digital platforms, the research endeavours to empower farmers with actionable insights to mitigate the impact of diseases on their crops. This survey concludes The percentage change is 24. Thus there was an increase in the knowledge level of farmers through the videos as demonstrations by data observations from the survey.
Summary
Source-checkedPlain-language reading of the full paper, prepared with AI and checked against the text. Each point links to the authors' own words.
Why it matters
- Sugarcane is a vital industrial crop in India, contributing 1.1% to the national GDP despite occupying only 2.57% of the gross cropped area. View evidence ↗
- Crop diseases cause significant losses, destroying approximately 10% of sugarcane areas and causing about 13% yield loss in maize fields in India. View evidence ↗
- Visual communication tools are particularly effective for farmers in areas with high illiteracy rates as they can overcome language and educational barriers. View evidence ↗
The question
- The study aimed to analyze the socio-economic profiles of farmers and evaluate how effective video visuals are for increasing awareness of sugarcane and maize crop diseases. View evidence ↗
What they did
- Researchers conducted a questionnaire-based survey with 80 randomly selected farmers from five villages in Kharar Tehsil, Punjab. View evidence ↗
- The effectiveness of the intervention was measured by questioning farmers on disease knowledge both before and after they watched instructional videos. View evidence ↗
- The study used statistical analysis, specifically calculating the mean, mean percentage, and percentage change, to evaluate the data. View evidence ↗
What they found
- The educational background of the surveyed farmers varied, with 29% being illiterate and 23% having attained a graduate degree. View evidence ↗
- Regarding housing, 75% (60 farmers) lived in permanent 'pucca' houses, while 25% (20 farmers) lived in temporary 'kaccha' houses. View evidence ↗
- The majority of the participants were small-scale farmers, with 37.5% holding 1 to 2 hectares and 32.5% holding less than 1 hectare. View evidence ↗
- A significant gap in government outreach was found, as 70% of the surveyed farmers were not enrolled in any agricultural support schemes. View evidence ↗
- The use of video visuals led to a 24% increase in the farmers' knowledge level, with the mean number of correct answers rising from 10.46 to 17.67. View evidence ↗
What it means
- The authors conclude that videos are an effective medium for providing extension education to farmers. View evidence ↗
- The authors recommend implementing policies and practices that make farming a more attractive and higher-status profession. View evidence ↗
Visual summary
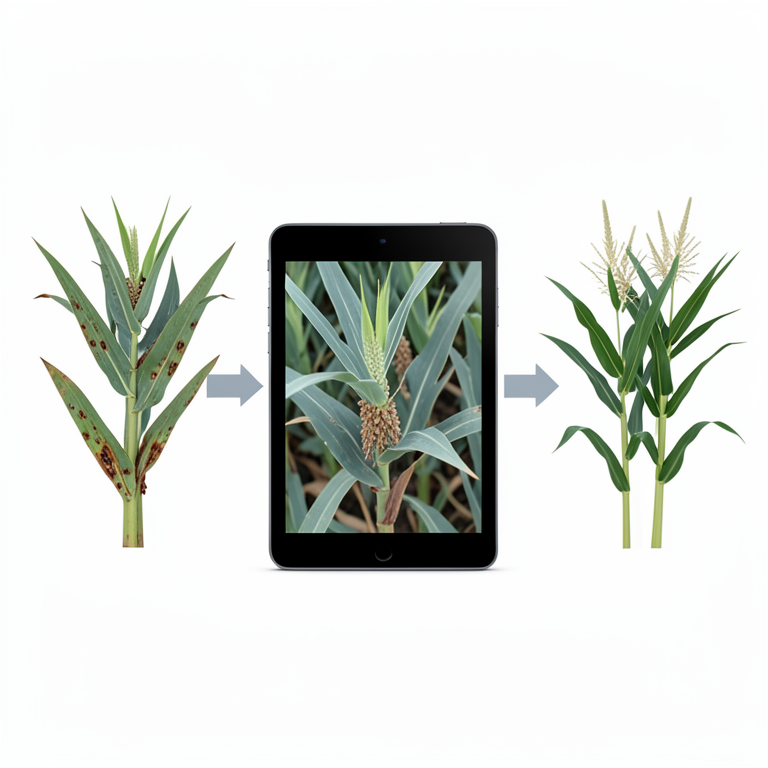
1 visualsIllustrations explain the paper; they do not show study data.
Knowledge Gain Process
AI-generated conceptual illustration (Sugarcane and maize crops). It explains the idea and does not show study data.
View source evidence ↗Figures & tables
From the original paper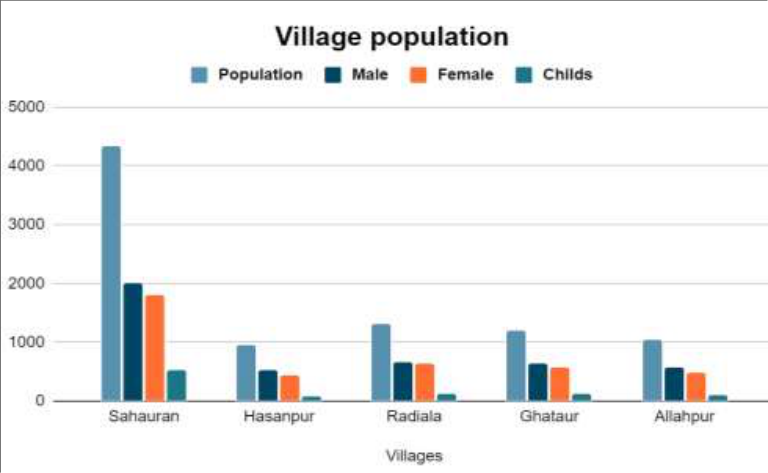 Figure 1
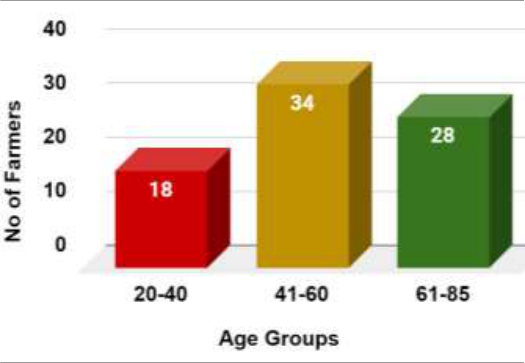 Figure 2
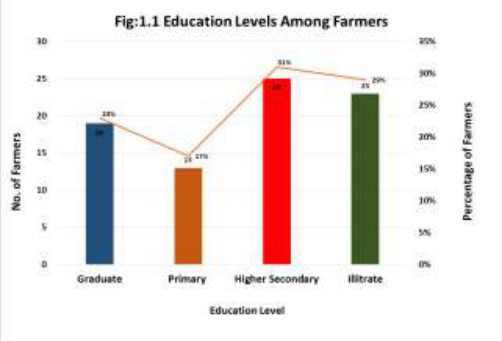 Figure 3
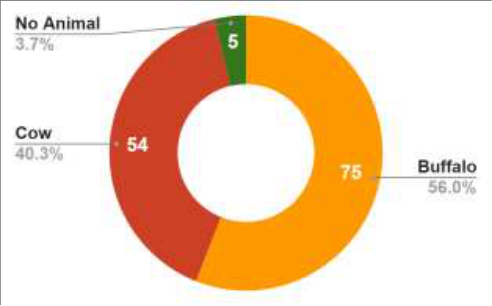 Figure 4
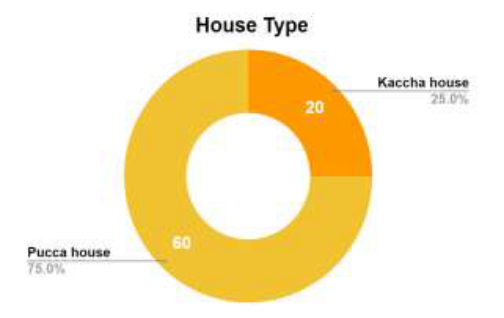 Figure 5
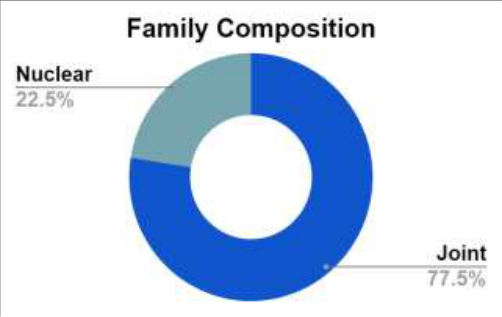 Figure 6
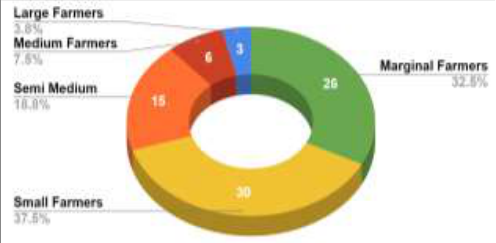 Figure 7
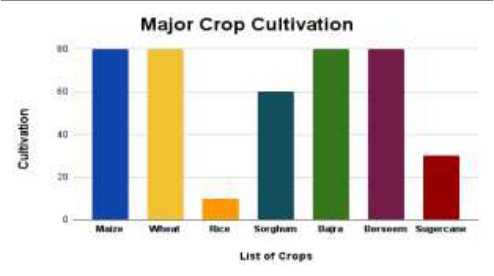 Figure 8
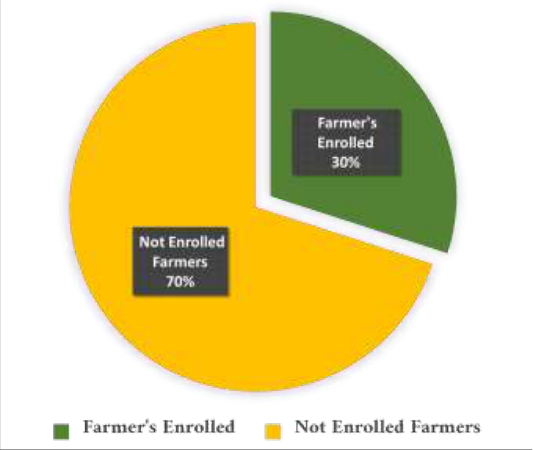 Figure 9
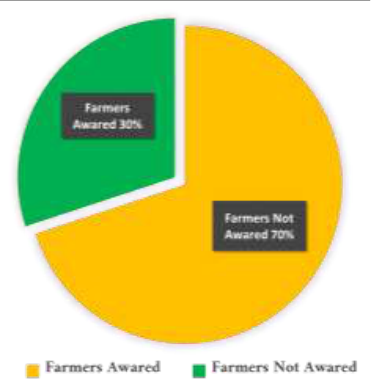 Figure 10
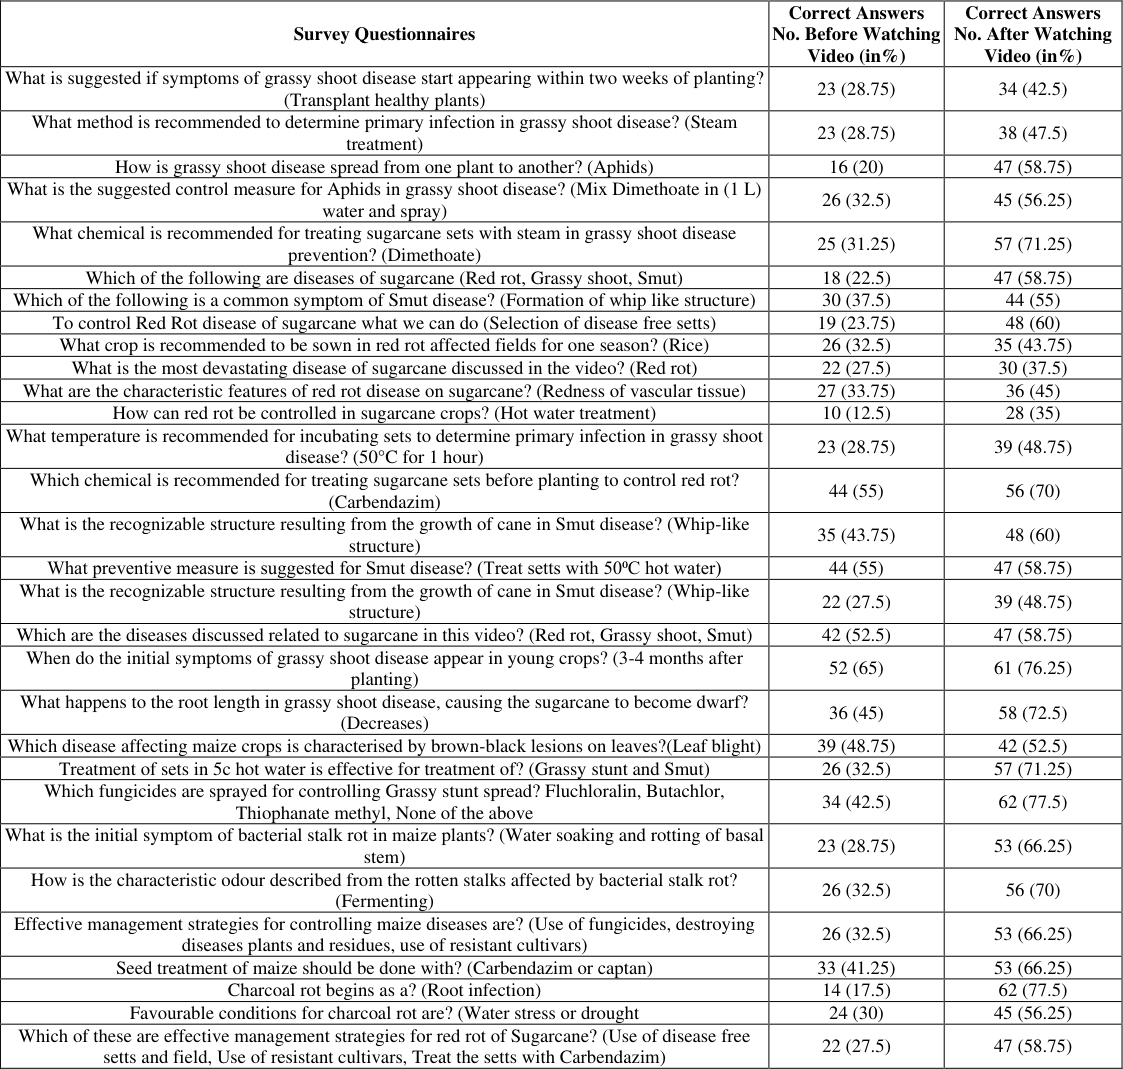 Table 1
Introduction
The Punjab state in India is agriculturally advanced with a predominance of rice-wheat farming and with the highest income of agricultural households among all states. Sugarcane and maize hold significance as key crops in the subtropical region, specifically the (NWZ) zone, encompassing states like Punjab and Haryana. In 2016-17, sugarcane cultivation in Punjab covered approximately 94 thousand hectares. (Sanghera et al., 2018) [5] . Sugarcane is the second most important industrial crop after Cotton. The crop stands in the field for 12-16 months and during this period it passes through four distinct growth phases, namely, germination, tillering, elongation and maturity. During these stages, the crop is attacked right from top to root by a number of pathogens, viz., fungi, bacteria, viruses, mycoplasma like organisms and nematodes etc. The Indian sugar industry, second largest in the world, is a key driver of rural development, supporting India's economic growth. Contribution of sugarcane to the national GDP is 1.1% which is significant considering that the crop is grown only in 2.57% of the gross cropped area. But despite all this the productivity of Sugarcane is now lower than the national average in Punjabi (Brar and Kataria, 2015) [1] . One of the reasons behind this are losses due to diseases. So it is very important to manage sugarcane from various diseases. It has been unquestionably documented that approximately 10% of the total area under sugarcane is destroyed by different pathogens. Maize (Zea mays), also called corn. It is a very important staple crop especially in the Indian context.
Maize contains about 66% carbs mainly in form of starch, 11.1% protein, and 3.6% fat (Gopalan et al., 2007) [2] . The cultivation of maize assumes even more importance due to its potential role in breaking the destructive cycle of growing paddy and wheat in rotation by most of the farmers in the state. In India studies have reported a yield loss of about 13% due to infestations by various diseases in maize fields (Indian Phytopathological Society). In this situation it becomes very important to raise the level of awareness among farmers about sugarcane and maize diseases. For this the medium of videos in the local language was used. The flexibility and ease of learning through videos is now seen as a big advantage for imparting knowledge to farmers. (Van Mele, 2011) [7] the chief objective for this study and survey was to gain knowledge on the socio economic profile of farmers in the area of study and to assess the effectiveness of videos as a tool to inform farmers. Since the socio-economic status of farmers significantly impacts their ability to adapt to new information and practices. Socio economic survey is necessary to assess the impact of video media on spreading awareness among farmers. In the context of agriculture, a socio-profile refers to a comprehensive description and analysis of the social characteristics and factors associated with individuals or communities engaged in agricultural activities. This socioprofile includes information about various social elements such as demographics, education levels, cultural practices, economic status, land ownership, and community structures. Understanding the socio-profile of agricultural stakeholders is crucial for developing targeted and effective agricultural policies, interventions, and strategies that consider the diverse social aspects influencing agricultural practices and outcomes. Video has emerged as a powerful tool for creating awareness among farmers about crop management and disease control strategies. In agricultural communities worldwide, where illiteracy rates may be high and access to formal education limited, visual mediums offer an effective means of communication that transcends language barriers and educational backgrounds. Firstly, videos provide farmers with a dynamic and engaging platform to learn about complex topics such as disease identification, prevention, and management.
Through visual demonstrations, farmers can observe real-life scenarios and practical techniques, facilitating a deeper understanding of agricultural concepts. Moreover, videos are highly adaptable to local contexts and cultural nuances. By incorporating indigenous knowledge, videos can resonate with audiences on a personal level.
Materials and Methods
The present research was planned to conduct a socio-economic survey of farmers with the objective to assess the awareness of sugarcane and maize crop diseases and their management among local farmers in Kharar tehsil, of district SAS Nagar Mohali, Punjab. The research study used a questionnaire-based technique. The research is based on primary data. The interviews with 80 farmers were recorded from the villages of Sahauran, Hasanpur, Radiala, Allahpur and Ghataur. Data was gathered through a questionnaire. These farmers were selected randomly from the village's structure and personal door-to-door interviews. The videos were also the main source of creating awareness about sugarcane and maize crop diseases, and their management among the farmers. Methods for rapid evaluation include direct observation, group talks, and personal interviews. Simple tabular analysis and statistical principle were used for analysing the data of the survey. Statistical methods are used like mean, mean% and%change to calculate the data. Mean is calculated by using formula-Sum of total no of correct answer before / total no of farmer. For Mean percentage-Mean value / Total No. of questions * 100.
Results and Discussion
Socio economic Profile of Farmer's Agriculture is the major source of economic sustenance for marginal and small farmers in this region, covered under the survey. The survey was conducted on the farmers of nearby villages of the Kharar Tehsil, District SAS Nagar, Mohali, Punjab. The Survey was conducted to know the socio economic status of the farmers. Almost all of the farmers come under the General Category. And the average family size is 6.34 of which 3.02 were females and 3.32 were males.
Source: Primary data collected through questionnaire. Education Level among Farmers Table 1.2 presents a comprehensive overview of the educational Levels among farmers, shedding light on the diverse educational backgrounds within the agricultural community. The data illustrates that 23% of the surveyed farmers have attained a graduate level of education, showcasing a substantial segment with higher academic qualifications. Additionally, 17% of respondents have completed primary education, reflecting the foundational educational level prevalent in the farming population. Notably, 31% of farmers have acquired a higher secondary education, indicating a significant proportion with intermediate educational attainment. However, the table also reveals a persistent challenge, as 29% of farmers remain illiterate, underscoring the need for targeted educational initiatives to enhance literacy rates within the agricultural sector. This breakdown of educational levels among farmers serves as a valuable resource for policymakers and educators, guiding the development.
| Survey Questionnaires | Correct Answers No. Before Watching Video (in%) | Correct Answers No. After Watching Video (in%) |
|---|---|---|
| What is suggested if symptoms of grassy shoot disease start appearing within two weeks of planting? (Transplant healthy plants) | 23 (28.75) | 34 (42.5) |
| What method is recommended to determine primary infection in grassy shoot disease? (Steam treatment) | 23 (28.75) | 38 (47.5) |
| How is grassy shoot disease spread from one plant to another? (Aphids) | 16 (20) | 47 (58.75) |
| What is the suggested control measure for Aphids in grassy shoot disease? (Mix Dimethoate in (1 L) water and spray) | 26 (32.5) | 45 (56.25) |
| What chemical is recommended for treating sugarcane sets with steam in grassy shoot disease prevention? (Dimethoate) | 25 (31.25) | 57 (71.25) |
| Which of the following are diseases of sugarcane (Red rot, Grassy shoot, Smut) | 18 (22.5) | 47 (58.75) |
| Which of the following is a common symptom of Smut disease? (Formation of whip like structure) | 30 (37.5) | 44 (55) |
| To control Red Rot disease of sugarcane what we can do (Selection of disease free setts) | 19 (23.75) | 48 (60) |
| What crop is recommended to be sown in red rot affected fields for one season? (Rice) | 26 (32.5) | 35 (43.75) |
| What is the most devastating disease of sugarcane discussed in the video? (Red rot) | 22 (27.5) | 30 (37.5) |
| What are the characteristic features of red rot disease on sugarcane? (Redness of vascular tissue) | 27 (33.75) | 36 (45) |
| How can red rot be controlled in sugarcane crops? (Hot water treatment) | 10 (12.5) | 28 (35) |
| What temperature is recommended for incubating sets to determine primary infection in grassy shoot disease? (50°C for 1 hour) | 23 (28.75) | 39 (48.75) |
| Which chemical is recommended for treating sugarcane sets before planting to control red rot? (Carbendazim) | 44 (55) | 56 (70) |
| What is the recognizable structure resulting from the growth of cane in Smut disease? (Whip-like structure) | 35 (43.75) | 48 (60) |
| What preventive measure is suggested for Smut disease? (Treat setts with 50⁰C hot water) | 44 (55) | 47 (58.75) |
| What is the recognizable structure resulting from the growth of cane in Smut disease? (Whip-like structure) | 22 (27.5) | 39 (48.75) |
| Which are the diseases discussed related to sugarcane in this video? (Red rot, Grassy shoot, Smut) | 42 (52.5) | 47 (58.75) |
| When do the initial symptoms of grassy shoot disease appear in young crops? (3-4 months after planting) | 52 (65) | 61 (76.25) |
| What happens to the root length in grassy shoot disease, causing the sugarcane to become dwarf? (Decreases) | 36 (45) | 58 (72.5) |
| Which disease affecting maize crops is characterised by brown-black lesions on leaves?(Leaf blight) | 39 (48.75) | 42 (52.5) |
| Treatment of sets in 5c hot water is effective for treatment of? (Grassy stunt and Smut) | 26 (32.5) | 57 (71.25) |
| Which fungicides are sprayed for controlling Grassy stunt spread? Fluchloralin, Butachlor, Thiophanate methyl, None of the above | 34 (42.5) | 62 (77.5) |
| What is the initial symptom of bacterial stalk rot in maize plants? (Water soaking and rotting of basal stem) | 23 (28.75) | 53 (66.25) |
| How is the characteristic odour described from the rotten stalks affected by bacterial stalk rot? (Fermenting) | 26 (32.5) | 56 (70) |
| Effective management strategies for controlling maize diseases are? (Use of fungicides, destroying diseases plants and residues, use of resistant cultivars) | 26 (32.5) | 53 (66.25) |
| Seed treatment of maize should be done with? (Carbendazim or captan) | 33 (41.25) | 53 (66.25) |
| Charcoal rot begins as a? (Root infection) | 14 (17.5) | 62 (77.5) |
| Favourable conditions for charcoal rot are? (Water stress or drought | 24 (30) | 45 (56.25) |
| Which of these are effective management strategies for red rot of Sugarcane? (Use of disease free setts and field, Use of resistant cultivars, Treat the setts with Carbendazim) | 22 (27.5) | 47 (58.75) |
Table text extracted from the original PDF; superscript letters are shown inline. The original table image is below.
View original table image
Source: Primary data collected through questionnaire
Livestock Holding
Figure 2 provides a comprehensive depiction of livestock ownership dynamics within the surveyed farmers population. The data highlights that a significant majority, comprising 68.75%, possess cows, underscoring the prevalence of bovine husbandry in the community. Moreover, the statistics reveal an even higher ownership rate for buffaloes, with 93.75% of individuals engaged in buffalo rearing activities. This discrepancy suggests a stronger inclination towards buffalo farming among the respondents. However, a noteworthy segment, constituting 6.25% of the populace, does not engage in any form of livestock husbandry. This observation hints at either alternative livelihood strategies or socioeconomic factors influencing their decision not to partake in animal husbandry practices. Overall, the findings from Figure 2 Another significant group identified in the survey includes semimedium farmers, accounting for 18.75% of the total, who possess land holdings within the range of 2 to 4 hectares. A smaller but notable proportion, comprising 7.5% of the farmers, are categorised as medium farmers, indicating land holdings between 4 to 10 hectares. The remaining 3.75% farmers were large farmers having land holding of >10 Ha.
Source: Primary data collected through questionnaire
Major Crop Cultivation
The survey of farmers conducted gives a comprehensive overview of crop cultivation practices, revealing intriguing insights into the predominant choices made by Farmers. Among the array of crops under consideration, maize & wheat emerges as a staple, with 80% of farmers actively engaged in its cultivation, Meanwhile, sorghum and bajra stand out with a 60% and 80% cultivation rate, Berseem, a forage crop, is cultivated by a substantial 80% of farmers, highlighting its role in supporting livestock and enhancing overall farm productivity. Lastly, sugarcane, a vital cash crop, commands a 30% cultivation rate, Rice, a dietary cornerstone for many, holds a notable presence with 10% of farmers dedicating their efforts to its cultivation. We all know rice is a water loving crop, the main reason for the rice cultivation is very less in this region. The level of ground water goes deep and due to the unavailability of sufficient water for the irrigation for the rice crop the rice is cultivated by 10% of the farmers.
Source: Primary data collected through questionnaire This disparity highlights a critical gap in outreach and accessibility. The remaining 30% engaged in such schemes underscores their potential impact, emphasising the need for targeted efforts to ensure equitable participation, promote awareness, and harness the full potential of government initiatives for the betterment of Indian farmers and the agricultural sector as a whole.
Source: Primary data collected through questionnaire. This survey studies indicated that the majority of the farmers are not aware of agricultural schemes. There is a need for awareness among farmers, so they can avail the benefits of those schemes.
Evaluating the Efficacy of Awareness through Video Visual
Method: The impact of awareness through video visual methods on the management of diseases in maize and sugarcane has been a pivotal focus of our survey. With a particular emphasis on maize, the video comprehensively addressed prevalent diseases such as charcoal rot, leaf blight, and stem rot. Similarly, for sugarcane, the video shed light on critical diseases including red rot, smut, and grassy shoot ratoon stunting. Prior to viewing the video, farmers were posed with questions regarding their existing knowledge of these diseases and their management practices.
Following the informative visual session, participants were again questioned about their understanding and strategies for disease control. The data collected from 30 questions posed to each farmer provided valuable insights into the efficacy of videobased awareness methods. The survey illuminated the positive influence of visual aids in enhancing farmers' comprehension of disease identification and management. This underscores the potential for such educational tools to bridge knowledge gaps, empower farmers with practical insights, and ultimately contribute to the mitigation of crop diseases in maize and sugarcane cultivation.
As agriculture embraces technology-driven awareness initiatives, the findings suggest a promising avenue for sustainable farming practices and improved crop health. The% change is 24. Thus there was an increase in the knowledge level of farmers through the videos as demonstrations by data observations from the survey. This becomes important as it opens opportunities for video lessons to supplement or in some cases replace traditional live training as providing videos is easier. Observations on similar lines about video learning have been made by Singh et al., 2018 [6] .
Conclusion
This study clearly gives us a perspective on the demographics of the majority of farmers. It is seen that the majority of Farmers belong to the General category and most of the interactions were with male farmers. These can offer valuable insights into social structures and participation in agriculture. Other than that it was seen most farmers live in joint families of which average size was 6.34. The majority of farmers fall within the age bracket of 51-60, constituting approximately 22.5% of the total. Another noteworthy segment, comprising 21.25%, belongs to the 61-70 age group. This demographic distribution underscores the prevalence of middle-aged and older individuals within the farming community. The concentration of farmers in these age ranges suggests the need for targeted agricultural policies and support mechanisms tailored to the specific challenges and requirements associated with different stages of life and have policies that motivate younger generations towards farming. Most of the farmers were literate with the illiteracy rate in line with the national average at 29% but only 23% were graduates.
Cows and buffaloes were found to be the preferred livestock.
Another important insight from the study was that 75% of Farmers live in pucca houses. All this data suggests the need for policies and practices which work to make farming a more attractive and higher profession. Also the data from the questions asked before and after showing the videos to farmers clearly demonstrates an increase in the knowledge of farmers.
Thus the survey testifies about the effectiveness of videos as a medium for imparting extension education in farmers. Overall we can conclude that the insights gained from the study can be utilised to make policies and extension strategies to spread awareness among target demographics effectively.
Figures and tables from the paper
References
4 in the original paper- Brar AK, Kataria P. Sugarcane production scenario in India with particular reference to Punjab. Indian Journal of Economics and Development. 2015;11(4):833-842.
- Maredia MK, Reyes B, Ba MN, Dabire CL, Pittendrigh B, Bello-Bravo J. Can mobile phone-based animated videos induce learning and technology adoption among low-literate farmers? A field experiment in Burkina Faso. Information Technology for Development. 2018;24(3):429-460.
- Sanghera GS, Singh RP, Singh O, Tyagi V. Initiatives for Sustainable Sugarcane Farming in Punjab. Journal of Plant Science Research. 2018;34(2):137-152.
- Singh G, Sharma A, Bagal YS. Gain in knowledge level of farmers about recommended agricultural practices after watching video films of scientific temper. 2018;6(3-4):153165.