
Research article · 2024 · Full text
International Journal of Geography Geology and EnvironmentCropping pattern in Handri river basin of Kurnool district Andhra Pradesh
Volume 6(1) · Pages 269–278 · DOI: 10.22271/27067483.2024.v6.i1d.233 ↗
Research areasAgricultural Economics and PracticesAgricultural Science and FertilizationRice Cultivation and Yield Improvement
Abstract
Author-writtenThis study aims to analyze the cropping pattern of the Handri River Basin, including crop concentration, crop diversification, crop ranking, and cropping intensity. The study is based on secondary data sources, and various methods were used to calculate the different indices. Bhatia's location quotient method was used to estimate the index of crop concentration, while Bhatia's method was used for calculating the crop diversification index. Basic statistical techniques such as percentages and averages were used to rank the crops. Mandal was chosen as the basic unit for aerial mapping to represent the cropping pattern across the entire basin. Out of the twelve crops, cotton (37%), groundnut (21.49%), red gram (14.16%), and Bengal gram (16.38%) were found to be the most widely cultivated crops in the basin. The study found that the crop diversification index was high in one mandal, medium in six mandals, and low in twelve mandals. Furthermore, the intensity of cropping was found to be high in six mandals, medium in twelve mandals, and low in one mandal.
Summary
Source-checkedPlain-language reading of the full paper, prepared with AI and checked against the text. Each point links to the authors' own words.
Why it matters
- A region's cropping pattern is shaped by a combination of geographical, climatic, socio-economic, historical, and political factors. View evidence ↗
- Analyzing crop concentration and diversification is essential for effective land use planning to optimize agricultural productivity and economic sustainability. View evidence ↗
The question
- The study aims to analyze the cropping pattern of the Handri River Basin by examining crop concentration, diversification, ranking, and cropping intensity. View evidence ↗
What they did
- The study area covers 3,548 km² in the Handri River Basin, administratively divided into 19 Mandals. View evidence ↗
- Data for the analysis were obtained from secondary sources, specifically the chief planning officer of the Kurnool district and the Kurnool Handbook of Statistics. View evidence ↗
- The researchers used Bhatia's location quotient method to determine crop concentration and diversification, while percentages and averages were used for crop ranking. View evidence ↗
- Cropping intensity was measured by dividing the cross-cropped area by the net sown area. View evidence ↗
What they found
- Cotton (37%), groundnut (21.49%), Bengal gram (16.38%), and red gram (14.16%) are the most widely cultivated crops in the basin. View evidence ↗
- Cotton is a dominant crop, occupying 146,663 hectares, which represents 36.86% of the total cultivated area. View evidence ↗
- The Handri River Basin has a low average crop diversification index of 37%. View evidence ↗
- The basin exhibits a medium average cropping intensity of 107.67%. View evidence ↗
- The highest cropping intensities were recorded in Kurnool (122.83%), Kodumur (121.61%), Maddikera (121.18%), Pattikonda (113.62%), Gonegandla (112.75%), and Devanakonda (111.23%). View evidence ↗
- Cotton is the leading crop in the basin, cultivated across eleven different mandals. View evidence ↗
Visual summary
3 visualsIllustrations explain the paper; charts are replotted from the paper's own table values.
Agricultural Analysis Framework
AI-generated conceptual illustration (Agricultural fields in the Handri river basin). It explains the idea and does not show study data.
View source evidence ↗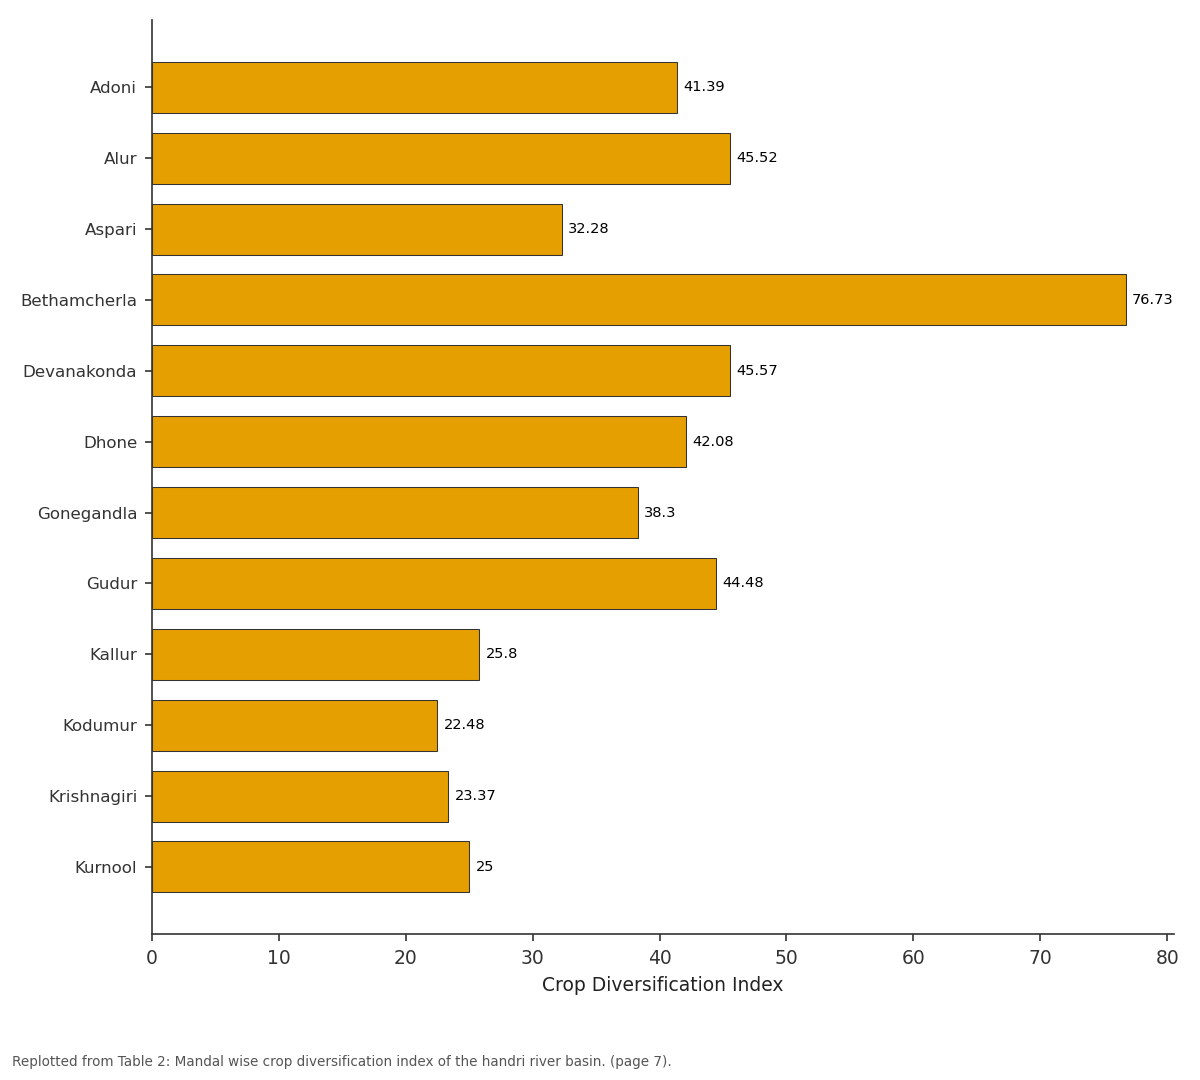
Crop Diversification Index: Adoni vs Alur vs Aspari vs Bethamcherla vs Devanakonda
Replotted from Table 2 (page 7) of the original paper. Every bar is the paper's own table value.
View source evidence ↗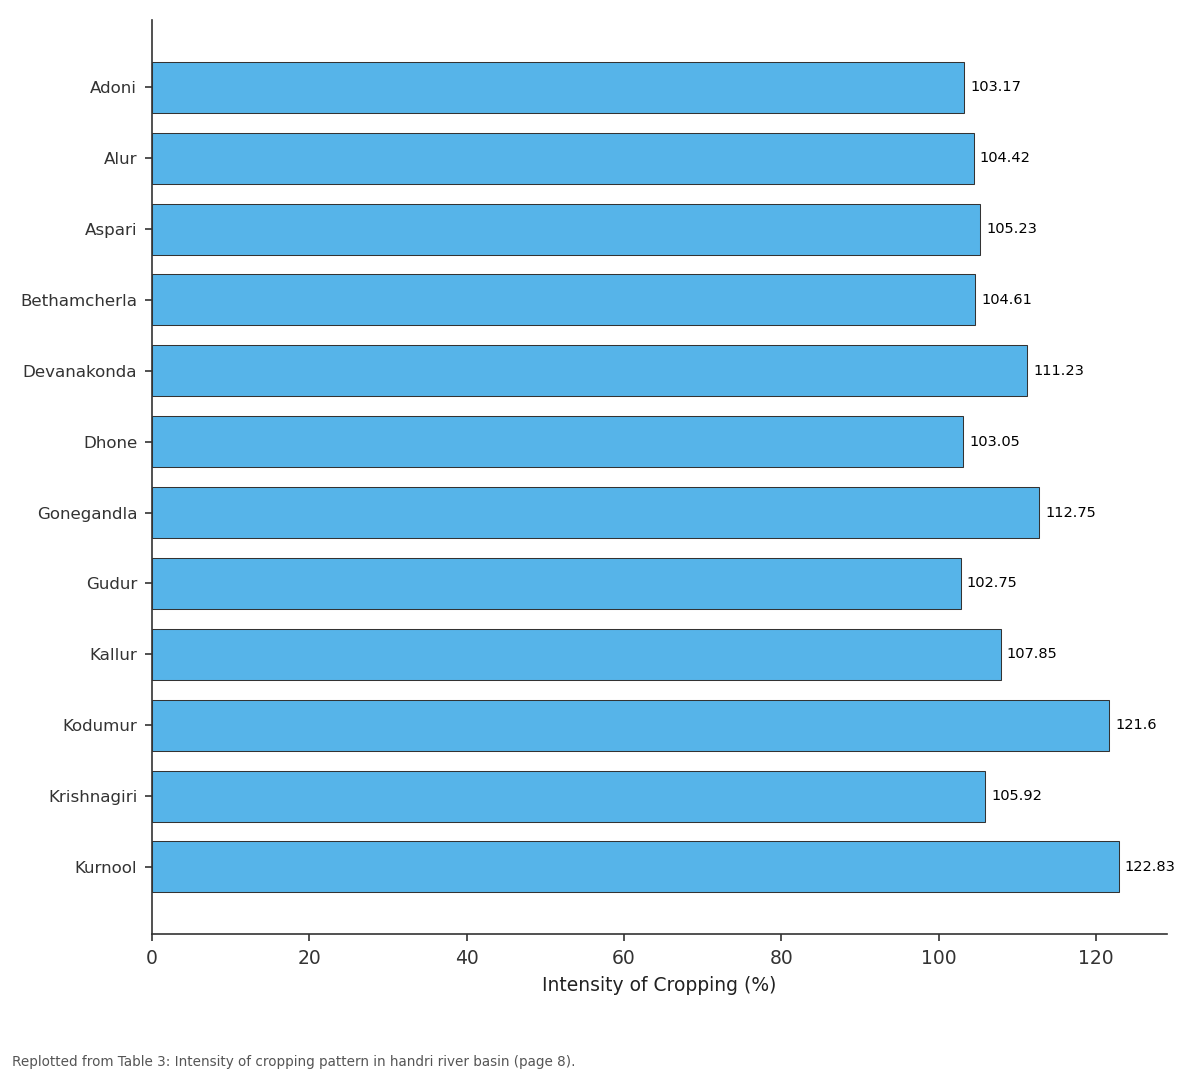
Intensity of Cropping: Adoni vs Alur vs Aspari vs Bethamcherla vs Devanakonda
Replotted from Table 3 (page 8) of the original paper. Every bar is the paper's own table value.
View source evidence ↗Figures & tables
From the original paper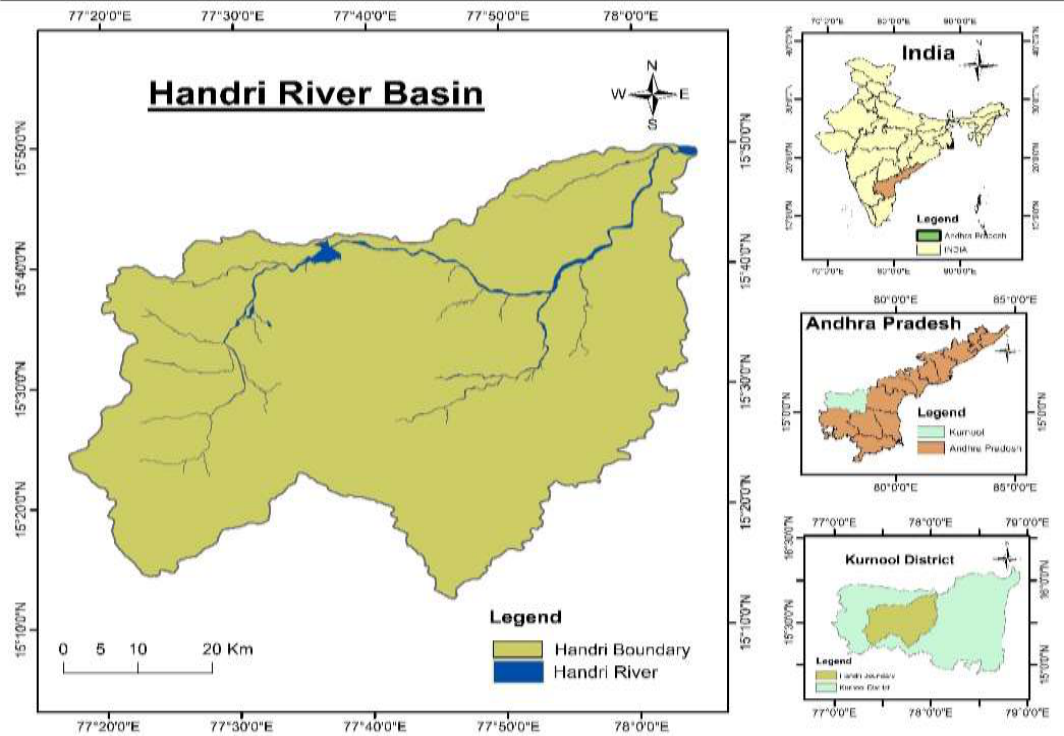 Figure 1
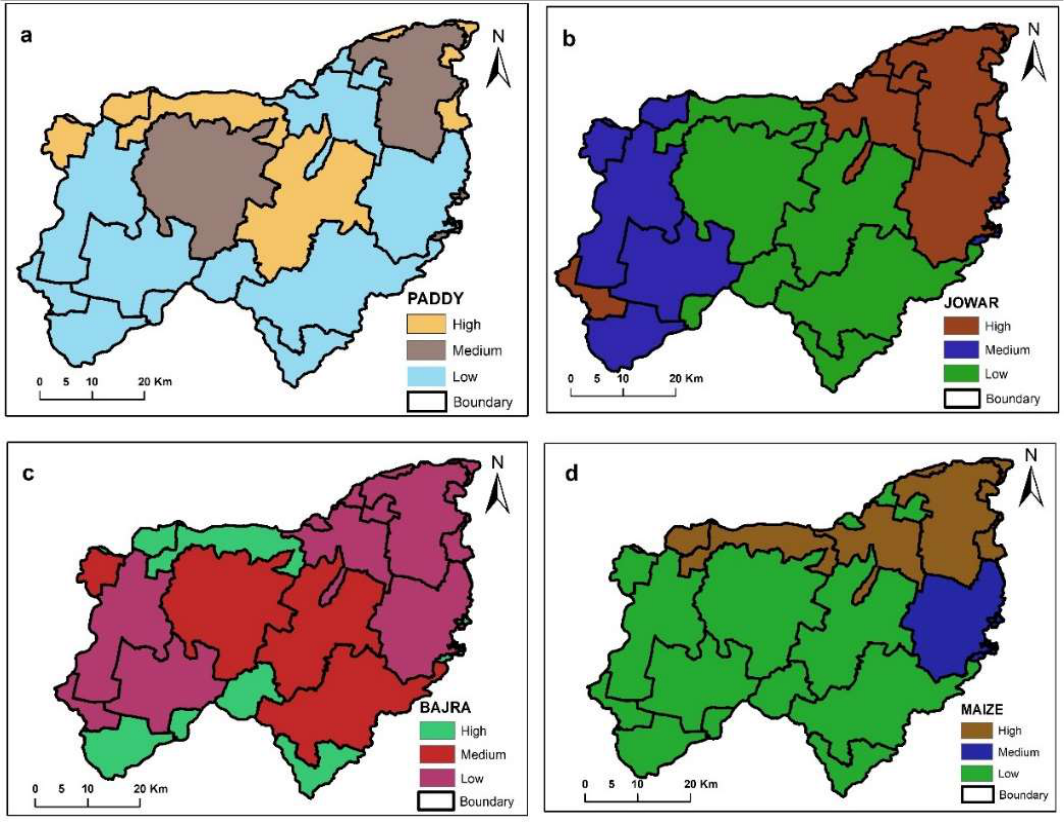 Figure 2
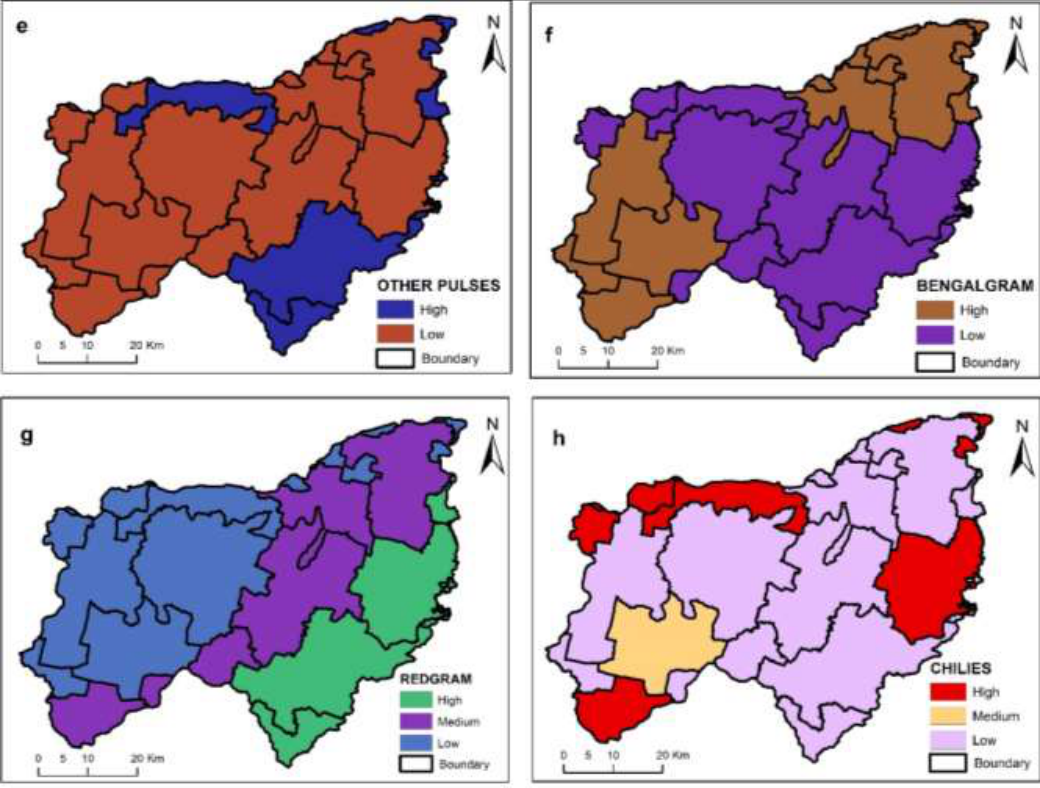 Figure 3
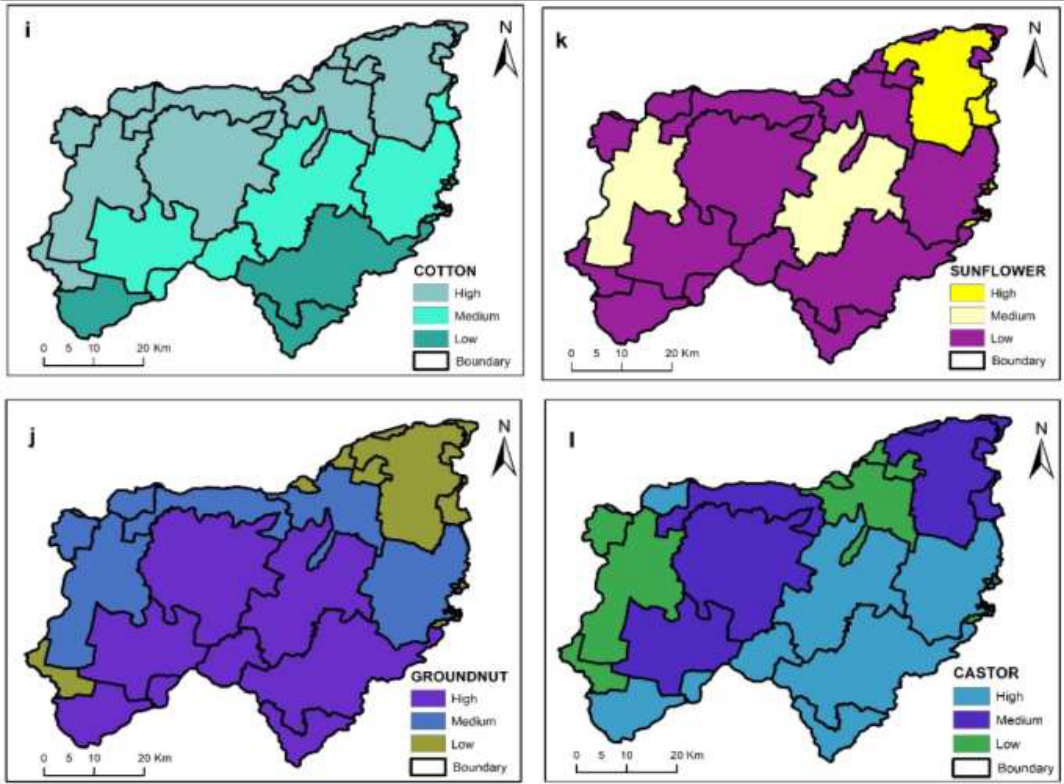 Figure 4
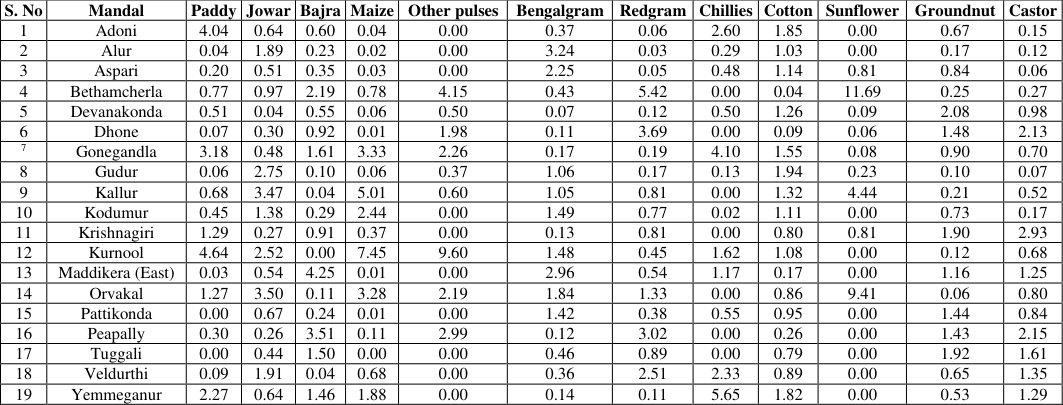 Table 1
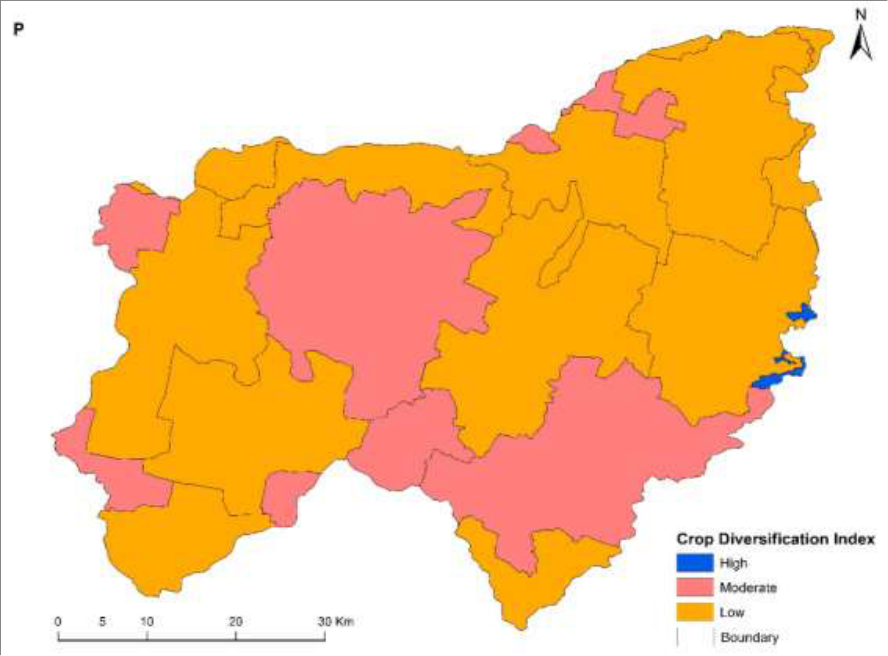 Figure 5
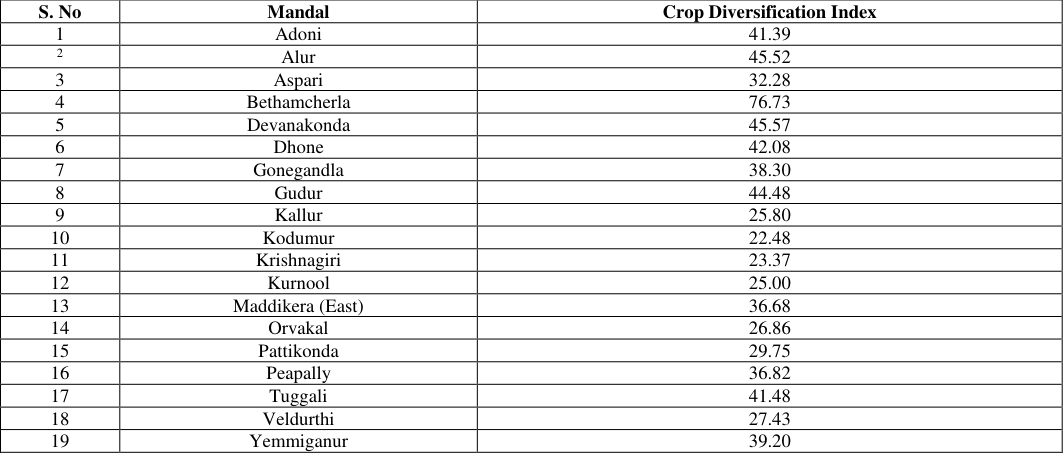 Table 2
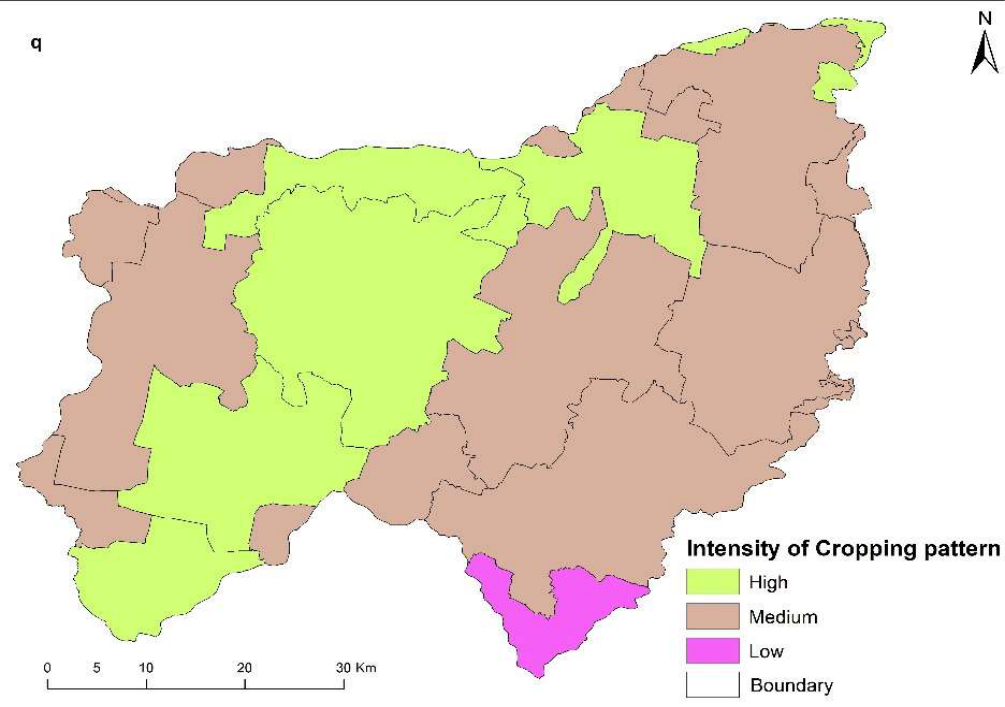 Figure 6
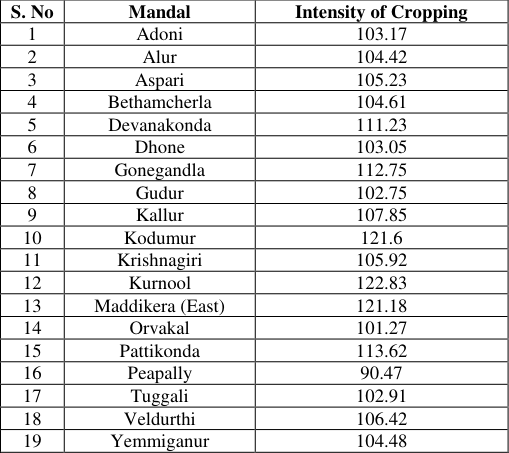 Table 3
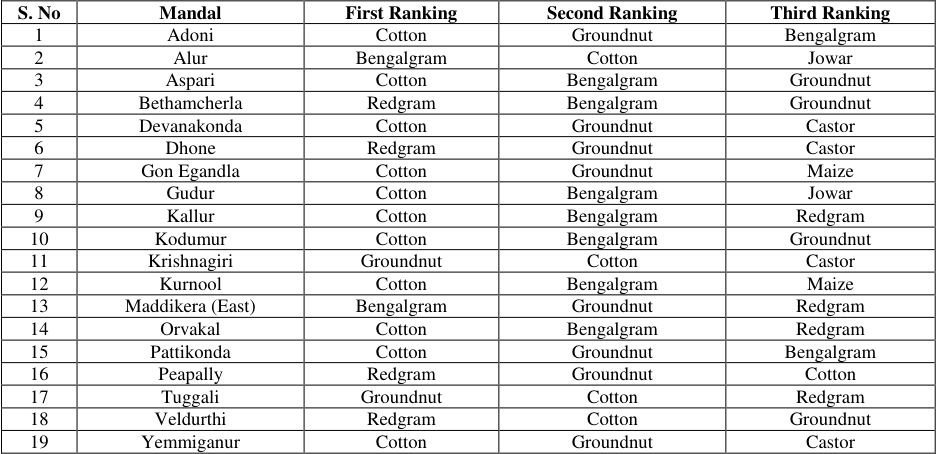 Table 4
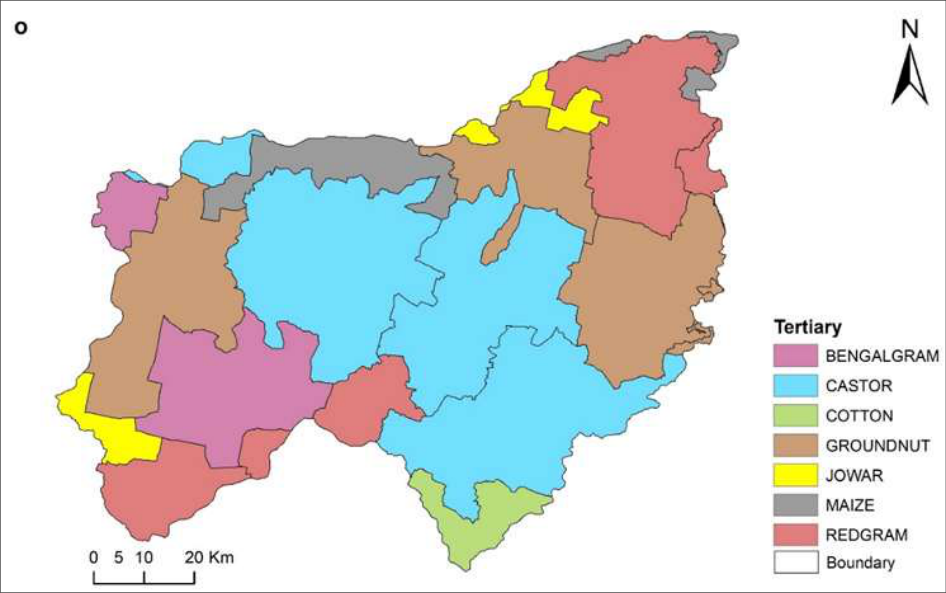 Figure 7
Introduction
The cropping pattern of a region reflects the dynamic interplay of various factors such as geographical, climatic, socio-economic, historical, and political influences. It denotes the distribution of different crops over space and time, shaped by terrain, soil, water availability, and agricultural practices like pesticide use, fertilization, and mechanization. Essentially, cropping pattern signifies the allocation of land to different crops at any given time, which evolves in response to changing needs and is influenced by natural and human factors. The alteration in cropping patterns over time serves as a barometer for agricultural development, highlighting shifts driven by socio-economic changes. Geographers have employed the location quotient method to assess the degree of crop concentration in specific regions, offering insights into crop spatial distribution and diversity. Understanding crop concentration and diversification aids in effective agricultural land use planning, which is crucial for optimizing productivity and economic sustainability. Crop concentration and diversification are pivotal aspects of agricultural geography, providing nuanced insights into the cropping patterns of a region. Crop concentration signifies the spatial density of individual crops, reflecting variations in crop distribution across different regions at a particular moment. In contrast, crop diversification entails cultivating a range of crops, either within a region or on the same agricultural plot. This approach gained significance during the Green Revolution era, aiming to revitalize agricultural economies by meeting diverse demands and enhancing income generation, including through foreign exchange earnings. Notable contributions from geographers such as Florence, Chisholm, Bhatia, and Singh have paved the way for methodologies like the quotient method to delineate agricultural regions. Recent research continues to utilize these approaches, emphasizing the importance of understanding crop concentration and diversification for informed agricultural planning and sustainable land use management. In the recent years the number of researches adopted these techniques in their research followed by Appanna (2023) [15] , Basu Roy (2014) [3] , Kashid Dhanaji Lahu (2010) [10] , Atreya Paul (2020) [1] , Goswami's. (2004) [7] , Najmul Islam Hashmi (2012) [12] , Surendra. P (2015) [13] , Dhanraj Kalu Ahire (2022) [4] , Jincy P (2018) [9] , Vahitha, T (2014) [14] , Gomathi, M (2016) [6] etc.
Study area
The study area is located in the Western region of Kurnool District. Administratively, the study area consists of 19 Mandals and covers parts of 13 Survey of India toposheets on 1:50,000 scale. The study area covered an area of 3548 km 2 . It is located between latitudes of 15°12'37'' N to 15°49 '20'' N and longitudes 77°16'49'' E to 78°04 '52 '' E (Fig 1). The mean altitude of the basin is 469.5 meters with peak and trough values, and the weather is warm and arid for a significant portion of the year. The summer period experiences intense heat, with temperatures soaring to +42° Celsius, while the winter months bring agreeable conditions, with nighttime temperatures reaching approximately 13° Celsius. The study region experiences an annual average precipitation of 665 mm. Handri River rises from the western part of the study area in Erramala hills and merges into the Tungabhadra River at Kurnool town, and the drainage pattern was found to be dendritic; the study area is distinguished by a wide range of geological formations from the Archaean period to the recent. Granite gneisses dominate the western district, while quartzites, shales, and limestones from the Cuddapah and Kurnool groups present the eastern region.
Fig 1: Location of handri river basin
Fig 1: Location of handri river basin
Methodology
The study obtained data from two secondary sources, namely the Kurnool Handbook of Statistics and the chief planning officer of the Kurnool district. To determine crop concentration for the selected crops in the study area, Bhatia's (1965) location quotient method was used. Crop diversification was calculated using the same method, and the ranking of crops was analyzed based on simple statistical methods such as percentages and averages. Cropping intensity was calculated by dividing cross-cropped area by net sown area.
Results and Discussions Paddy
The basin's total area was 5,954 hectares, which represented 1.50% of the entire cropped area. Based on the paddy crop concentration index, six mandals exhibited high concentration, three mandals showed medium concentration, and ten mandals showed low concentration. An analysis of the spatial distribution indicated that the high and medium concentrations of paddy crops were not uniformly spread throughout the entire basin. The southern and western mandals of the basin showed low concentrations. The spatial distribution of the paddy concentration, shown in fig 2(a) and Table 1.
| S. No | Mandal | Paddy | Jowar | Bajra | Maize | Other pulses | Bengalgram | Redgram | Chillies | Cotton | Sunflower | Groundnut | Castor |
|---|---|---|---|---|---|---|---|---|---|---|---|---|---|
| 1 | Adoni | 4.04 | 0.64 | 0.60 | 0.04 | 0.00 | 0.37 | 0.06 | 2.60 | 1.85 | 0.00 | 0.67 | 0.15 |
| 2 | Alur | 0.04 | 1.89 | 0.23 | 0.02 | 0.00 | 3.24 | 0.03 | 0.29 | 1.03 | 0.00 | 0.17 | 0.12 |
| 3 | Aspari | 0.20 | 0.51 | 0.35 | 0.03 | 0.00 | 2.25 | 0.05 | 0.48 | 1.14 | 0.81 | 0.84 | 0.06 |
| 4 | Bethamcherla | 0.77 | 0.97 | 2.19 | 0.78 | 4.15 | 0.43 | 5.42 | 0.00 | 0.04 | 11.69 | 0.25 | 0.27 |
| 5 | Devanakonda | 0.51 | 0.04 | 0.55 | 0.06 | 0.50 | 0.07 | 0.12 | 0.50 | 1.26 | 0.09 | 2.08 | 0.98 |
| 6 | Dhone | 0.07 | 0.30 | 0.92 | 0.01 | 1.98 | 0.11 | 3.69 | 0.00 | 0.09 | 0.06 | 1.48 | 2.13 |
| 7 | Gonegandla | 3.18 | 0.48 | 1.61 | 3.33 | 2.26 | 0.17 | 0.19 | 4.10 | 1.55 | 0.08 | 0.90 | 0.70 |
| 8 | Gudur | 0.06 | 2.75 | 0.10 | 0.06 | 0.37 | 1.06 | 0.17 | 0.13 | 1.94 | 0.23 | 0.10 | 0.07 |
| 9 | Kallur | 0.68 | 3.47 | 0.04 | 5.01 | 0.60 | 1.05 | 0.81 | 0.00 | 1.32 | 4.44 | 0.21 | 0.52 |
| 10 | Kodumur | 0.45 | 1.38 | 0.29 | 2.44 | 0.00 | 1.49 | 0.77 | 0.02 | 1.11 | 0.00 | 0.73 | 0.17 |
| 11 | Krishnagiri | 1.29 | 0.27 | 0.91 | 0.37 | 0.00 | 0.13 | 0.81 | 0.00 | 0.80 | 0.81 | 1.90 | 2.93 |
| 12 | Kurnool | 4.64 | 2.52 | 0.00 | 7.45 | 9.60 | 1.48 | 0.45 | 1.62 | 1.08 | 0.00 | 0.12 | 0.68 |
| 13 | Maddikera (East) | 0.03 | 0.54 | 4.25 | 0.01 | 0.00 | 2.96 | 0.54 | 1.17 | 0.17 | 0.00 | 1.16 | 1.25 |
| 14 | Orvakal | 1.27 | 3.50 | 0.11 | 3.28 | 2.19 | 1.84 | 1.33 | 0.00 | 0.86 | 9.41 | 0.06 | 0.80 |
| 15 | Pattikonda | 0.00 | 0.67 | 0.24 | 0.01 | 0.00 | 1.42 | 0.38 | 0.55 | 0.95 | 0.00 | 1.44 | 0.84 |
| 16 | Peapally | 0.30 | 0.26 | 3.51 | 0.11 | 2.99 | 0.12 | 3.02 | 0.00 | 0.26 | 0.00 | 1.43 | 2.15 |
| 17 | Tuggali | 0.00 | 0.44 | 1.50 | 0.00 | 0.00 | 0.46 | 0.89 | 0.00 | 0.79 | 0.00 | 1.92 | 1.61 |
| 18 | Veldurthi | 0.09 | 1.91 | 0.04 | 0.68 | 0.00 | 0.36 | 2.51 | 2.33 | 0.89 | 0.00 | 0.65 | 1.35 |
| 19 | Yemmeganur | 2.27 | 0.64 | 1.46 | 1.88 | 0.00 | 0.14 | 0.11 | 5.65 | 1.82 | 0.00 | 0.53 | 1.29 |
Table text extracted from the original PDF; superscript letters are shown inline. The original table image is below.
View original table image
Jowar
The study area has a total jowar crop of around 8,277 hectares, which accounts for 2.08% of the total cropped area. Jowar concentration is high in seven mandals, while six mandalas have medium and also low concentration is noticed in Six mandals. According to spatial analysis, jowar concentration is high in the northeastern part of the basin, medium in western mandals, and low in central mandals. The spatial distribution of paddy concentration is shown in Fig 2 (b) and Table 1.
Bajra
The study area has a total cropped area of 5,573 hectares dedicated to the growth of bajra, representing 1.40% of the total cropped area. The analysis of the concentration index reveals that there are six mandals with high concentration, four mandalas with medium concentration, and nine mandalas with low concentration. The spatial distribution analysis highlights that the mandals of Yemmiganur, Gonegandla, Maddikera, Tuggali, and Peapully have a high concentration of bajra cultivation. Moreover, the central mandals of the basin have a medium concentration of bajra cultivation, while the northeastern and western mandals have a low concentration. Fig 2 (c) and Table 1 depict the spatial distribution of bajra concentration.
Maize
The study conducted has found that maize cultivation covers a total cropped area of 5,822 hectares, which accounts for 1.46% of the total cultivated area in the basin. Six mandals show a high concentration of maize crops, while eleven mandals show a medium concentration. Two mandals exabits low concentration. The northeastern mandals of the basin exhibit a notably high concentration of maize crops, while only two mandals, veldurthi and bethamcherla, show a medium concentration. On the other hand, the central and southern mandals of the basin show a low concentration of maize crops. The spatial distribution of crop concentration is illustrated in Fig 2 (d) and Table 1.
Other pulses
The total cropped area used for growing other pulses in the basin is 182 hectares, which makes up only 0.04% of the total cropped area. The highest crop concentrations for other pulses were recorded in Bethamcherla (4.15), Dhone (1.98), and Gonengandla (2.26), Kurnool (9.60), Orvakal (2.19) and Peapully (2.99) while Kallur Mandal had a medium degree of concentration (0.60). The lowest degree of concentration was found in Devanakonda (0.50) and Gudur (0.37) Mandal, and there was no concentration in 10 Mandal. The spatial distribution analysis revealed that other pulse concentration was high in Gonegandla, Orvakal, Dhone, Bethamcherla, and Peapully, while the western, central, and northeastern Mandal had low concentrations. Fig 3 (e) and Table 1 show the spatial distribution of other pulse concentrations.
Bengal gram
The cultivated area dedicated to Bengal gram is 65185 hectares, constituting 16.83% of the total cultivated area. Nine mandals show a high concentration of Bengal gram cultivation, while ten mandals show a low concentration. Spatial analysis indicates that the northeastern and western mandals of the basin have a high concentration of Bengal gram crops. On the other hand, the basin's central and eastern southern mandals show a low concentration. A map showing the spatial distribution of Bengal gram concentration is available in Figure 3 (f) and Table . 1.
Red gram
The cropped area of red gram in the basin is 56,370 hectares, which makes up 14.16% of the total cropped area. In five mandals, red gram concentration is very high, while in five mandals it is moderately concentrated, and in nine mandals, it is low. Based on spatial analysis, the southeastern part of the basin has a high concentration of red gram. Meanwhile, central and southern mandals in the northeast of the basin have a moderate concentration, and western mandals have a low concentration of red gram the spatial distribution of red gram concentration shows in fig 3 (g) and table 1.
Chillies
The cultivation area for chilies is 2123 hectares, which accounts for 0.53% of the total cultivated area of chilies in the concentrated area. This area is mainly found in Adoni (2.60), gonegandla (4.50), Kurnool (1.62), maddikera (1.17), velurthi (2.23), and Yemmiganur (5.56). The concentration of this crop is medium in pattikonda (0.55), and the lowest concentration is found in five mandals. In seven mandals, there is no concentration of this crop. Chilies crop concentration is notably high in Adoni, Yemmiganur, Gonegandla, Orvakal, Veldurthi, and Maddikera mandals of the basin. The concentration of this crop is medium in only one Pattikonda mandal. The central, southern, and northeastern mandals of the basin have the lowest concentration of this crop. The spatial distribution of crop concentration is presented in figure 3 (h) and table 1.
Cotton
The cultivation of cotton occupies 146663 hectares of land, which accounts for 36.86% of the total cultivated area. Cotton is a significant crop in the study region. Out of the Nineteen mandals evaluated, a high degree of cotton concentration was observed in ten, while five showed a medium degree of concentration. The remaining four mandals had a low degree of concentration. An analysis of the spatial distribution revealed that northern and northeastern mandals had a high concentration of cotton. Pattikonda, Krishnagiri, Veldurthi, and Tuggali mandals in the basin had a medium concentration. In a few southern parts of the basin, a low concentration was observed. Fig 4 (i) and Table 1 illustrate the spatial distribution of cotton concentration.
Sunflower
The sunflower crop is cultivated in 287 hectares, which accounts for 0.07% of the total cultivated area. The cultivation of sunflowers is concentrated in three mandals and moderately concentrated in two mandal. There is a low concentration in four mandals in the basin. In ten mandal these concentration is nil. Spatial analysis indicates that the highest concentration is in two mandals, namely Kalluru and Orvakal mandals. On the other hand, except for five mandals, the entire basin has a medium concentration of sunflower cultivation. The spatial distribution of sunflower concentration can be observed in Fig 4 (k) and Table 1.
Groundnut
The area of land used for groundnut cultivation is 85514 hectares, which accounts for 21.49% of all agricultural land. Seven mandals show a high concentration of groundnuts, while six have a medium concentration and six have a low concentration, according to the concentration index analysis. The central and southern mandals have a high concentration of groundnuts, as per the results of spatial analysis. On the other hand, those in the northern and eastern regions have a medium concentration, while the northeastern and southwestern mandals have a low concentration of groundnuts. The spatial distribution of groundnut concentration is depicted in Fig 4 (j) and Table 1.
Castor
The study that has been conducted shows that castor cultivation is carried out on around 15874 hectares of land in the basin, which makes up 4% of the total cropped area. An analysis of the concentration index reveals that the concentration of castor is high in seven mandals, medium in six mandals, and low in six mandals with a low concentration in the basin. The basins eastern and some southern mandals have a notably high concentration of castor crop, while the northeastern and western mandals have a medium concentration. Castor crop concentration is low in Gudur, Kodumur, Adoni, Alur and Aspari. Fig 4 (i) and Table 1 show the spatial distribution of crop concentration In only one mandal, Bethamcherla, a high level of crop diversification of over 60% is noticed, while the remaining mandals exhibit a medium or low level of crop diversification. The mandals with medium crop diversification index, ranging from 40% to 60%, are Adoni, Dhone, Gudur, and Tuggali. The spatial distribution of the medium crop diversification index is unevenly distributed in the entire basin, as shown in Figure 5 (p) and Table 2.
| S. No | Mandal | Crop Diversification Index |
|---|---|---|
| 1 | Adoni | 41.39 |
| 2 | Alur | 45.52 |
| 3 | Aspari | 32.28 |
| 4 | Bethamcherla | 76.73 |
| 5 | Devanakonda | 45.57 |
| 6 | Dhone | 42.08 |
| 7 | Gonegandla | 38.30 |
| 8 | Gudur | 44.48 |
| 9 | Kallur | 25.80 |
| 10 | Kodumur | 22.48 |
| 11 | Krishnagiri | 23.37 |
| 12 | Kurnool | 25.00 |
| 13 | Maddikera (East) | 36.68 |
| 14 | Orvakal | 26.86 |
| 15 | Pattikonda | 29.75 |
| 16 | Peapally | 36.82 |
| 17 | Tuggali | 41.48 |
| 18 | Veldurthi | 27.43 |
| 19 | Yemmiganur | 39.20 |
Table text extracted from the original PDF; superscript letters are shown inline. The original table image is below.
View original table image
Twelve mandals, namely Aspari, Gonegandla, Kallur, Kodumur, Krishnagiri, Kurnool, Peapully, Veldurthi, and Yemmiganur, exhibit a low level of crop diversification, which is less than 40%. A low crop diversification index is observed in the northeastern and western mandals of the basin. Figure 5 (p) and Table 2 illustrate the spatial distribution of the low crop diversification index. The average crop diversification index of the Handri River Basin is 37%, indicating a low diversification.
Intensity of cropping
The cropping intensity is a measure of how intensively a unit of land is used for agricultural purposes. It refers to the number of crops grown in an area at a particular time, with high intensity indicating maximum land usage and vice versa. Devanakonda (111.23%), Gonegandla (112.
Ranking of crops First ranking crops regions Cotton crop region
The basin cultivates cotton crop as its leading crop, which is spread across eleven mandals namely Adoni, Aspari, Devanakonda, Gonegandla, Gudur, Kallur, Kodumur, Kurnool, Orvakal, Pattikonda, and Yemmiganur. The distribution of these mandals is predominantly concentrated in the north, northwestern, and northeastern parts of the basin.
Red gram region:
Red gram is grown extensively in the four mandals that were studied, namely Bethamcherla, Done Peapully, Veldurthi, and Dhone. It is the second most important crop cultivated in the region. The cultivation of red gram was found to be limited to only these four mandals.
Bengal gram and groundnut crop regions
These are too tiny in their extent as they comprise two mandals each, i.e., bengalgram is Alur, and maddikera mandals are groundnut in Krishanagriri and Tugggali mandal of the basin.
Second ranking crops regions
Three crops were identified as second-ranking crop regions, with groundnuts being the most important, cultivated in eight mandals in the basin. Bengal gram is the second most important second-ranking crop in the region, grown in seven mandals in the basin. Cotton is the third most important second-ranking crop in the region, grown in four mandals.
The distribution of groundnut is concentrated primarily in the southeast north and a few mandals of the southwestern part of the basin. The cultivation of Bengal gram was recorded in the northeast and one mandal in the western part of the basin.
Third raking crop regions: Seven different crops were discovered in the basin, which is among the regions that rank third in crop production for 2021-22. The top three crops produced in the third-ranking areas were groundnut castors and red gram, followed by Bengal gram in two mandals, jowar in two mandals, maize in two mandals, and cotton in one mandal. The distribution of these third-ranking crop areas throughout the basin is not uniform.
Conclusion
The comprehensive analysis of the agricultural landscape within the Handri River Basin reveals a complex interplay of factors influencing crop concentration, diversification, and cropping intensity. Spanning a vast area of 398,232 hectares, the basin showcases a diverse array of crops, including staples like paddy, jowar, maize, and bajra, alongside pulses such as red gram and Bengal gram, as well as cash crops like cotton, chillies, groundnut, castor, and sunflower. Spatial distribution patterns highlight regional concentrations, with certain crops exhibiting high concentrations in specific mandals, particularly in the northeastern regions for maize, jowar, and red gram, and northern, northwestern, and northeastern areas for cotton. However, significant variations in crop diversification are observed, with Bethamcherla standing out for its high diversification level, while the majority of mandals demonstrate medium to low levels, particularly in the northeastern and western regions. Cropping intensity also varies across mandals, indicating differing degrees of land utilization for agricultural purposes, with some mandals exhibiting high intensity surpassing 110%, predominantly situated in the northern and southern regions, while others demonstrate moderate intensity ranging from 101% to 107%, distributed across eastern and western areas, with Peapully standing out as the only mandal with low cropping intensity. These concentration patterns likely reflect a combination of environmental, socio-economic, and historical factors, emphasizing the importance of understanding regional agricultural dynamics for informed
Acknowledgement
decision-making in agricultural planning, resource allocation, and policy formulation within the Handri River Basin.
Figures and tables from the paper
| S. No | Mandal | Intensity of Cropping |
|---|---|---|
| 1 | Adoni | 103.17 |
| 2 | Alur | 104.42 |
| 3 | Aspari | 105.23 |
| 4 | Bethamcherla | 104.61 |
| 5 | Devanakonda | 111.23 |
| 6 | Dhone | 103.05 |
| 7 | Gonegandla | 112.75 |
| 8 | Gudur | 102.75 |
| 9 | Kallur | 107.85 |
| 10 | Kodumur | 121.6 |
| 11 | Krishnagiri | 105.92 |
| 12 | Kurnool | 122.83 |
| 13 | Maddikera (East) | 121.18 |
| 14 | Orvakal | 101.27 |
| 15 | Pattikonda | 113.62 |
| 16 | Peapally | 90.47 |
| 17 | Tuggali | 102.91 |
| 18 | Veldurthi | 106.42 |
| 19 | Yemmiganur | 104.48 |
Table text extracted from the original PDF; superscript letters are shown inline. The original table image is below.
View original table image
| S. No | Mandal | First Ranking | Second Ranking | Third Ranking |
|---|---|---|---|---|
| 1 | Adoni | Cotton | Groundnut | Bengalgram |
| 2 | Alur | Bengalgram | Cotton | Jowar |
| 3 | Aspari | Cotton | Bengalgram | Groundnut |
| 4 | Bethamcherla | Redgram | Bengalgram | Groundnut |
| 5 | Devanakonda | Cotton | Groundnut | Castor |
| 6 | Dhone | Redgram | Groundnut | Castor |
| 7 | Gon Egandla | Cotton | Groundnut | Maize |
| 8 | Gudur | Cotton | Bengalgram | Jowar |
| 9 | Kallur | Cotton | Bengalgram | Redgram |
| 10 | Kodumur | Cotton | Bengalgram | Groundnut |
| 11 | Krishnagiri | Groundnut | Cotton | Castor |
| 12 | Kurnool | Cotton | Bengalgram | Maize |
| 13 | Maddikera (East) | Bengalgram | Groundnut | Redgram |
| 14 | Orvakal | Cotton | Bengalgram | Redgram |
| 15 | Pattikonda | Cotton | Groundnut | Bengalgram |
| 16 | Peapally | Redgram | Groundnut | Cotton |
| 17 | Tuggali | Groundnut | Cotton | Redgram |
| 18 | Veldurthi | Redgram | Cotton | Groundnut |
| 19 | Yemmiganur | Cotton | Groundnut | Castor |
Table text extracted from the original PDF; superscript letters are shown inline. The original table image is below.
View original table image
References
11 in the original paper- Paul A. Analysis the Pattern and Role of Crop Concentration and Diversification in Different Blocks of South 24 Pargana District, West Bengal. SSRG International Journal of Agriculture & Environmental Science (SSRG-IJAES). 2020;7(5):58-71.
- Bhatia. Pattern of crop concentration and Diversification in India. Economic Geography. 1965;41(1):39-56.
- Roy B. Crop Concentration and Diversification in Jalpaiguri District of West Bengal: A Case Study. International Journal of Food, Agriculture and Veterinary Sciences. 2014;4(3):05-09.
- Gomathi M, Kumaraswamy K. Patterns of Crop Concentration and Diversification in Aiyar Basin, Central Tamil Nadu. Punjab Geographers. 2016;12:98112.
- Jincy P. Patterns of Crop Concentration and Diversification of Kongu Uplands, Tamil Nadu, India. Research Review International Journal of Multidisciplinary. 2018;7(03):72-79.
- Kashid Dhanaji Lahu. Crop Concentration in Sindhudurg District: A Geographical Analysis. Geoscience Research. 2010;1(2):28-33.
- Majid Husain. Systematic Agricultural Geography. Reprinted 2004. Jaipur and New Delhi: Rawat Publication; c1996. p. 217-218.
- Najmul Islam Hashmi. Pattern of crop concentration and Diversification in Upper Ganga Yamuna Doab. International Journal of Innovative Research & Development. 2012;1(5):481-496.
- Surendra. Pattern of Crop Concentration in Mandya District. Journal of International Academic Research For Multidisciplinary. 2015;3(10):29-35.
- Vahitha T, Murugannadam R, Ruthravel Murthy K, Kumaraswamy K. Cropping Pattern in Noyyal River Basin, Tamil Nadu, A case study using GIS Technology. Journal of the Swamy Botanical Club. 2014;31:05-14.
- Appanna B, Sujatha Y. Crop Regions in Tungabhadra River basin in Kurnool district, Andhra Pradesh. The Deccan Grographer. 2022;61(3):178-190.