
Research article · 2024 · Full text
International Journal of Agriculture Extension and Social DevelopmentSources of information used by the farmers of the pulse based cropping system of Chhattisgarh plains
Volume 7(3) · Pages 568–571 · DOI: 10.33545/26180723.2024.v7.i3g.471 ↗
Research areasAgricultural Economics and PracticesAgricultural Science and FertilizationAgricultural Systems and Practices
Abstract
Author-writtenThe study was conducted on 320 pulse-based cropping system practicing farmers in the Chhattisgarh Plains to ascertain their communicational characteristics. Selected pulse growing farmers have been interviewed personally with the help of a well-structured and pre-tested interview schedule. The study shows that the majority of respondents fall under the age group of 36 to 50 years, were educated up to middle school, belonged to other backward classes, resided with up to medium family members, and had membership in more than one organization. Majority of the respondents were engaged in agriculture as their main occupation; although many farmers were also engaged in secondary occupations to support their families. In addition, the respondents were also engaged in agricultural labor, non-agricultural labor, and animal husbandry. It was found that, despite short-term credit-seeking behavior, the average family income was up to ?200000 annually. Friends, family, and progressive farmers farmers were the primary sources of information for the majority of respondents regarding agricultural technologies due to their higher credibility and relationship with RAEOs.
Summary
Source-checkedPlain-language reading of the full paper, prepared with AI and checked against the text. Each point links to the authors' own words.
Why it matters
- Pulses serve as an essential, low-cost protein source in the daily diets of people in India. View evidence ↗
- India is a major global player in pulse production, accounting for more than 25% of the world's pulse basket. View evidence ↗
The question
- The study aimed to analyze the sources of information and communication characteristics of farmers growing pulses in the Chhattisgarh Plain. View evidence ↗
What they did
- The research was conducted across 32 randomly selected villages within eight blocks of four primary pulse-growing districts in the Chhattisgarh Plains. View evidence ↗
- Data was collected through personal interviews using a predesigned interview schedule to ensure accuracy. View evidence ↗
What they found
- Rural Agricultural Extension Officers (RAEOs) were the top source of information, used by 66.56% of respondents. View evidence ↗
- Other highly utilized sources included friends (43.12%), progressive farmers (42.50%), and Kisan Mitras (42.18%). View evidence ↗
- The least used sources of information were Kisan Call Centers (5.31%) and newspapers (6.87%). View evidence ↗
- Most respondents (70.31%) had a medium level of information source utilization, while 18.13% had a high level and 11.56% had a low level. View evidence ↗
- Progressive farmers were the most trusted source of information, with a credibility rating of 98%. View evidence ↗
- Cooperative societies had the lowest credibility among the listed sources at 62.5%. View evidence ↗
- Over half of the participants (52.19%) interacted with RAEOs on a monthly basis. View evidence ↗
- Approximately 79.70% of the respondents maintained a medium level of interaction with extension personnel. View evidence ↗
What it means
- The authors conclude that friends, family, and progressive farmers are primary information sources because of their high credibility and their relationships with RAEOs. View evidence ↗
Visual summary
2 visualsIllustrations explain the paper; charts are replotted from the paper's own table values.
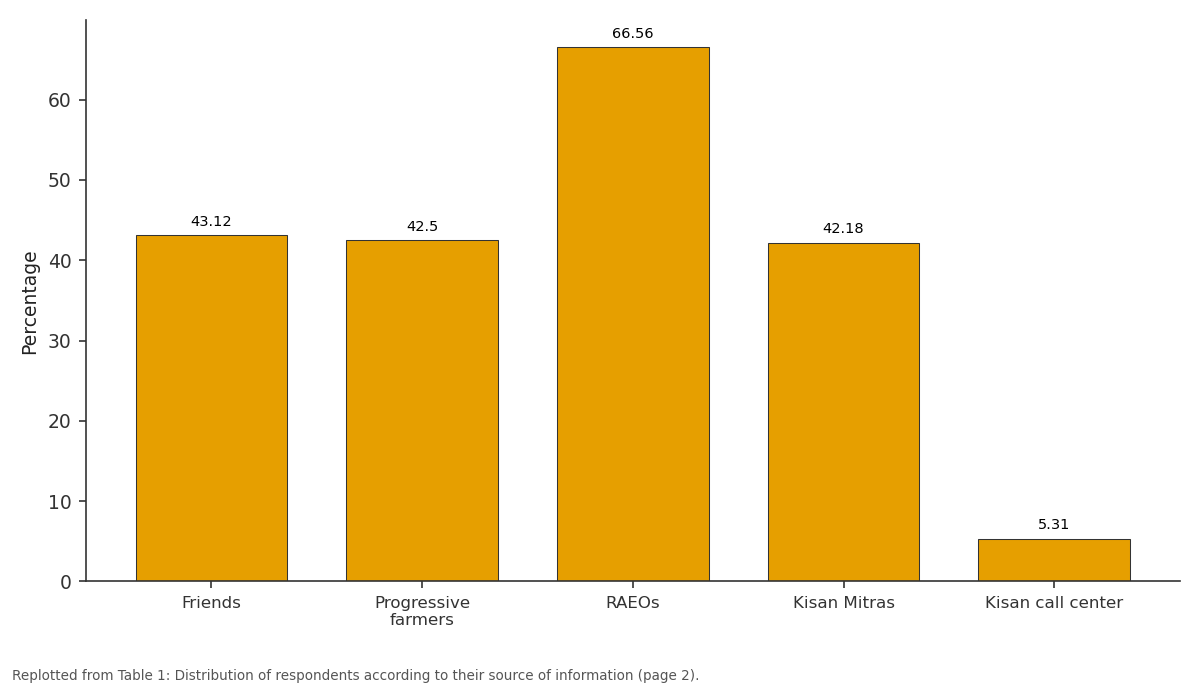
Percentage: Friends vs Progressive farmers vs RAEOs vs Kisan Mitras vs Kisan call center
Replotted from Table 1 (page 2) of the original paper. Every bar is the paper's own table value.
View source evidence ↗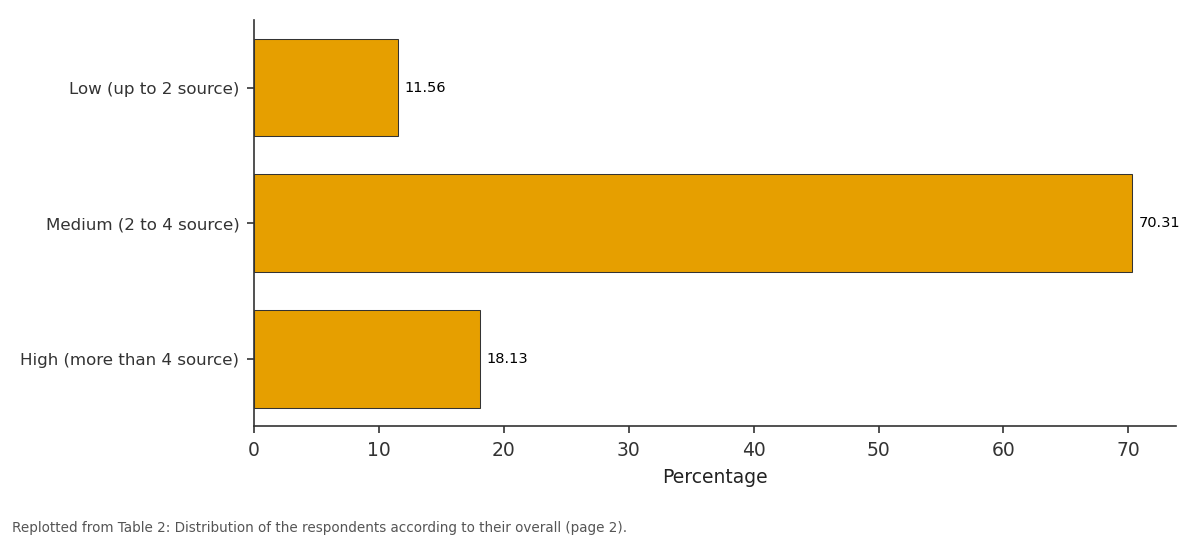
Percentage: Low (up to 2 source) vs Medium (2 to 4 source) vs High (more than 4...
Replotted from Table 2 (page 2) of the original paper. Every bar is the paper's own table value.
View source evidence ↗Figures & tables
From the original paper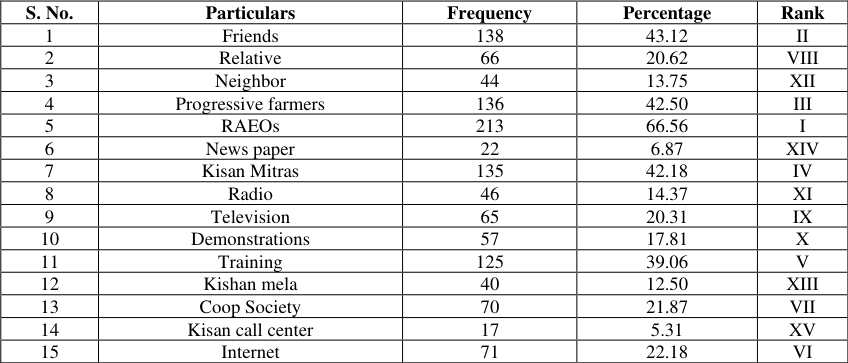 Table 1
 Table 2
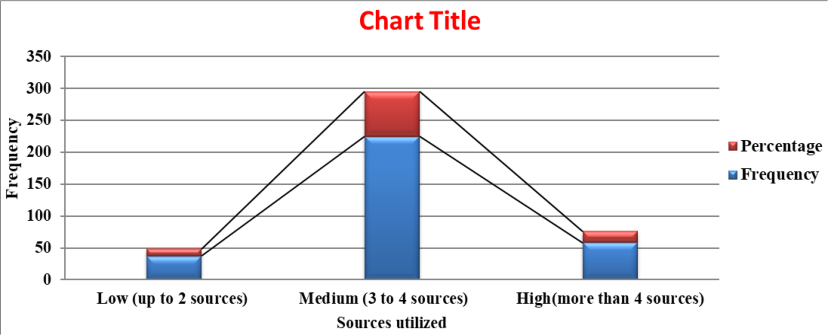 Figure 1
 Table 3
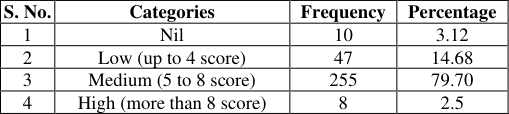 Table 4
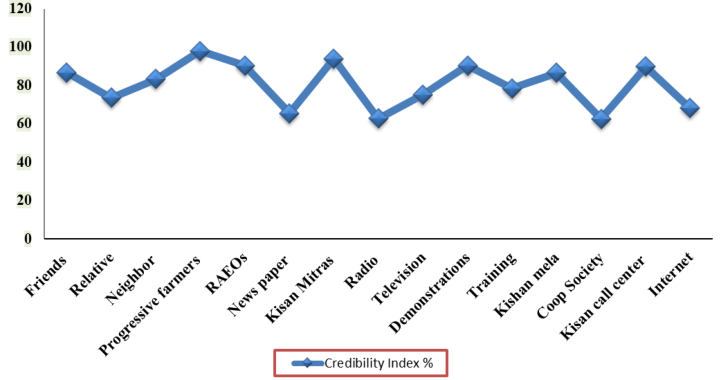 Figure 2
Introduction
Agriculture is the backbone of the Indian economy. Over sixty percent of people engage in agriculture. Rural development, food security, poverty alleviation, and economic development are all significantly influenced by agriculture. In India, pulses are a least expensive source of protein and are an essential component of the everyday meal. India accounts for over 25% of the global pulse basket and holds a significant position in its production. India is the world's largest producer of pulses, accounting for 25% of worldwide production, consumer for 27% of global consumption, and importer for 14% of global output. A traditional agricultural system has historically included pulses as a significant component. The main objective of the study was to analyze the communicational characteristics and sources of information of pulse-growing farmers in Chhattisgarh Plain.
Materials and Methods
The current study was carried out in the Chhattisgarh Plains' four primary pulse-growing districts. Eight blocks had been selected for the study, two blocks from each district. Each block has four randomly selected villages, making a total of 32 villages selected. To make up the study's sample of 320 respondents, ten farmers were randomly chosen from each village. In order to obtain more accurate information, personal interviews with the farmers were conducted in order to collect the data using a predesigned interview schedule. Frequency, percentage, and rank were used to tabulate and evaluate the gathered data.
Results and Discussion
Source of information Table 1. shows the sources from which information on agricultural practices was gathered. The findings indicate that 66.56% of the study region's respondents obtained their knowledge on farming methods via RAEOs. The study also shows that friends accounted for 43.12 percent of respondents' information sources, progressive farmers for approximately 42.50 percent, Kisan Mitra for 42.18 percent, training for 39.06 percent, and the internet for 22.18 percent of respondents' information sources. In contrast, 21.87 and 20.62 percent of respondents got their information from their neighbors, while 20.31 percent of respondents obtained their information from TV, 17.81 percent from demonstrations, and 14.37 percent from radio listening. Neighbors and Kisan Mela contributed 13.75 and 12.50 percent of the information, respectively, and newspapers and Kisan Call Centers accounted for 6.87 and 5.31 percent of the respondents' information sources. The findings also demonstrated that respondents frequently used RAEOs, friends, and relatives, as well as Kisan Mitra, as information sources. Although the respondents used almost all available sources of information to research agricultural practices, found that 44% of farmers learn about organic farming from friends, family, or Neighbors, which gives some credence to these findings. www.extensionjournal.com 2 shows the information on the respondents' overall use of information sources. The results showed that the majority of respondents (70.31%) obtained knowledge about better farming methods from two to four sources, while 18.13 percent used more than four sources. Conversely, merely 11.56 percent of the participants utilized a maximum of two sources of information. The data regarding overall source of information compiled in Table 2. The findings revealed that majority of the respondents (70.31%) had medium level of utilization, followed by high level of utilization (18.13%), while 11.56 percent of respondents had low level of utilization.
| S. No. | Sources utilized | Frequency | Percentage |
|---|---|---|---|
| 1 | Low (up to 2 source) | 37 | 11.56 |
| 2 | Medium (2 to 4 source) | 225 | 70.31 |
| 3 | High (more than 4 source) | 58 | 18.13 |
Table text extracted from the original PDF; superscript letters are shown inline. The original table image is below.
View original table image
| S. No. | Particulars | Frequency | Percentage | Rank |
|---|---|---|---|---|
| 1 | Friends | 138 | 43.12 | II |
| 2 | Relative | 66 | 20.62 | VIII |
| 3 | Neighbor | 44 | 13.75 | XII |
| 4 | Progressive farmers | 136 | 42.50 | III |
| 5 | RAEOs | 213 | 66.56 | I |
| 6 | News paper | 22 | 6.87 | XIV |
| 7 | Kisan Mitras | 135 | 42.18 | IV |
| 8 | Radio | 46 | 14.37 | XI |
| 9 | Television | 65 | 20.31 | IX |
| 10 | Demonstrations | 57 | 17.81 | X |
| 11 | Training | 125 | 39.06 | V |
| 12 | Kishan mela | 40 | 12.50 | XIII |
| 13 | Coop Society | 70 | 21.87 | VII |
| 14 | Kisan call center | 17 | 5.31 | XV |
| 15 | Internet | 71 | 22.18 | VI |
Table text extracted from the original PDF; superscript letters are shown inline. The original table image is below.
View original table image
Credibility of sources of information
The results also showed that progressive farmers in the research area had the highest level of credibility (98%) among respondents when it came to learning about farming techniques. Furthermore, it was discovered that RAEOs and demonstrations had very high credibility (90.4%). There was a 94 percent trust factor for Kisan Mitra, 89.8 percent for KCC, 86.8 percent for friends, 86.5 percent for Kisan Mela, and 83.4 percent for neighbors. Credibility scores for radio, newspapers, radio ADOs, television, relatives, the internet, and cooperative societies were 78.5, 75.2, 73.5, 68.2, 65.5, 62.8, and 62.5 percent, respectively. The lowest credibility was found towards radio coop society (Fig. 2). www.extensionjournal.com 3 compiles the results of an inquiry about respondents contact with extension personnel. According to the respondents' distribution in terms of how frequently they interact with extension staff, the data were compiled in Table 3. The findings of a survey about respondents' interactions wit h extension workers are compiled in Table 3. The data is presented in Table 3 according to the distributio n of respondents regarding the frequency of their interaction s with extension staff. In the survey, 52.19 percent of participants interacted with Rural Agricultural Extension Officers (RAEOs) once a month, 32.19 percent had so 1-3 times year, 12.5 percent had so weekly, and 3.12 percent did not interact with RAEOs at all. The findings regarding Agricultural Development Officers (ADOs) showed that the majority of respondents (94.06%) had never contacted them, while 3.44 percent had done so one to three times annually. The next highest percentage of respondents (1.56%) had contacted ADOs on a monthly basis, and 0.94 percent had contacted them on a weekly basis. The data also revealed that, with regard to communication with SADOs, the majority of respondents (84.06%) had never done so; 14.69 percent had done so one to three times a year; 1.25 percent did so on a monthly basis; and no respondent had done so on a weekly basis. On the other hand, contact with SMS/Agril. Scientist data reveals that the majority of respondents (96.25%) had never contacted them; 3.13 percent of respondents had contacted them 1-3 times annually; 0.62 percent of respondents contacted them on a monthly basis; and no respondent had contacted them on a weekly basis. 4 tabulates the information about overall contact with extension personnel. As a result, it was found that the majority of respondents (79.70%) had a medium level of interaction with extension people, followed by low level contact (14.68%), high level contact (2.50%), and nil contact (3.12) among the respondents.
| Extension personnel | Never | — | 1-3 Time in a year | — | Once in month | — | Weekly | — |
|---|---|---|---|---|---|---|---|---|
| F | % | F | % | F | % | F | % | |
| RAEOs | 10 | 3.12 | 103 | 32.19 | 167 | 52.19 | 40 | 12.5 |
| ADOs | 301 | 94.06 | 11 | 3.44 | 5 | 1.56 | 3 | 0.94 |
| SADOs | 269 | 84.06 | 47 | 14.69 | 4 | 1.25 | 0 | 0 |
| SMS/Agril. Scientist | 308 | 96.25 | 10 | 3.13 | 2 | 0.62 | 0 | 0 |
Table text extracted from the original PDF; superscript letters are shown inline. The original table image is below.
View original table image
Conclusion
In the study's area, friends, family, progressive farmers, and RAEOs provided the majority of respondents with information about farming practices; progressive farmers were regarded as having complete trustworthiness. Roughly 50% of the participants consulted three to four sources of information. While 52.19 percent of the respondents had contacted RAEOs 1-3 times a year, the majority of them had never contacted scientists, ADOs, or SADOs related to SMS/Agril.
Figures and tables from the paper
| S. No. | Categories | Frequency | Percentage |
|---|---|---|---|
| 1 | Nil | 10 | 3.12 |
| 2 | Low (up to 4 score) | 47 | 14.68 |
| 3 | Medium (5 to 8 score) | 255 | 79.70 |
| 4 | High (more than 8 score) | 8 | 2.5 |
Table text extracted from the original PDF; superscript letters are shown inline. The original table image is below.
View original table image
References
6 in the original paper- Bhosle PB, Jondhale SG, Patil CB. Effectiveness of farm broadcast as perceived by listeners. Maharashtra J Extension Educ. 2002;19(4):28-32.
- Johnson B, Vijayaragavan K. Diffusion of System of Rice Intensification (SRI) across Tamil Nadu and Andhra Pradesh in India. Indian Res J Extension Educ. 2011;11(3):72-79.
- Kumar D, Shrivastava KK, Shrivastava P, Shori RK. Profile of farmers and their attitude towards mass information sources. J Plant Dev. Sci. 2012;4(4):605611.
- Luni P, Maharj KL, Joshi NP. Perception and reality of climate change among the Chepong communities in Rural Mid-Hills of Nepal. J Contemp India Studies: Space and Society. 2012;2:35-50.
- Narbaria S, Sharma ML, Khan MA, Paikra VK. Communication pattern of SRI method of rice cultivators. J Commun. Stud. 2015;33(2):57-60.
- Sharma K, Dhaliwal NS, Kumar A. Analysis of adoption and constraints perceived by small paddy growers in rice production technologies in Muktsar district of Punjab State, India. Indian Res. J Extension Educ. 2015;15(2):20-23.