
Research article · 2024 · Full text
International Journal of Agriculture Extension and Social DevelopmentPreserving paradise: Unveiling visitor’s pledge to protect Karnataka’s ecosystem
Volume 7(3) · Pages 484–488 · DOI: 10.33545/26180723.2024.v7.i3f.464 ↗
Research areasAnthropological Studies and Insights
Abstract
Author-writtenOver the past few decades, the Kodagu and Chikkamagaluru districts of Karnataka have witnessed significant resource exploitation and ecosystem degradation, leading to heightened instances of landslides and erosion. This deterioration is largely attributed to excessive human intervention, with agro-ecotourism emerging as a notable contributor to the problem. In response, our study aimed to assess the willingness of visitors to agro-ecotourism units in these districts to contribute financially towards ecosystem protection. Employing the contingent valuation method, we analyzed the willingness to pay among a sample of 40 visitors, utilizing primary data collected for the study. Our findings indicated that income of the visitor, employment status and age of the visitors were key factors influencing visitors' readiness to invest in ecosystem conservation efforts. By shedding light on these determinants, our research contributed to a deeper understanding of visitor behavior in ecologically sensitive areas, providing valuable insights for policymakers and stakeholders seeking to develop effective strategies for environmental protection and sustainable tourism management. Ultimately, our study underscored the importance of fostering visitor engagement and support for conservation initiatives to address the pressing environmental challenges facing these regions.
Summary
Source-checkedPlain-language reading of the full paper, prepared with AI and checked against the text. Each point links to the authors' own words.
Why it matters
- The Kodagu and Chikkamagaluru districts in Karnataka have experienced significant ecosystem degradation and resource exploitation, which has increased the frequency of erosion and landslides. View evidence ↗
- Human intervention, specifically the rise of agro-ecotourism, is considered a major contributor to the environmental deterioration in these regions. View evidence ↗
- Agro-ecotourism provides economic benefits to farmers but introduces risks such as pollution, degradation, and the worsening of natural disasters. View evidence ↗
The question
- The study aimed to determine if visitors to agro-ecotourism units in the Kodagu and Chikkamagaluru districts were willing to pay for ecosystem protection. View evidence ↗
What they did
- The research was conducted in the Karnataka districts of Kodagu and Chikkamagaluru during 2020-21. View evidence ↗
- Primary data was gathered from 40 visitors via personal interviews using a pre-tested, structured schedule. View evidence ↗
- The researchers employed the double-bound contingent valuation method to estimate the visitors' willingness to pay. View evidence ↗
- The bidding process involved adjusting the initial bid by INR 250 (increasing for 'yes' and decreasing for 'no') for the second question. View evidence ↗
What they found
- The mean willingness to pay (WTP) for ecosystem protection among the sampled visitors was 951.61 Rupees. View evidence ↗
- Employment status significantly affected WTP, and a one-unit increase in respondent income was associated with a 31.93 unit increase in WTP. View evidence ↗
- Older visitors were more reluctant to pay for ecosystem protection, as shown by a negative coefficient in the analysis. View evidence ↗
- The logistic regression model had a Pseudo R2 of 0.80, meaning 80% of the variation in willingness to pay was explained by the included variables. View evidence ↗
What it means
- The authors conclude that a visitor's age, employment status, and income are the primary determinants of their willingness to invest in preserving the ecosystem. View evidence ↗
- The authors recommend that visitors take shared responsibility for championing conservation and sustainable resource use in ecologically diverse areas. View evidence ↗
Visual summary
2 visualsIllustrations explain the paper; charts are replotted from the paper's own table values.
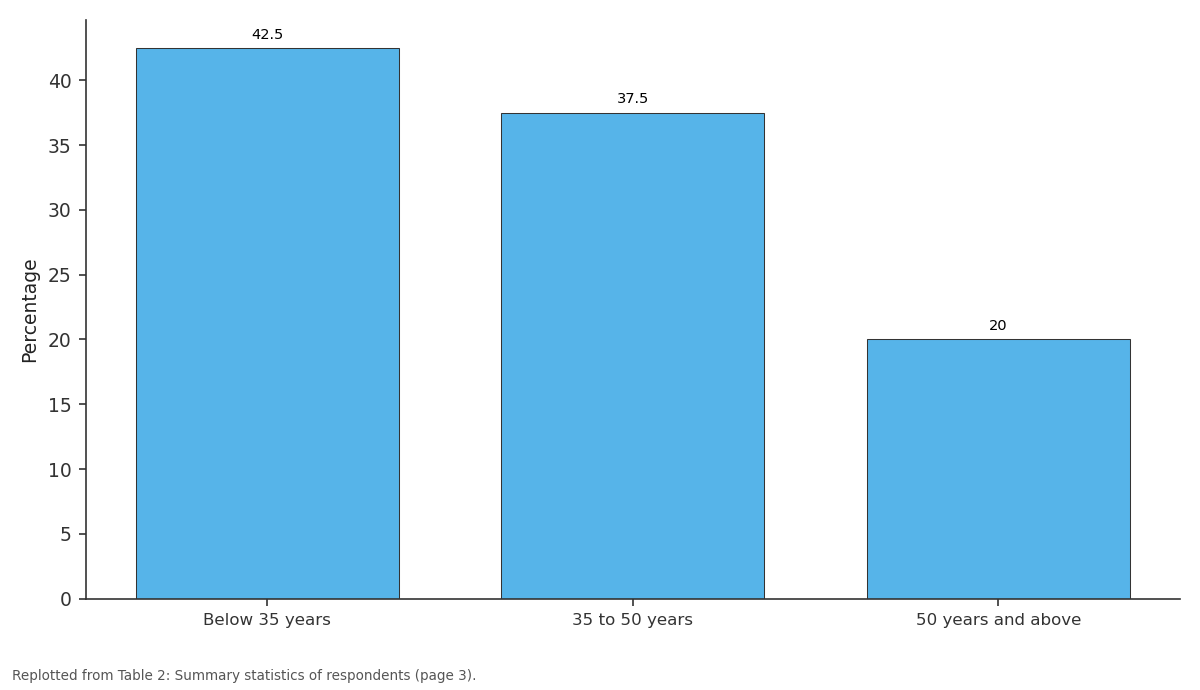
Percentage: Below 35 years vs 35 to 50 years vs 50 years and above
Replotted from Table 2 (page 3) of the original paper. Every bar is the paper's own table value.
View source evidence ↗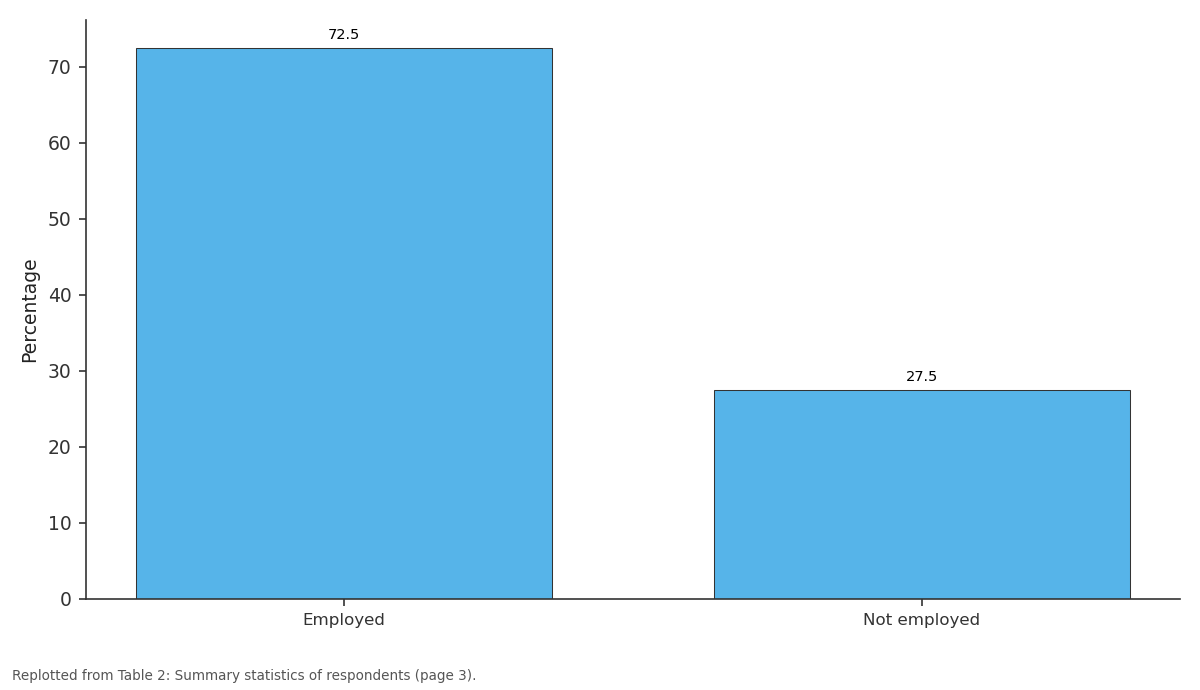
Percentage: Employed vs Not employed
Replotted from Table 2 (page 3) of the original paper. Every bar is the paper's own table value.
View source evidence ↗Figures & tables
From the original paper Table 1
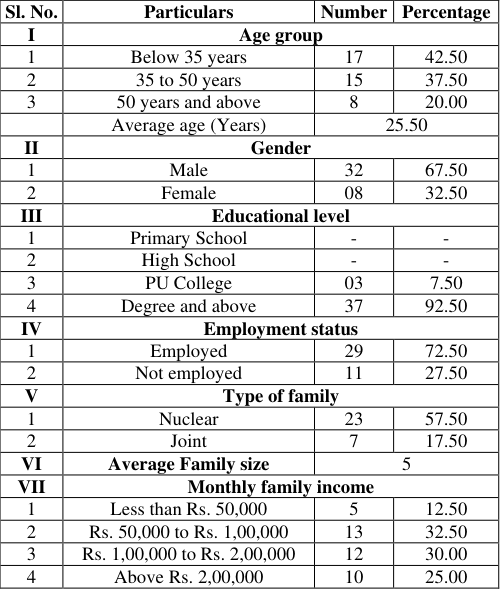 Table 2
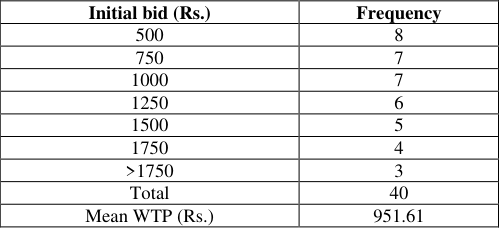 Table 3
 Table 4
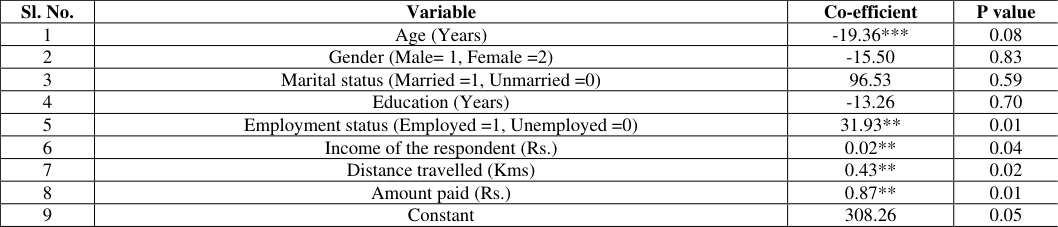 Table 5
 Table 6
Introduction
Agro-ecotourism represents a burgeoning trend within the Indian tourism landscape, characterized by the symbiotic integration of the agricultural sector, tourism industry, and farm-based enterprises, all while leveraging ecosystem services. Defined as the convergence of travel with agricultural experiences and products, this concept fosters mutual benefits for both travelers and hosts (Barbuddhe and Singh, 2014) [1] . Visitors to agro-eco-tourism destinations engage in a variety of activities, ranging from leisurely farm visits to hands-on participation in agricultural tasks, providing them with a firsthand experience of rural life and the opportunity to sample local cuisine. Notable destinations in Karnataka include Chikkamagaluru, Madikeri, Dakshina Kannada, Karwar, Sirsi, and Mysuru. Emphasizing agro-ecotourism presents a unique opportunity to bolster employment prospects within both the agricultural and tourism sectors, with a focus on localized hiring and sourcing. Moreover, it fosters avenues for tourism that celebrate local culture and environmental conservation. By actively involving local communities, particularly those marginalized, in the tourism value chain, opportunities for economic development are enhanced, encompassing the supply of local goods, labor, and tourism services. Central to the ethos of agro-ecotourism is the imperative to safeguard the natural ecosystems of these destinations. While such initiatives can provide supplementary income and employment opportunities for farmers, they also pose environmental risks, including degradation, pollution, and the exacerbation of natural disasters due to human encroachment. Given the dual impact of agro-ecotourism on both livelihoods and the environment, it is incumbent upon stakeholders to prioritize environmental protection. Consequently, our study seeks to elucidate visitors' willingness to contribute financially to ecosystem preservation, underscoring the importance of sustainable practices and conservation efforts in this burgeoning sector.
Methodology
The study was carried out in Chikkamagaluru and Kodagu districts of Karnataka during the year of 2020-21. Purposive proportionate sampling technique was employed for selection of farm households. Data was collected from 40 visitors using pre-tested well-structured schedule through personal interview method. Economists are interested in assigning a monetary value to non-marketed goods and measuring benefits of government policies, including non-use values (Hanemann et al., 1991), and they commonly use methods like hedonic pricing, travel cost method, and the contingent valuation method (Carson et al., 2001) [4] . The contingent valuation method aims to estimate, contingent upon the hypothetical market situation, the willingness to pay (or accept) for change in the provision of some goods or services (López-Feldman., 2013) [10] . Contingent valuation can be carried out using several methods the most commonly used are open-ended questions, bidding game, single-bound or double-bound dichotomous choice question, and choice experiments and www.extensionjournal.com the most robust are discrete choice methods, double-bound or single bound, because they make decision-making easy for the respondent. In open-ended questions, the respondent is asked directly to state, contingent upon the hypothetical market, what they would pay for a product or service. The open-end question method is criticized because it requires respondents to think too much about the range of utilities and alternatives and arrive at a suitable price. In the discrete choice format, also called the single bound discrete choice contingent valuation method, a pre-decided bid value is offered to the respondent and they are asked whether they would pay the amount (Yes/No -discrete choice). The discrete choice format is preferred because it closely mimics the real-life scenario of purchase decisions, where the price of the product is listed and one buys it or goes without. But in this method neither the 'yes' nor the 'no' response is bounded; if the responder agrees to pay the bid amount say, 'X' we can infer only that his true willingness to pay exceeds X. This limitation can be overcome by asking a follow-up question, and this method, known as the doublebound contingent valuation method, is more robust and less affected by bias (Kanninen., 1995) [9] . This study follows the double bound contingent valuation method. As a test, we asked visitors an open-ended follow-up question: what would they pay to protect the ecosystem? The key to the success of the contingent valuation method lies in developing a hypothetical market situation for the product or service in question and in eliciting the willingness to pay contingent upon it (Carson et al., 2001; Hanley et al., 2001; Tinch et al., 2015) [4,8,12] . This study estimates visitors' willingness to pay for protection of ecosystem. Before presenting the bids, the enumerator explained that if any procedure to collect the payment and utilization of it for the protection by nongovernmental organization. Each respondent is offered a random bid amount and asked whether they are willing to pay at that rate; a dichotomous variable captures the response (yes / no). If the visitor responds yes, the enumerators raises the bid by INR 250 when they ask the second dichotomous choice question; if the farmer responds no, the enumerator lowers the bid by INR 250. Depending on the answer, we have information on two bids and yes / no responses, which distinctively improve the accuracy of the estimates of visitors' willingness to pay (Hanemann et al., 1991; Gao et al., 2010) [7,5] , and we can use this information to estimate the willingness to pay econometrically.
Econometric estimation of the willingness to pay
Let t 1 and t 2 be the two bid amounts and the two variables capturing the response be, respectively, Y 1i and Y 2i . Visitors can respond (Yes, No), (Yes, Yes), (No, Yes), or (Yes, No). 1. (Yes, No): The visitor is ready to pay the initial bid amount (Y 1i = 1) but they reject the second bid amount (Y 2i = 0). The probability of this response is
if the willingness to pay (WTP) depends on a set of explanatory variables, i.e., WTP (Z i , u i ) = Z i β +u i , where Z i is the vector of explanatory variables and β represents corresponding coefficients. Assuming that the error term is normally distributed with 0 mean and standard deviation of ó, we can rewrite Equation 1 as From the estimates, we can compute the WTP: WTP on mean = β 0 * Constant + Σ k j=1 (Mean value j * β j ), where j = 1. . . k represents the control, variables used in the analysis review (Ravi and Umesh, 2018; Divya., 2015) [11,2] . Suitable controls (Table 1) were selected based on the theoretical expectations and literature. From this estimate, it is difficult to quantify the impact of different variables on the willingness to pay, but it is possible to predict for each respondent by making use of the coefficients of maximum likelihood estimation. The determinants of the willingness to pay for protection of ecosystem were analysed using as dependent variable with a set of explanatory variables. www.extensionjournal.com
| Variable | Unit | Description |
|---|---|---|
| Age | Years | Age of the respondent |
| Gender | Dummy | Equal to 1 if the respondent is male, otherwise 0 |
| Marital status | Dummy | Equal to 1 if respondent is married, otherwise 0 |
| Education | Years | Education of the respondent |
| Employment status | Dummy | Equal to 1 if respondent is employed, otherwise 0 |
| Income of the respondent | Rupees | Years of education |
| Distance travelled | Kms | Distance in kilometers |
Table text extracted from the original PDF; superscript letters are shown inline. The original table image is below.
View original table image
Logistic regression
To elucidate the factors affecting the willingness to pay (WTP) for protection of ecosystem, logistic regression was employed. The regression was run with willingness to pay as dependent variable with value 1 for the respondents who are willing to pay and 0 for the respondents who are not willing to pay.
The basic form of the logistic function is,
Where, Z= 𝛽 0 + 𝛽𝑖𝑋𝑖 and 𝑋𝑖 are set of predictor variables.
The quantity is called the odds and hence, ln is
Logit. The coefficients 𝛽𝑖 are logit regression coefficients.
Odds ratio was computed using these coefficients. In the case of a dichotomous independent variable, the odds ratio can be interpreted as the increased odds of a positive outcome on the dependent variable for the affirmative category (X=1) over the negative one (X=0). Logistic regression commands in the Stata 14.2 version software was used to analyze the data.
Tobit Analysis
A sample in which information on the dependent variables are available only for some observations is known as a censored sample and in such cases tobit is used (Gujarati, 2004) [6] . In view of the fact that the actual willingness to pay was zero for few visitors, tobit model was estimated to find the factors affecting the actual WTP. Censored tobit regression commands in the Stata 14.2 version software were used to find the maximum likelihood estimation of the independent variables.
if RHS > 0 and Y i = 0 , otherwise (12) The following model was used, WTP (Rs.) = 𝛽 0 + 𝛽 1 (X 1 ) + 𝛽 2 (X 2 ) + 𝛽 3 (X 3 ) + 𝛽 4 (X 4 ) + 𝛽 5 (X 5 ) + 𝛽 6 (X 6 ) X 1 -Age X 2 -Gender X 3 -Marital status X 4 -Education X 5 -Employment status X 6 -Income X 7 -Distance travelled X 8 -Amount paid
Results
We analysed the data from the primary survey (designed in double-bound contingent valuation format). About 32 per cent of respondents were having the average monthly income of Rs. 50,000 to Rs. 1,00,000 followed by 30 per cent of visitors with income of Rs. 1,00,000 to Rs. 2,00,000, 25 per cent of visitors were having income of above Rs. 2,00,000 and 12.50 per cent of visitors were having the income of less than Rs. 50,000. This was similar to the results observed by Dimitrovski et al. (2012) [13] where average tourist in Gruza was at a higher social and cultural level, with medium income and mostly coming from urban areas. These types of tourist were open to typical rural activities including sports, farm works, as well as to enjoying nature and gastronomy (Table 2). In contingent valuation method studies, it is important to consider the distribution of initial bid amounts to overcome the 'initial bid bias'. Seven initial bids were selected between INR 500 and INR 1,750 to match the amount payable for protection at different rates. Farmers charge average of 2000 per person per day to stay in their place. Bid amounts starting from INR 500 were selected and randomized the bids using a computer program, and minimized the bids above INR 1,750 as they were too high for visitors (Table 3). The initial bid was distributed among the sample visitors randomly with initial bid of Rs. 500 for 8 visitors, Rs. 750 for 7, Rs. 1000 for 7, Rs. 1250 for 6, Rs. 1500 for 5, Rs. 1750 for 4 and lastly more than Rs. 1750 for 3 which made to the total sample of 40.
| Initial bid (Rs.) | Frequency |
|---|---|
| 500 | 8 |
| 750 | 7 |
| 1000 | 7 |
| 1250 | 6 |
| 1500 | 5 |
| 1750 | 4 |
| >1750 | 3 |
| Total | 40 |
| Mean WTP (Rs.) | 951.61 |
Table text extracted from the original PDF; superscript letters are shown inline. The original table image is below.
View original table image
| Sl. No. | Particulars | Number | Percentage |
|---|---|---|---|
| I | Age group | ||
| 1 | Below 35 years | 17 | 42.50 |
| 2 | 35 to 50 years | 15 | 37.50 |
| 3 | 50 years and above | 8 | 20.00 |
| Average age (Years) | 25.50 | ||
| II | Gender | ||
| 1 | Male | 32 | 67.50 |
| 2 | Female | 08 | 32.50 |
| III | Educational level | ||
| 1 | Primary School | - | - |
| 2 | High School | - | - |
| 3 | PU College | 03 | 7.50 |
| 4 | Degree and above | 37 | 92.50 |
| IV | Employment status | ||
| 1 | Employed | 29 | 72.50 |
| 2 | Not employed | 11 | 27.50 |
| V | Type of family | ||
| 1 | Nuclear | 23 | 57.50 |
| 2 | Joint | 7 | 17.50 |
| VI | Average Family size | 5 | |
| VII | Monthly family income | ||
| 1 | Less than Rs. 50,000 | 5 | 12.50 |
| 2 | Rs. 50,000 to Rs. 1,00,000 | 13 | 32.50 |
| 3 | Rs. 1,00,000 to Rs. 2,00,000 | 12 | 30.00 |
| 4 | Above Rs. 2,00,000 | 10 | 25.00 |
Table text extracted from the original PDF; superscript letters are shown inline. The original table image is below.
View original table image
As the price of a good increases, its demand decreases, and as the bid amount increases the probability of a 'no' response is expected to increase; 'price test' was employed as it is termed in the contingent valuation method literature (Carson et al., 2001) [4] , by tabulating the initial bid and the corresponding response (Table 3). The 'no' responses rose as the bids increased from INR 500 to INR 1,750 and above. We used the maximum likelihood estimation method to estimate the willingness to pay (Table 5). To improve the accuracy of estimation, control variables related to age, gender, marital status, education, employment status, income of the respondent, distance travelled and amount paid for the stay/visit in agro-ecotourism unit were used. The coefficients of these control variables (presented in the first part of the table) are positive and significant, and these indicate a positive relationship between a 'yes' response, but the magnitude of influence cannot be inferred from the coefficient. Employment status, amount paid, distance travelled and income of the household were the factors that increase the probability of a 'yes' response to the bid, were the two main indicators of the ability to pay for protection; both have a positive coefficient, in line with the expectation. Age old people were reluctant to pay for the protection as indicated by negative coefficient. Employment status had a significant effect on the visitors' willingness to pay. If the income of respondent increases by one unit then the WTP increases by 31.93 units. We used logistic regression model to analyse the factors determining the visitors' willingness to pay (Table 6). Pseudo R 2 value was 0.80 indicating that 80 per cent of the variation in WTP is explained by the explanatory variables included in the model. Results revealed that income of the respondent and employment status had positive significant effect on willingness to pay on willingness to pay whereas age of the respondent had negative influence on willingness to pay. Distance travelled by the respondents and marital status showed positive non-significant effect on willingness to pay. On the contrary, the study conducted by Estifanos et al. (2018) [3] revealed that visitors WTP was significantly influenced by prior visitor experience in other protected areas in Ethiopia and interest in viewing other unique species in the park. www.extensionjournal.com
| Sl. No. | Variable | Co -efficient | P value | Exp(B) | 1/Exp (B) |
|---|---|---|---|---|---|
| 1 | Age (Years) | -0.33** | 0.02 | 0.71 | 1.40 |
| 2 | Gender (Male= 1, Female=0) | 1.07 | 0.41 | 2.94 | 0.34 |
| 3 | Marital status (Married=1,Unmarried =0) | -25.15 | 0.99 | 0.00 | 0.00 |
| 4 | Education (Years) | 15.14 | 0.99 | 0.88 | 1.13 |
| 5 | Employment status (Employed =1, Unemployed =0) | 0.002* | 0.00 | 0.03 | 33.33 |
| 6 | Income of the respondent (Rs.) | 0.03*** | 0.06 | 1.00 | 1.00 |
| 7 | Distance travelled (Kms) | 0.00 | 0.94 | 0.09 | 11.11 |
| 8 | Constant | 310.84 | 0.99 | 0.98 | 1.02 |
Table text extracted from the original PDF; superscript letters are shown inline. The original table image is below.
View original table image
| Sl. No. | Variable | Co-efficient | P value |
|---|---|---|---|
| 1 | Age (Years) | -19.36*** | 0.08 |
| 2 | Gender (Male= 1, Female =2) | -15.50 | 0.83 |
| 3 | Marital status (Married =1, Unmarried =0) | 96.53 | 0.59 |
| 4 | Education (Years) | -13.26 | 0.70 |
| 5 | Employment status (Employed =1, Unemployed =0) | 31.93** | 0.01 |
| 6 | Income of the respondent (Rs.) | 0.02** | 0.04 |
| 7 | Distance travelled (Kms) | 0.43** | 0.02 |
| 8 | Amount paid (Rs.) | 0.87** | 0.01 |
| 9 | Constant | 308.26 | 0.05 |
Table text extracted from the original PDF; superscript letters are shown inline. The original table image is below.
View original table image
Conclusion
Preservation of the ecosystem stands as a cornerstone of sustainable development, as it serves to mitigate the depletion of natural resources. However, the advent of agroecotourism, marked by the conversion of forested areas into agricultural lands and the development of infrastructure such as roads and lodging facilities, has introduced a heightened level of exploitation, resulting in the degradation of ecosystem services. To counteract this trend, safeguarding our ecosystems from the adverse impacts of agro-ecotourism becomes imperative. In this context, our study delved into the willingness of visitors to contribute financially towards the protection of the ecosystem. Our findings underscored that factors such as income, employment status, and age significantly influence visitors' readiness to invest in ecosystem preservation efforts. While governmental initiatives aimed at environmental conservation are underway, it is incumbent upon us, as stewards of the natural world, to collaborate in this endeavor. Recognizing the intrinsic value of our environment and the vital role it plays in sustaining life, collective action and cooperation are essential in ensuring its protection. As visitors to these ecologically diverse destinations, it is our shared responsibility to champion initiatives that promote the conservation and sustainable utilization of our natural resources. By fostering a sense of stewardship and mindfulness in our interactions with the environment, we can contribute to its preservation for present and future generations.
Figures and tables from the paper
| Bid | 500 | 750 | 1000 | 1250 | 1500 | 1750 | >1750 | Total |
|---|---|---|---|---|---|---|---|---|
| No | 0 (0%) | 0 (0%) | 1 (14.28%) | 1 (16.66%) | 2 (40%) | 3 (75%) | 2 (66.66%) | 9 (22.50%) |
| Yes | 8 (100%) | 7 (100%) | 6 (85.71%) | 5 (83.33%) | 3 (60%) | 1 (25%) | 1 (33.33%) | 31 (77.50%) |
| Total | 8 | 7 | 7 | 6 | 5 | 4 | 3 | 40 |
Table text extracted from the original PDF; superscript letters are shown inline. The original table image is below.
View original table image
References
11 in the original paper- Divya Lekshmi U, Gayathri Mohan, Hamsa KR, Subramanya S, Chandrakanth MG. Estimation of payment for ecosystem services of GKVK: A resource economic study. Mysore Journal of Agricultural Sciences. 2015;49(4):738-743.
- Estifanos T, Polyakov M, Pandit R, Hailu A, Burton M. Protection of the Ethiopian Wolf: What are tourists willing to pay for? Working Paper 1803, Agricultural and Resource Economics, The University of Western Australia, Crawley, Australia; c2018.
- Carson RT, FLORES NE, MEADE NF. Contingent valuation: controversies and evidence. Environmental and Resource Economics. 2001;19(2):173-210.
- Gao Z, House LO, Yu X. Using choice experiments to estimate consumer valuation: the role of experimental design and attribute information loads. Agricultural Economics. 2010;41(6):555-565.
- Hanemann MJL, Kanninen B. Statistical efficiency of double-bounded dichotomous choice contingent valuation. American Journal of Agricultural Economics. 1991;73(4):55-63.
- Hanley N, Smith M, Wright RE. Choice modelling approaches: a superior alternative for environmental valuation. Journal of Economic Surveys. 2001;15(3):435-462.
- Kanninen BJ. Bias in discrete response contingent valuation. Journal of Environmental Economics and Management. 1995;28(1):114-125.
- López-Feldman A. Introduction to contingent valuation using Stata. In Mexican Stata Users Group Meetings 2013 (No. 12). Stata Users Group; c2013.
- Ravi SC, Umesh KB. Willingness to pay for assured irrigation and equity in distribution of tank water in Central Dry Zone of Karnataka. Mysore Journal of Agricultural Sciences. 2018;52(4):681-688.
- Tinch D, Colombo S, Hanley N. The impacts of elicitation context on stated preferences for agricultural landscapes. Journal of Agricultural Economics. 2015;66(1):87-107.
- Dimitrovski DD, Todorović AT, Valjarević AD. Rural tourism and regional development: Case study of development of rural tourism in the region of Gruţa, Serbia. Procedia environmental sciences. 2012 Jan 1;14:288-297.
Cited by 1
From OpenAlex, OpenCitations and reference lists read by Scinovex
- Role of Ecotourism in Karnataka ↗
Uma C. Swadimath, Geetanjaili Sharma · Advances in finance, accounting, and economics book series · 2025
The word ecotourism refers to a travel to natural destinations with a deep focus on environmental conservation, tourism as such adds revenue to the economy. But ecotourism allows people to explore natural areas with scenic beauty, animals, different varieties of flora and fauna with a responsible bent of mind to conserve these natural resources and wildlife. Adventure sports also referred…
❝ 0