
Research article · 2024 · Full text
International Journal of Agriculture and Food ScienceImpact of nutritional factors and lifestyle in the etiology of macronutrients deficiency causing New World Syndrome
Volume 6(1) · Pages 97–100 · DOI: 10.33545/2664844x.2024.v6.i1b.170 ↗
Research areasChild Nutrition and Water AccessIron Metabolism and Disorders
Abstract
Author-writtenThe present study was to assess the prevalence of New World Syndrome in office-going person and their dietary habits. New World Syndrome is a set of non-communicable diseases brought on by the consumption of junk food and a sedentary lifestyle, especially common to office-going persons. It is characterized by obesity, heart disease, diabetes, hypertension, and shortened life span. The data concerning the dietary intake of the respondents were collected using the 24-hour recall method, Data concerning lifestyle and Dietary habits was obtained from the respondents by ‘questionnaire-cum interview’ and purposive random sampling method. The energy, protein, and fat consumption of respondents according to gender, 2132.47 Kcal of energy, 43.48 gm of protein and 45.11 gm of fat with SD 282.37 Kcal, 7.15gm and 5.19 gm were consumed by male respondents followed by average 2338.5 Kcal of energy with SD 354.50, 36.4 gm of protein with SD 2.95 and 43.7 gm of fat with SD 8.06 were taking by female respondents. Energy consumption with value z test is 7.632*, protein consumption with value z test is 8.630* and fat consumption with value z test is 1.672, Respondents.
Summary
Source-checkedPlain-language reading of the full paper, prepared with AI and checked against the text. Each point links to the authors' own words.
Why it matters
- New World Syndrome (NWS) is a group of non-communicable diseases linked to sedentary lifestyles and junk food consumption, particularly among office workers. View evidence ↗
- NWS is characterized by conditions such as obesity, hypertension, diabetes, heart disease, and a reduced life expectancy. View evidence ↗
- Reports indicate that approximately 75% of the global population is affected by New World Syndrome. View evidence ↗
The question
- The study aimed to assess the dietary habits and prevalence of New World Syndrome among office-going individuals. View evidence ↗
What they did
- The study used a random sample of 100 office employees working in air-conditioned environments across various locations in Kanpur city. View evidence ↗
- Data on lifestyle and dietary habits were collected using a combined questionnaire and interview method. View evidence ↗
- The 24-hour recall method was employed to assess the food intake of the participants. View evidence ↗
- Nutrient intake was compared against the 2020 Recommended Dietary Allowances (RDA) provided by the ICMR. View evidence ↗
What they found
- The total energy consumption of respondents was 2431.3 kcal/day, which is 13.22% higher than the RDA of 2130 kcal/day. View evidence ↗
- Total protein consumption was 38.26 gm/day, representing a 16.81% deficit compared to the RDA of 46 gm/day. View evidence ↗
- Total fat consumption was 42.3 gm/day, which is 129.3% higher than the RDA of 35 gm/day. View evidence ↗
- Female respondents consumed significantly more energy (2338.5±354.50 kcal/day) than male respondents (2132.47±282.37 kcal/day), with p < 0.05. View evidence ↗
- Male respondents had a significantly higher protein intake (43.48±7.15 gm/day) compared to females (36.4±2.95 gm/day), with p < 0.05. View evidence ↗
- There was no significant difference in fat intake between males (45.11±5.19 gm/day) and females (43.7±8.06 gm/day), with p > 0.05. View evidence ↗
What it means
- The authors conclude that office employees have inadequate dietary intake, specifically consuming excessive amounts of fats and carbohydrates. View evidence ↗
- The authors recommend increasing protein intake through the consumption of dairy, lean meats, poultry, eggs, legumes, and soybeans. View evidence ↗
Visual summary
3 visualsIllustrations explain the paper; charts are replotted from the paper's own table values.
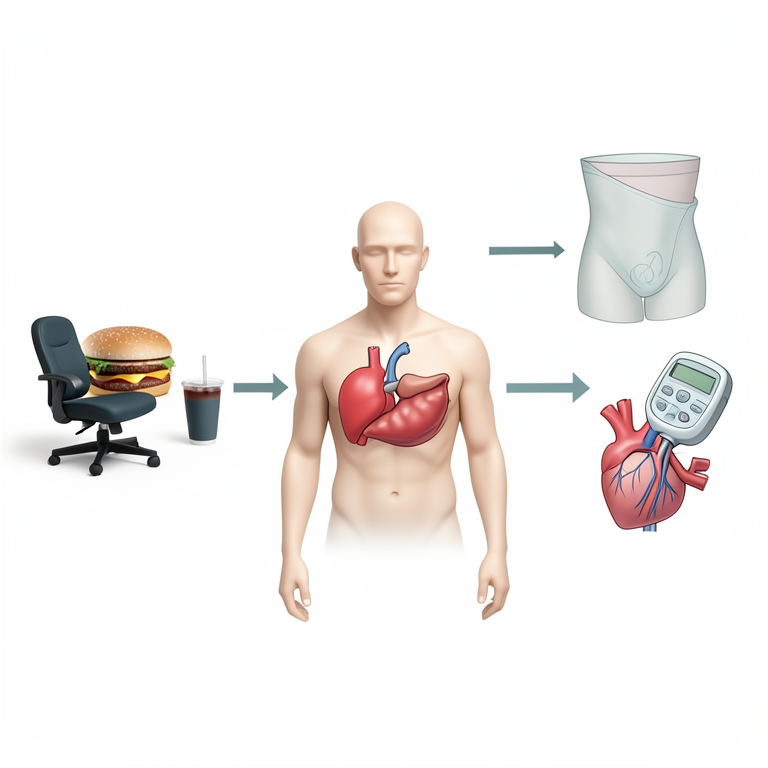
Conceptual Model of New World Syndrome
AI-generated conceptual illustration (Adult human organs and lifestyle objects). It explains the idea and does not show study data.
View source evidence ↗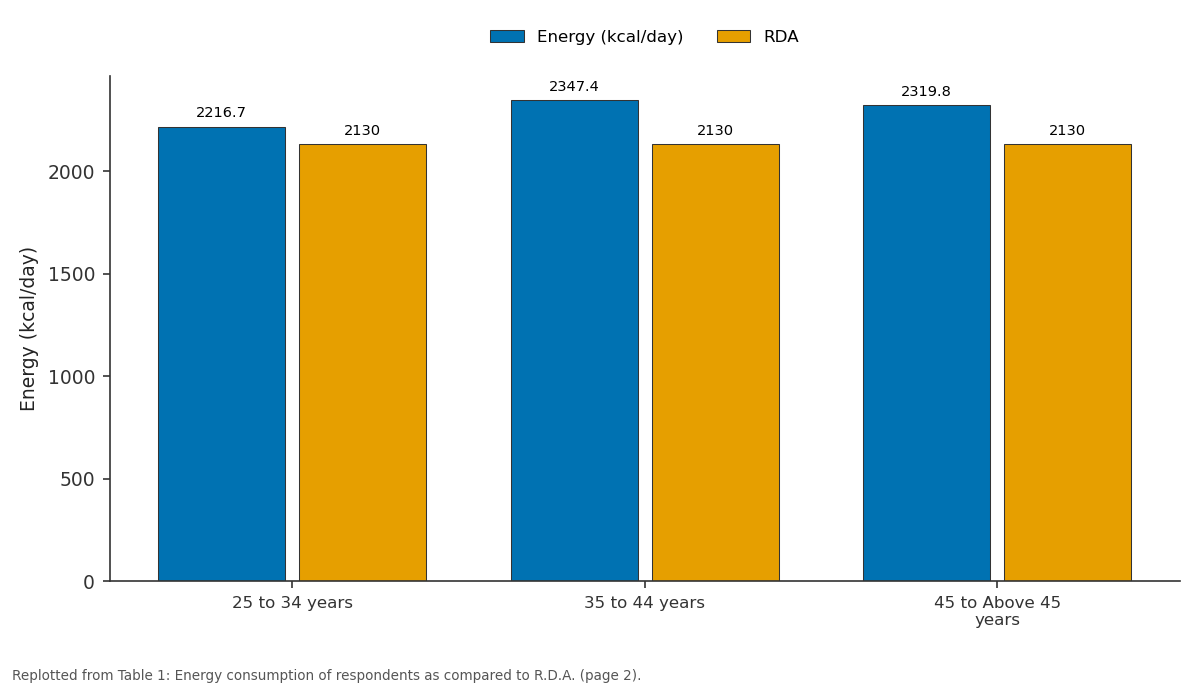
Energy (kcal/day) and RDA: 25 to 34 years vs 35 to 44 years vs 45 to Above 45 years
Replotted from Table 1 (page 2) of the original paper. Every bar is the paper's own table value.
View source evidence ↗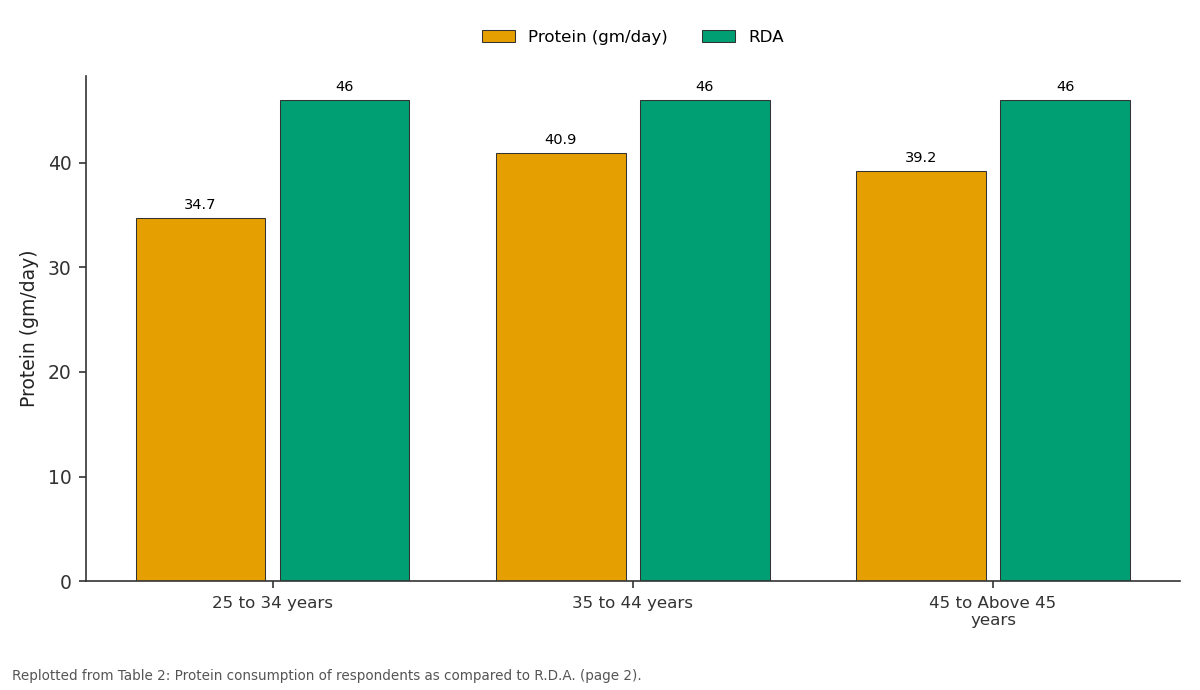
Protein (gm/day) and RDA: 25 to 34 years vs 35 to 44 years vs 45 to Above 45 years
Replotted from Table 2 (page 2) of the original paper. Every bar is the paper's own table value.
View source evidence ↗Figures & tables
From the original paper Table 1
 Table 2
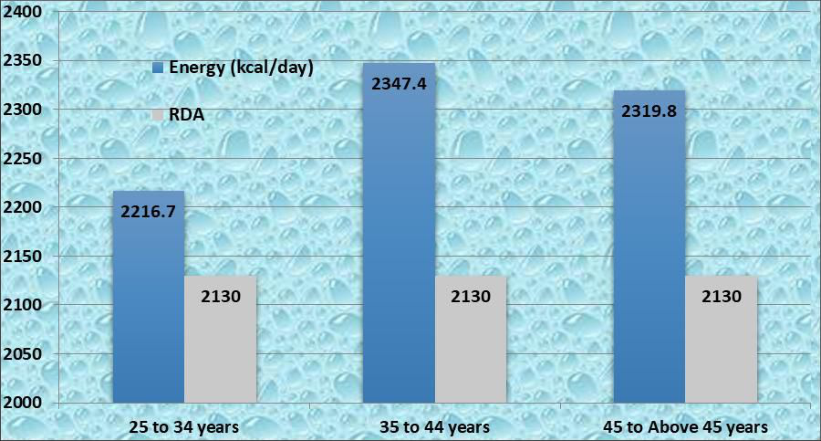 Figure 1
 Table 3
 Table 4
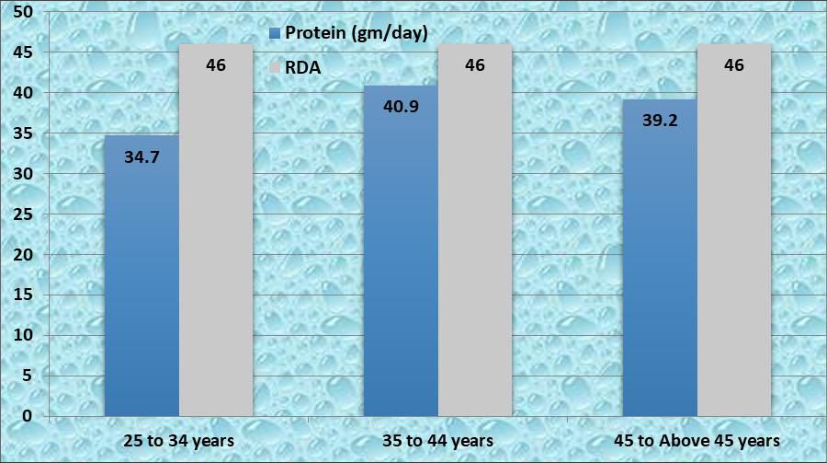 Figure 2
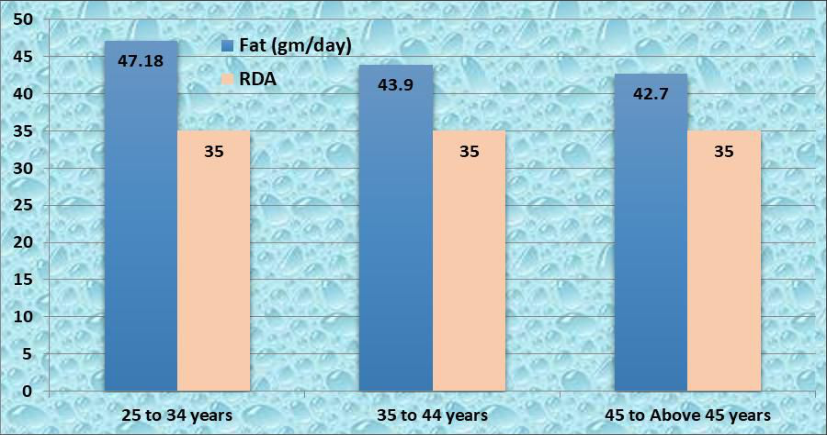 Figure 3
Introduction
NWS is an assemblage of maladies brought on not by microbes or parasites but by lifestyle and dietary habits. It is a set of non-communicable diseases characterized by obesity, hypertension, diabetes, heart disease, and shortened life span. As per reports, 75% of the world's population is affected by NWS. Dr. Venugopal Pareek bariatric and Laparoscopic surgeon states that NWS is occurring due to a radical change in diet and lifestyle from a traditional one to a Western one. Another contributing factor to this is Western food. These foods are rich in sugar, carbohydrates, fats, salts, and starches that cause obesity. Obesity is the major driver for the widely prevalent diabetes mellitus, Hypertension, cardiovascular disease, breast cancer, and dyslipidemia disorders.
Methodology
The occupational sample is on the Office employees (work in A.C.) in Kanpur, working in different area of Kanpur city chosen to best provide the required data for the study. 100 Samples were randomly selected as a sample size for study from selected areas of Kanpur city such as Krishna tower, CUGL Agency, Franciscan Solutions Pvt. Ltd. Kanpur, etc. The information was obtained from the respondents by the 'questionnaire-cum interview' method. A questionnaire cum interview method was used to collect reliable data. It was used to characterize the average intake of a large group. The 24-hour recall method was used to assess the food intake of the subjects. The nutrient intake was calculated using
The Nutrient intake was compared with the suggested intake compared with the Recommended Dietary Allowances (RDA) of ICMR (2020). Mean, SD, Correlation Coefficient, and Z test Statistical Analysis Tool Pack. According to David S Ludwig (2018) [1] , "Residents in places associated with extreme longevity have traditionally consumed high carbohydrate diets, although associated healthy lifestyle factors may confound a causal interpretation. By contrast, the PURE study in 18 countries reported that higher carbohydrate intake was associated with increased mortality, but here too, confounding is possible (e.g., many people in low-income countries subsist predominantly on starchy foods such as white rice). In large long-term cohorts studied in the US, total carbohydrate intake is also associated with higher mortality, though the type of dietary fat is an important modified risk.
Observation and assessment Food intake
Analogously, substituting saturated fat with low GI carbohydrate is associated with lower risk of myocardial infarction, whereas substituting with high GI carbohydrates is associated with higher risk." An insufficient protein intake from vegetarian diets may occur if the diet does not include protein-rich foods such as legumes (the most traditional source) and nuts and seeds, or any protein analogs of animal foods, the availability of which is increasing along with the proportion of people shifting their protein intake towards more plant protein sources. The maximum 47.18 percent increased fat was found in 25 to 34 years of age group, 43.9 percent increased fat was found in 35 to 44 years of age group and 42.7 percent increased fat was found in 45 to Above 45 years of age group. Respondents were consuming saturated fat in regular meals like whole egg, cheese, aaloo tikka, and pastries which are rich in butyric acid, propionic acid, palmitic acid, etc. Saturated fats, trans fats can raise cholesterol levels in the blood that's cause many heart diseases and greater fat, intake is a major cause of obesity and hypertension, diabetes, and gallbladder disease. Higher fat intake may heighten the risk of breast cancer directly through increased blood estrogen levels and/or secondarily through increased obesity. This study showed that there was a significant difference between the intake in energy, protein, and fat between males and females. Females were taking more energy during work than males due to their gobbler eating pattern and they love to eat fast foods. Protein and fat intake were found to be more in males than females because of different religious and eating habits, mostly males were found to be non-vegetarian than females during survey and obviously non-vegetarian diet have high biological value.
Conclusion
The study revealed inadequate dietary intake among employees. Respondents were consuming more than the required amount of carbohydrates and fats. It causes a higher risk of diabetes, obesity, hypertension, and cardiovascular diseases. Lack of proteins causes anxiety and poor health muscle. To increase protein content in the diet, they should take dairy products, lean meat, poultry, eggs, chickpeas, lentils, green peas, pulses, and soybeans in their diet.
Figures and tables from the paper
| S. No. | Age group | N | Energy (kcal/day) | RDA | Deficit/Increase (%) |
|---|---|---|---|---|---|
| 1. | 25 to 34 years | 37.0 | 2216.7 | 2130 | 10.62 |
| 2. | 35 to 44 years | 41.0 | 2347.4 | 2130 | 13.87 |
| 3. | 45 to Above 45 years | 22.0 | 2319.8 | 2130 | 12.17 |
| Total | 100.0 | 2431.3 | 2130 | 13.22 |
Table text extracted from the original PDF; superscript letters are shown inline. The original table image is below.
View original table image
| S. No. | Age Group | N | Protein (gm/day) | RDA | Deficit/ Increase (%) |
|---|---|---|---|---|---|
| 1. | 25 to 34 years | 37.0 | 34.7 | 46 | -24.56 |
| 2. | 35 to 44 years | 41.0 | 40.9 | 46 | -11.08 |
| 3. | 45 to Above 45 years | 22.0 | 39.2 | 46 | -14.78 |
| Total | 100.0 | 38.26 | 46 | -16.81 |
Table text extracted from the original PDF; superscript letters are shown inline. The original table image is below.
View original table image
| S. No. | Age group | N | Fat (gm/day) | RDA | Deficit/ Increase (%) |
|---|---|---|---|---|---|
| 1. | 25 to 34 years | 37.0 | 47.18 | 35 | 134.2 |
| 2. | 35 to 44 years | 41.0 | 43.9 | 35 | 131.7 |
| 3. | 45 to Above 45 years | 22.0 | 42.7 | 35 | 122 |
| Total | 100.0 | 42.3 | 35 | 129.3 |
Table text extracted from the original PDF; superscript letters are shown inline. The original table image is below.
View original table image
| S. No. | Nutrient | Gender | — | Z test | Significant level |
|---|---|---|---|---|---|
| Male | Female | ||||
| 1. | Energy (kcal/day) | 2132.47±282.37 | 2338.5±354.50 | 7.632* | p<0.05 |
| 2. | Protein (gm/day) | 43.48±7.15 | 36.4±2.95 | 8.630* | p<0.05 |
| 3. | Fat (gm/day) | 45.11±5.19 | 43.7±8.06 | 1.672 | p>0.05 |
Table text extracted from the original PDF; superscript letters are shown inline. The original table image is below.
View original table image
References
1 in the original paper- Gardner JW, Sanborn JS. Years of Potential Life Lost (YPLL)-what does it measure? Epidemiology. 1990;1(4):322-329.