
Research article · 2024 · Full text
International Journal of Agriculture Extension and Social DevelopmentAnalyzing energy input and output dynamics in cotton production of Vikarabad District, Telangana
Volume 7(3) · Pages 421–424 · DOI: 10.33545/26180723.2024.v7.i3e.444 ↗
Research areasAgricultural Economics and PracticesResearch in Cotton Cultivation
Abstract
Author-writtenEnergy analysis (input-output) of Cotton production systems in Vikarabad district of Telangana State. Surveys conducted at the farms that cultivate Cotton in Vikarabad district, in the 2021. Sixty farms that produce Cotton were interviewed face to face. The results revealed that in Cotton production systems total energy input was 19289.61MJ/ha. The highest share of energy consumed was recorded for N fertilizer (31.91%) which is a nonrenewable resource. Output Energy was 32604.00 MJ/ha. Accordingly, energy efficiency (output input ratio) was 1.69, energy productivity calculated as 0.15 KgMJ-1 and specific energy was observed as 6.5MJKg-1, agrochemical energy ratio was 0.44% and energy intensiveness was 0.32.
Summary
Source-checkedPlain-language reading of the full paper, prepared with AI and checked against the text. Each point links to the authors' own words.
Why it matters
- Cotton is a critical cash crop and fiber source that significantly influences India's agricultural and industrial economies. View evidence ↗
- Lowering energy consumption during crop production can reduce overall costs, which is especially important in developing countries using traditional farming methods. View evidence ↗
- Using energy efficiently improves agricultural productivity and the economic competitiveness of rural farming. View evidence ↗
The question
- The study aimed to perform an input-output energy analysis of cotton production systems within the Vikarabad district of Telangana State. View evidence ↗
What they did
- Additional metrics measured included energy intensiveness (energy input relative to cultivation cost) and the agrochemical energy ratio. View evidence ↗
What they found
- The total energy input for cotton production in the studied area was 19,289.61 MJ/ha. View evidence ↗
- Seeds contributed the least to the total energy input, accounting for only 0.07%. View evidence ↗
- The average cotton yield was 2,964 kg/ha, which corresponds to a total energy output of 32,604 MJ/ha. View evidence ↗
- The energy use efficiency (output-to-input ratio) for the cotton production system was 1.69. View evidence ↗
- Energy productivity was 0.15 kg/MJ, and the specific energy required to produce one kilogram of grain was 6.5 MJ/kg. View evidence ↗
- The net energy of the system, calculated as output minus input, was 13,314.39 MJ/ha. View evidence ↗
- The agrochemical energy ratio was 0.44%, and the energy intensiveness was 0.32 MJ per rupee spent. View evidence ↗
What it means
- The authors conclude that the relatively low energy use efficiency in these cotton systems is primarily due to high energy inputs, specifically the use of nitrogen fertilizer. View evidence ↗
Figures & tables
From the original paper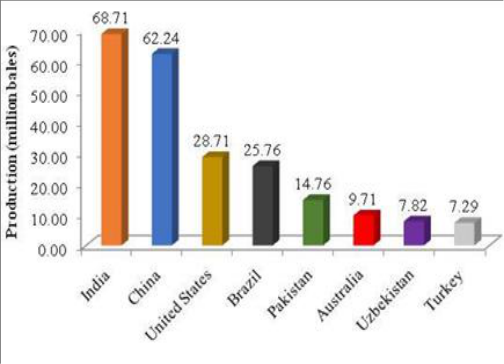 Figure 1
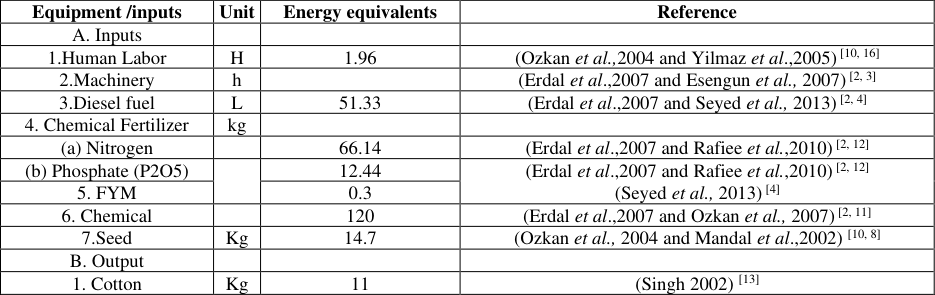 Table 1
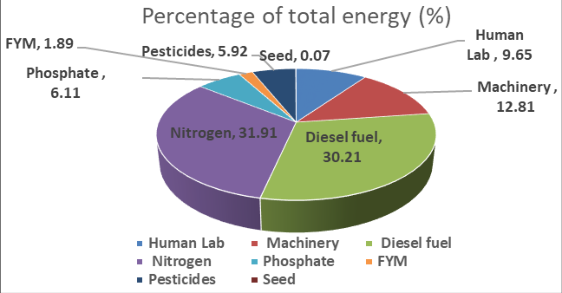 Figure 1
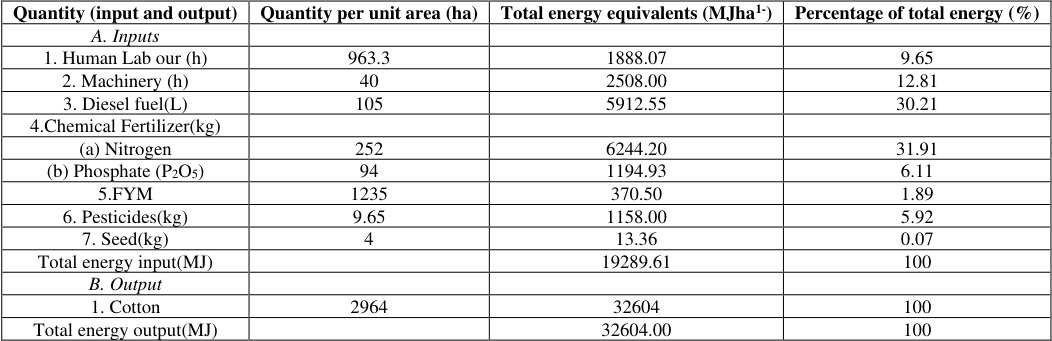 Table 2
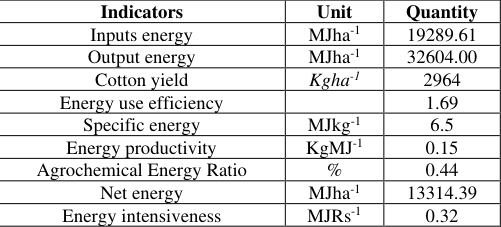 Table 3
Introduction
Cotton is one of the most important fiber and a cash crop of India and plays a dominant role in the industrial and agricultural economy of the country. Globally, the area under cotton for the year 2021-22 was 32.10 million hectares, production and productivity accounted for 257.71 million bales and 1370 kg/ha respectively. India has emerged as the largest producer of cotton in the world and occupies the first position in terms of both total area and production. Among the major cotton producing countries in the world, India occupied 1st position with 68.71 million bales (Figure 1). Energy plays a pivotal role in agriculture, dating back to the era of subsistence farming. It's widely acknowledged that agricultural production correlates positively with energy input (Taheri Garavand et al., 2010) [15] . Reduced energy consumption in crop production translates to lower production costs, particularly in developing countries where traditional methods persist, elevating production expenses. Agriculture is a significant consumer and producer of energy. Improving energy efficiency in agricultural production involves assessing the effectiveness of methods and techniques employed. Energy usage in agriculture has surged due to population growth, dwindling arable land, and aspirations for higher living standards (Kizilaslan., 2019) [7] . The sector, like others, relies heavily on resources such as electricity, fuels, natural gas, and coke. This dependence, coupled with capital-intensive technologies, is partly fueled by relatively low energy prices compared to the resources they substitute. Efficient energy utilization boosts production, productivity, and contributes to the economic viability and competitiveness of agriculture, especially in rural areas (Ozkan et al. 2007 and Singh et al. 2022) [11,17] In Vikarabad district, agriculture dominates the economy, with 20 percent of the population engaged in agricultural and allied activities. The district boasts a gross cropped area of 2,61,360 hectares and 2,67,663 farm holdings.
Source: fas.usda.gov
Source: fas.usda.gov
Materials and Methods
This research was undertaken within the Vikarabad District of Telangana State, focusing on farms cultivating Cotton during the year 2021. Data for the study were gathered www.extensionjournal.com through face-to-face surveys conducted on sixty Cottonproducing farms in Vikarabad district. The selection of farms for the survey was determined using a simple random sampling method. The formula for this method is outlined as follows:
Where, n = the volume of sample, s = the standard deviation, t = the t value of the 95% confidence interval (1.96), N = the number of farms belonging to the sampling frame and E = the acceptable error (5% deviation) Finally energy use efficiency, specific energy, energy productivity and net energy were determined applying standard equations (Hatirli et al., 2008 and Mohammad et al., 2010) [5,9] . [13]
Energy use efficiency = (output energy[MJha
Energy use efficiency = (output energy[MJha
Results and Discussion
The study unveiled that the average production cost per hectare of Cotton crop amounted to Rs. 60,000. Table 2 presents a breakdown of inputs utilized and outputs in Cotton production systems, along with their energy equivalents and percentages of the total energy input.
| Quantity (input and output) | Quantity per unit area (ha) | Total energy equivalents (MJha1-) | Percentage of total energy (%) |
|---|---|---|---|
| A. Inputs | |||
| 1. Human Lab our (h) | 963.3 | 1888.07 | 9.65 |
| 2. Machinery (h) | 40 | 2508.00 | 12.81 |
| 3. Diesel fuel(L) | 105 | 5912.55 | 30.21 |
| 4.Chemical Fertilizer(kg) | |||
| (a) Nitrogen | 252 | 6244.20 | 31.91 |
| (b) Phosphate (P2O5) | 94 | 1194.93 | 6.11 |
| 5.FYM | 1235 | 370.50 | 1.89 |
| 6. Pesticides(kg) | 9.65 | 1158.00 | 5.92 |
| 7. Seed(kg) | 4 | 13.36 | 0.07 |
| Total energy input(MJ) | 19289.61 | 100 | |
| B. Output | |||
| 1. Cotton | 2964 | 32604 | 100 |
| Total energy output(MJ) | 32604.00 | 100 |
Table text extracted from the original PDF; superscript letters are shown inline. The original table image is below.
View original table image
Results indicated that the total energy input in Cotton production systems was 19289.61 MJ/ha. Notably, N fertilizer employed in Cotton production systems accounted for the highest share at 31.91% (see Fig. 1). Diesel fuel energy ranked second with 30.21% contribution to the total energy input. Seed, on the other hand, represented the smallest share of the total energy input at 0.07%. Additionally, the study observed a Cotton yield of 2964 kg/ha, equating to a total energy equivalent of 32604 MJ/ha. Table 3 presented the energy indicators for Cotton production systems. Notably, the energy efficiency, represented by the output-input ratio, was calculated at 1.69. The lower energy use efficiency observed in Cotton production systems can be attributed to the elevated energy inputs, particularly the consumption of N fertilizer. In Cotton production systems, the energy productivity, denoting the cotton yield per energy input, was measured at 0.15 kg MJ -1 , while the specific energy, indicating the input energy required per unit of grain yield, stood at 6.5 MJ kg -1 . Put differently, for every MJ of input energy, 0.15 kg of Cotton grain was produced, or conversely, 6.5 MJ of energy was expended to yield one kilogram of grain. Furthermore, the system net energy, calculated as the output minus input, amounted to 13314.39 MJ ha -1 . The agrochemical energy ratio accounted for 0.44% of the input energy in Cotton production systems. Additionally, the energy intensiveness, indicating the amount of energy produced per rupee spent, was computed at 0.32 MJ Rs -1 , signifying that for each rupee invested, 0.32 MJ of energy could be generated.
| Indicators | Unit | Quantity |
|---|---|---|
| Inputs energy | MJha-1 | 19289.61 |
| Output energy | MJha-1 | 32604.00 |
| Cotton yield | Kgha-1 | 2964 |
| Energy use efficiency | 1.69 | |
| Specific energy | MJkg-1 | 6.5 |
| Energy productivity | KgMJ-1 | 0.15 |
| Agrochemical Energy Ratio | % | 0.44 |
| Net energy | MJha-1 | 13314.39 |
| Energy intensiveness | MJRs-1 | 0.32 |
Table text extracted from the original PDF; superscript letters are shown inline. The original table image is below.
View original table image
Figures and tables from the paper
| Equipment /inputs | Unit | Energy equivalents | Reference |
|---|---|---|---|
| A. Inputs | |||
| 1.Human Labor | H | 1.96 | (Ozkan et al.,2004 and Yilmaz et al.,2005) [10, 16] |
| 2.Machinery | h | (Erdal et al.,2007 and Esengun et al., 2007) [2, 3] | |
| 3.Diesel fuel | L | 51.33 | (Erdal et al.,2007 and Seyed et al., 2013) [2, 4] |
| 4. Chemical Fertilizer | kg | ||
| (a) Nitrogen | 66.14 | (Erdal et al.,2007 and Rafiee et al.,2010) [2, 12] | |
| (b) Phosphate (P2O5) | 12.44 | (Erdal et al.,2007 and Rafiee et al.,2010) [2, 12] (Seyed et al., 2013) [4] | |
| 5. FYM | 0.3 | ||
| 6. Chemical | 120 | (Erdal et al.,2007 and Ozkan et al., 2007) [2, 11] | |
| 7.Seed | Kg | 14.7 | (Ozkan et al., 2004 and Mandal et al.,2002) [10, 8] |
| B. Output | |||
| 1. Cotton | Kg | 11 | (Singh 2002) [13] |
Table text extracted from the original PDF; superscript letters are shown inline. The original table image is below.
View original table image
References
16 in the original paper- Demircan V, Ekinci K, Keener D, Akbolat, Ekinci. Energy and economic analysis of sweet cherry production in Turkey: a case study from Isparta province. Energy Convers Manage. 2006;47(1):17611769.
- Erdal G, Esengun K, Erdal, Gunduz O. Energy use and economical analysis of sugar beet production in Tokat province of Turkey. Energy. 2007;32:35-41.
- Esengun K, Gunduz O, Erdal G. Input-output energy analysis in dry apricot production of Turkey. Energy Convers Manage. 2007;48:592-598.
- Tabatabaie SMH, Rafiee S, Keyhani A, Heidari MD. Energy use pattern and sensitivity analysis of energy inputs and input costs for pear production in Iran. Renew Energy. 2013;51:7-12.
- Hatirli SA, Ozkan B, Fert C. Energy inputs and crop yield relationship in greenhouse tomato production. Renew Energy. 2008;31:427-438.
- Khan S, Khan MA, Hanjra J, Mu. Pathways to reduce the environmental footprints of water and energy input in food production. Food Policy. 2009;34:141-149.
- Kizilaslan H. Input-output energy analysis of cherries production in Tokat Province of Turkey. Appl Energy. 2009;86:1354-1358.
- Mandal KG, Saha KP, Ghosh PK, Hati KM, Bandyopadhyay KK. Bioenergy and economic analysis of soybean-based crop production systems in central India. Biomass Bioenergy. 2002;23(5):337-345.
- Mohammad A, Rafiee S, Mohtasebi SS, Rafiee H. Energy inputs-yield relationship and cost analysis of kiwifruit production in Iran. Renew Energy. 2010;35:1071-1075.
- Ozkan B, Akcaoz H, Fert C. Energy input-output analysis in Turkish agriculture. Renew Energy. 2004;29:39-51.
- Ozkan B, Fert C, Karadeniz CF. Energy and cost analysis for greenhouse and open field grape production and open-field grape production. Energy. 2007;32:1-4. www.extensionjournal.com
- Rafiee S, Mousavi SH, Mohammadi A. Modelling and sensitivity analysis of energy inputs for apple production in Iran. Energy. 2010;35(8):3301-6.
- Singh H, Mishra D, Nahar NM. Energy use pattern in production agriculture of a typical village in arid zone, India--part-I. Energy Convers Manag. 2002;43:2275-86.
- Streimikiene D, Klevas V, Bubeliene J. Use of EU structural funds for sustainable energy development in new EU member states. Renew Sustain Energy Rev. 2007;116:1167-87.
- TaheriGaravan A, Asakereh A, Haghani K. Energy elevation and economic analysis of canola production in Iran a case study: Mazandaran province. Int J Environ Sci. 2010;1(2):236-243.
- Yilmaz I, Akcaoz H, Ozkan B. An analysis of energy use and input costs for cotton production in Turkey. Renew Energy. 2005;30(2):145-55.