
Research article · 2024 · Full text
International Journal of Agriculture Extension and Social DevelopmentProfile of Sarpanches and their emotional intelligence
Volume 7(3) · Pages 292–301 · DOI: 10.33545/26180723.2024.v7.i3d.432 ↗
Research areasEmotional Intelligence and PerformanceBusiness Strategies and Management ResearchLivestock Management and Performance Improvement
Abstract
Author-writtenThe study delves into the profile analysis of Sarpanches and their emotional intelligence in South Gujarat, aiming to enhance local governance effectiveness. Employing an ex-post-facto research design across seven districts, 210 Sarpanches were surveyed. Findings reveal a predominance of middle-aged individuals with secondary education, primarily from Scheduled Tribes. Moderate income and landholding patterns underscore diverse economic circumstances. Active community involvement and leadership roles highlight their significance in local governance. Varied management efficiency and group cohesiveness levels necessitate tailored support for optimal effectiveness. The study underscores the importance of enhancing emotional intelligence among Sarpanches for improved leadership and governance.
Summary
Source-checkedPlain-language reading of the full paper, prepared with AI and checked against the text. Each point links to the authors' own words.
Why it matters
- The Panchayati Raj system in India is designed to empower local self-governance and facilitate participatory democracy through elected representatives. View evidence ↗
- Emotional intelligence (EI) is critical for leadership effectiveness because it promotes accountability, transparency, and inclusive decision-making in governance. View evidence ↗
The question
- The study aims to analyze the emotional intelligence of Sarpanches (village heads) in the South Gujarat region. View evidence ↗
What they did
- The researchers used an ex-post-facto research design across seven districts in South Gujarat. View evidence ↗
- The sample consisted of 210 randomly selected Sarpanches, split equally between 105 males and 105 females. View evidence ↗
What they found
- The majority of Sarpanches were middle-aged (58.10%), followed by young (24.76%) and old (17.14%) age groups. View evidence ↗
- The Scheduled Tribe (ST) category was the most dominant group among the pooled Sarpanches, representing 66.19%. View evidence ↗
- Over half of the pooled respondents (51.90%) reported having a moderate annual income. View evidence ↗
- Low landholding was the most prevalent status among pooled Sarpanches (52.38%), followed by medium (24.76%) and high (13.81%) landholding. View evidence ↗
- Most Sarpanches were socially active, with 78.10% holding leadership positions and 65.71% affiliated with one organization. View evidence ↗
- Training was primarily received at the block level (48.10%) and village level (47.14%). View evidence ↗
- Management efficiency varied, with 51.90% showing moderate efficiency, 40.48% lower efficiency, and 7.62% higher efficiency. View evidence ↗
- A majority of the pooled Sarpanches (60.48%) demonstrated high leadership ability. View evidence ↗
- Regarding emotional intelligence, 60.00% of the pooled respondents showed moderate levels, 32.38% high levels, and 7.62% low levels. View evidence ↗
What it means
- The authors conclude that tailored support and development initiatives are necessary to improve the emotional intelligence and leadership of Sarpanches for better local governance. View evidence ↗
Visual summary
1 visualsIllustrations explain the paper; they do not show study data.
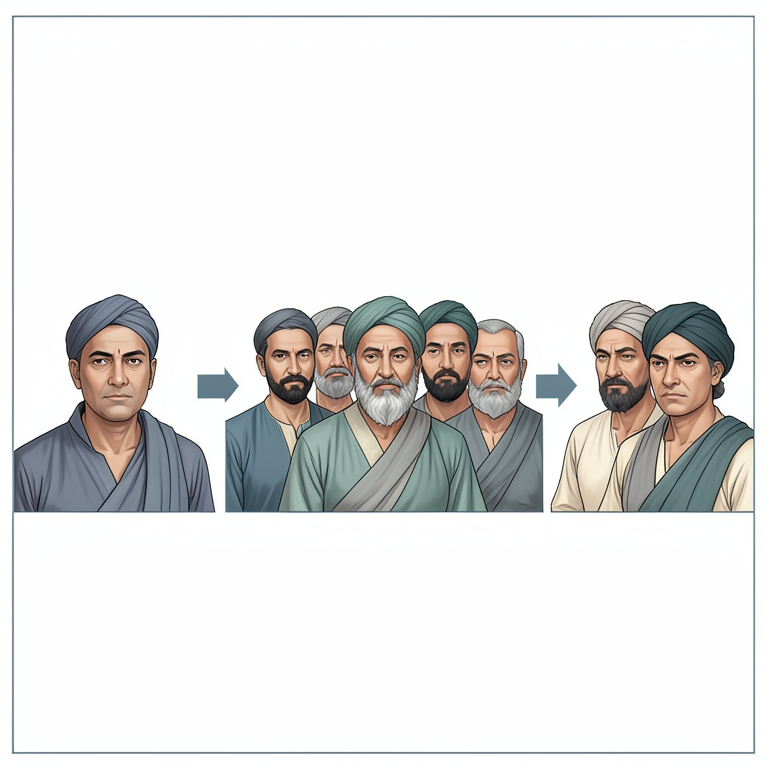
Emotional Intelligence Distribution
AI-generated conceptual illustration (Indian village headmen (Sarpanches)). It explains the idea and does not show study data.
View source evidence ↗Figures & tables
From the original paper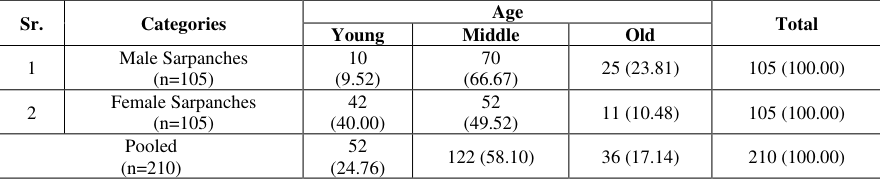 Table 1
 Table 2
 Table 3
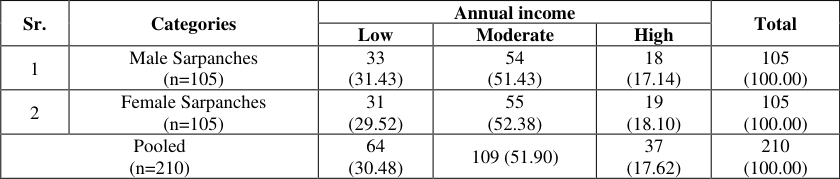 Table 4
 Table 5
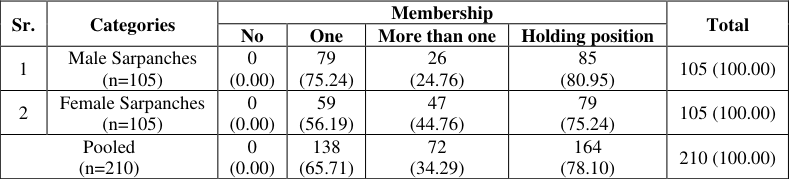 Table 6
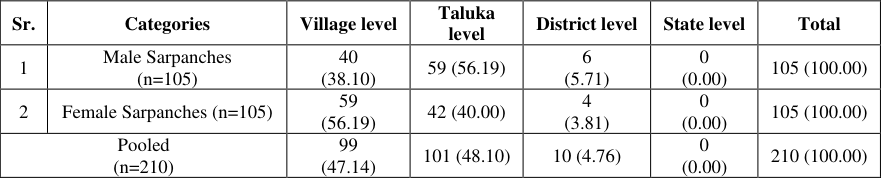 Table 7
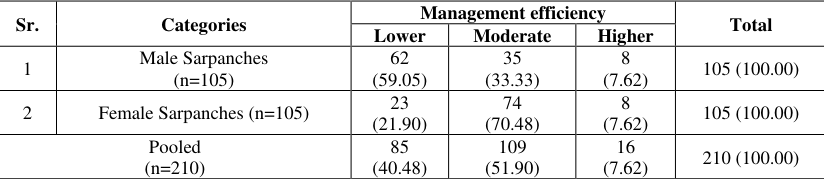 Table 8
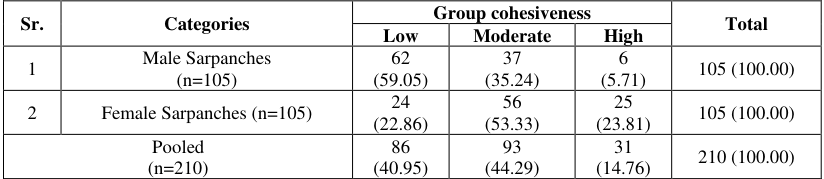 Table 9
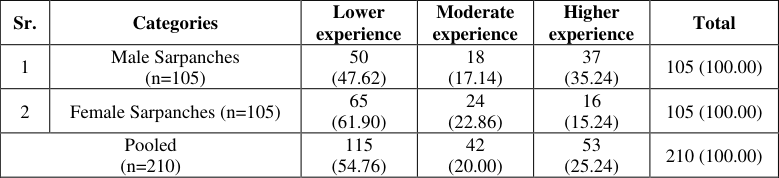 Table 10
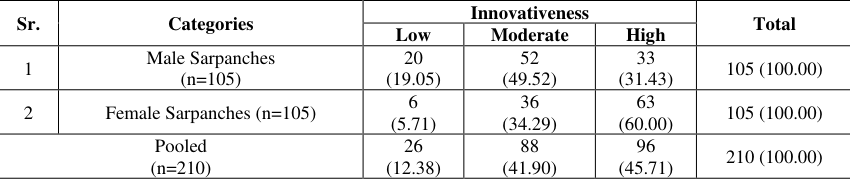 Table 11
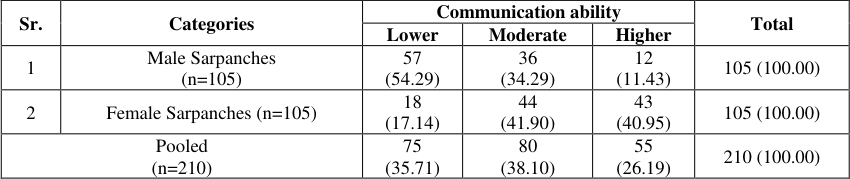 Table 12
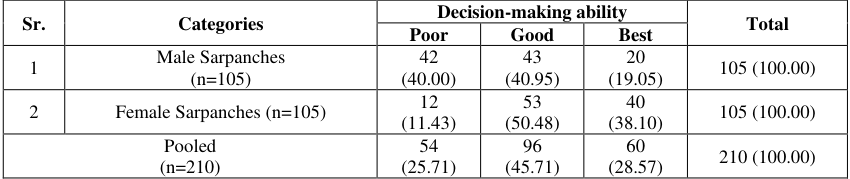 Table 13
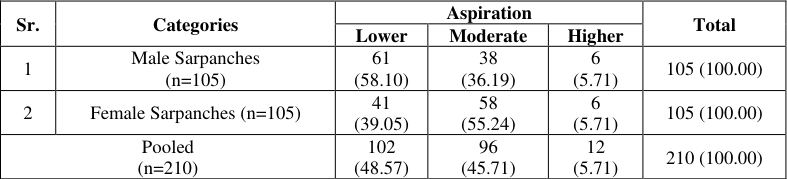 Table 14
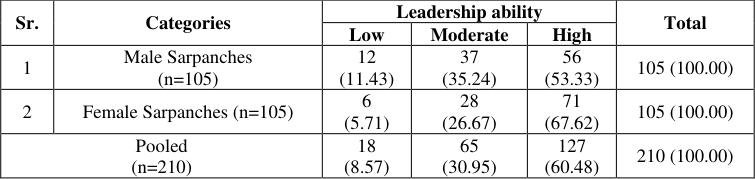 Table 15
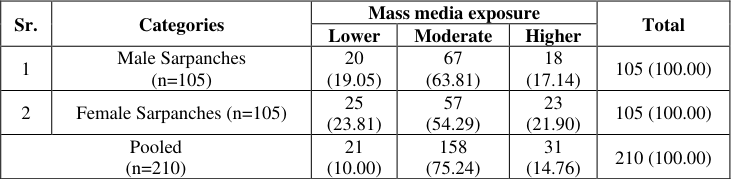 Table 16
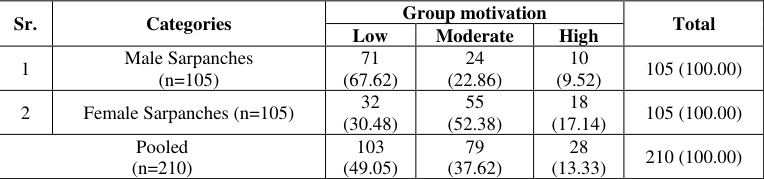 Table 17
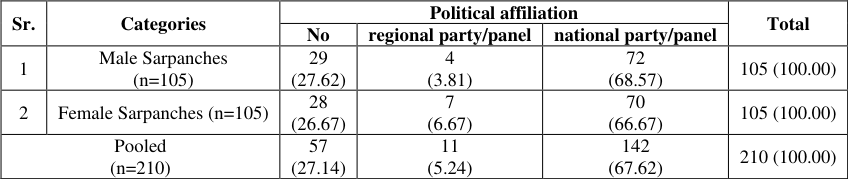 Table 18
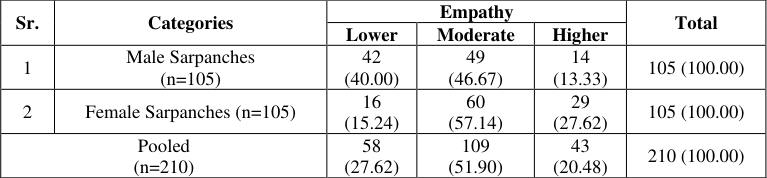 Table 19
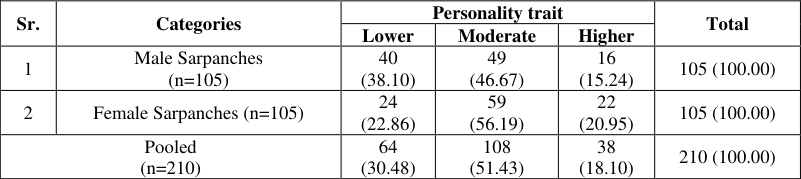 Table 20
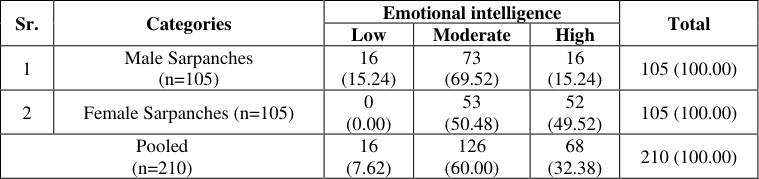 Table 21
Introduction
India's post-independence era marked a pivotal juncture in its developmental landscape, with a population of 359.0 million, wherein 55.00 percent were reliant on agriculture for sustenance. Recognizing the imperative of inclusive rural development, the nation embarked on a transformative journey of Democratic Decentralization. This paradigm shift www.extensionjournal.com
Results and Discussion Profile of the sarpanches
The profile is a short description. Data regarding the profile of Sarpanches were analyzed and presented in the following sequence.
Age:
The physical and psychological growth of an individual is intertwined with their age. Sarpanches were requested to disclose their age in full years. Subsequently, the gathered data were categorized into three groups: (i) young age (up to 35 years), (ii) middle age (36 to 50 years), and (iii) old age (above 50 years). The age data obtained are displayed in table 1. Education: Education facilitates desired alterations in one's behaviour. To assess this, information was gathered and segmented into four categories: (i) illiterate (note able to read and write), (ii) primary education (up to 7 th standard), (iii) secondary education (8 th to 12 th standard), and (iv) college education and beyond (graduation or postgraduation). The compiled data are presented in table 2. The distribution of respondents according to their education, as presented in Table 2, indicates variations among male and female Sarpanches as well as the pooled data. Among male Sarpanches, the majority possessed secondary education (61.90%), followed by primary education (22.86%), with a smaller percentage having a college education and above (13.33%). Similarly, among female Sarpanches, the highest proportion had secondary education (59.05%), followed by primary education (20.00%) and college and above education constituting a smaller portion (19.05%). Upon examining the pooled data, it's evident that the highest percentage of respondents had secondary education (60.48%), followed by primary education (21.43%), and college education and above (16.19%). The distribution of education levels among Sarpanches provides valuable insights into the educational backgrounds within this group. More than 75 percent of Sarpanches had secondary or more than secondary education is good for good governance.
| Sr. | Categories | Illiterate | Primary | Secondary | College & above | Total |
|---|---|---|---|---|---|---|
| 1 | Male Sarpanches (n=105) | 2 (1.90) | 24 (22.86) | 65 (61.90) | 14 (13.33) | 105 (100.00) |
| 2 | Female Sarpanches (n=105) | 2 (1.90) | 21 (20.00) | 62 (59.05) | 20 (19.05) | 105 (100.00) |
| Pooled (n=210) | 4 (1.90) | 45 (21.43) | 127 (60.48) | 34 (16.19) | 210 (100.00) |
Table text extracted from the original PDF; superscript letters are shown inline. The original table image is below.
View original table image
| Sr. | Categories | Age | — | — | Total |
|---|---|---|---|---|---|
| Young | Middle | Old | |||
| 1 | Male Sarpanches (n=105) | 10 (9.52) | 70 (66.67) | 25 (23.81) | 105 (100.00) |
| 2 | Female Sarpanches (n=105) | 42 (40.00) | 52 (49.52) | 11 (10.48) | 105 (100.00) |
| Pooled (n=210) | 52 (24.76) | 122 (58.10) | 36 (17.14) | 210 (100.00) |
Table text extracted from the original PDF; superscript letters are shown inline. The original table image is below.
View original table image
Caste
Caste is an inherent aspect determined at birth. To delve into this phenomenon, information was gathered and classified into four primary caste categories: (i) Scheduled Tribes (ST), (ii) Scheduled Castes (SC), (iii) Other Backward Classes (OBC), and (iv) General category and the data presented in table 3. The analysis of Table 3 reveals distinct patterns among male and female Sarpanches in terms of caste representation. Among the male Sarpanches, the majority, (67.62%) of total respondents belonged to the ST category, followed by 17.14 percent in the General category, 13.33 percent in the OBC category, and a minimal 1.90 percent in the SC category. Similarly, among female Sarpanches, the highest proportion identified with the ST category at 64.76 percent, with 20.00 percent in the General category, 11.43 percent in the OBC category, and the lowest representation at 3.81 percent in the SC category. When pooling data from both male and female Sarpanches, the dominant presence was from the ST category at 66.19 percent. The General category followed at 18.57 percent, while the OBC category constituted 12.38 percent, and the SC category had the smallest representation at 2.86 percent.
| Sr. | Categories | ST | SC | OBC | General | Total |
|---|---|---|---|---|---|---|
| 1 | Male Sarpanches (n=105) | 71(67.62) | 2(1.90) | 14(13.33) | 18(17.14) | 105 (100.00) |
| 2 | Female Sarpanches (n=105) | 68 (64.76) | 4(3.81) | 12.00 (11.43) | 21(20.00) | 105 (100.00) |
| Pooled (n=210) | 139 (66.19) | 6 (2.86) | 26 (12.38) | 39 (18.57) | 210 (100.00) |
Table text extracted from the original PDF; superscript letters are shown inline. The original table image is below.
View original table image
Annual income
In the present study, annual income refers to the total earnings of the Sarpanches within a year. Respondents were asked about their income and their responses were categorized into three groups: (i) low annual income (up to Rs. 50,000/-), (ii) medium annual income (Rs. 50,001 to 1,00,000/-), and (iii) high annual income (above Rs. 1,00,000/-). The data pertaining to the annual income of Sarpanches are delineated in table 4. The data in table 4 indicate that among male Sarpanches, the largest proportion reported a moderate annual income, accounting for 51.43 percent of the total respondents. This was followed by 31.43 percent reporting a low annual income and 17.14 percent reporting a high annual income. Similarly, among female Sarpanches, the majority, representing 52.38 percent, reported a moderate annual income, with 29.52 percent reporting a low annual income and 18.10 percent reporting a high annual income. Pooling data from both male and female Sarpanches, the majority reported moderate annual income, accounting for 51.90 percent of the total respondents. Low annual income was reported by 30.48 percent of respondents, while high annual income was reported by 17.62 percent. These findings offer insights into the distribution of annual income among Sarpanches, reflecting varying economic circumstances within this leadership role.
| Sr. | Categories | Annual income | — | — | Total |
|---|---|---|---|---|---|
| Low | Moderate | High | |||
| 1 | Male Sarpanches (n=105) | 33 (31.43) | 54 (51.43) | 18 (17.14) | 105 (100.00) |
| 2 | Female Sarpanches (n=105) | 31 (29.52) | 55 (52.38) | 19 (18.10) | 105 (100.00) |
| Pooled (n=210) | 64 (30.48) | 109 (51.90) | 37 (17.62) | 210 (100.00) |
Table text extracted from the original PDF; superscript letters are shown inline. The original table image is below.
View original table image
Land holding
Land holding refers to the total area owned by the Sarpanches at the time of the interview and is often regarded as a discriminator of economic status in Indian society. The collected data were categorized into three distinct groups: (i) small land holding (up to 2.00 ha.), (ii) medium land holding (2.01 to 5.00 ha.), and (iii) large land holding (above 5.00 ha.). The data are presented in table 5. The data presented in table 5 distinctly reveal that among male Sarpanches, the majority, constituting 56.19 percent of the total respondents, reported low landholding, followed by 24.7 6 percent reporting medium landholding and 17.14 percent reported high landholding. A small percentage, 1.90 percent, reported having no landholding. Similarly, among female Sarpanches, the highest proportion, at 48.57 percent, reported low landholding, followed by 24.76 percent reporting medium land holding, 16.19 percent reported having no landholding and 10.48 percent reported high landholding.
| Sr. | Categories | Land holding | — | — | — | Total |
|---|---|---|---|---|---|---|
| No | Low | Medium | High | |||
| 1 | Male Sarpanches (n=105) | 2 (1.90) | 59 (56.19) | 26 (24.76) | 18 (17.14) | 105 (100.00) |
| 2 | Female Sarpanches (n=105) | 17 (16.19) | 51 (48.57) | 26 (24.76) | 11 (10.48) | 105 (100.00) |
| Pooled (n=210) | 19 (9.05) | 110 (52.38) | 52 (24.76) | 29 (13.81) | 210 (100.00) |
Table text extracted from the original PDF; superscript letters are shown inline. The original table image is below.
View original table image
Pooling data from both male and female Sarpanches, 52.38 percent reported low landholding, 24.76 percent reported medium landholding, and 13.81 percent reported high landholding. A smaller percentage, 9.05 percent, reported having no landholding. These findings shed light on the diverse landholding patterns among Sarpanches, offering insights into their economic status and land ownership dynamics within local governance contexts.
Training
Training availed by the Sarpanches at different levels like village, block, district and state level. The collected data are presented in table 7.
| Sr. | Categories | Village level | Taluka level | District level | State level | Total |
|---|---|---|---|---|---|---|
| 1 | Male Sarpanches (n=105) | 40 (38.10) | 59 (56.19) | 6 (5.71) | 0 (0.00) | 105 (100.00) |
| 2 | Female Sarpanches (n=105) | 59 (56.19) | 42 (40.00) | 4 (3.81) | 0 (0.00) | 105 (100.00) |
| Pooled (n=210) | 99 (47.14) | 101 (48.10) | 10 (4.76) | 0 (0.00) | 210 (100.00) |
Table text extracted from the original PDF; superscript letters are shown inline. The original table image is below.
View original table image
Experience
It is widely believed that an individual's length of experience significantly influences decision-making in life.
To investigate this, data was collected and grouped into three categories: (i) lower (up to 3 years), (ii) medium (4 to 6 years), and (iii) higher (above 6 years) service experience.
The data are presented in table 10. The result obtained in table 14 displays that male Sarpanches, the majority, at 58.10 cent, exhibited lower aspiration, followed by 36.19 percent showing moderate aspiration, and the smallest proportion, at 5.71 percent, demonstrated higher aspiration. Among female Sarpanches, 55.24 percent showed moderate aspiration, followed by 39.05 percent exhibiting lower aspiration, and the smallest proportion, at 5.71 percent, demonstrated higher aspiration.
| Sr. | Categories | Aspiration | — | — | Total |
|---|---|---|---|---|---|
| Lower | Moderate | Higher | |||
| 1 | Male Sarpanches (n=105) | 61 (58.10) | 38 (36.19) | 6 (5.71) | 105 (100.00) |
| 2 | Female Sarpanches (n=105) | 41 (39.05) | 58 (55.24) | 6 (5.71) | 105 (100.00) |
| Pooled (n=210) | 102 (48.57) | 96 (45.71) | 12 (5.71) | 210 (100.00) |
Table text extracted from the original PDF; superscript letters are shown inline. The original table image is below.
View original table image
| Sr. | Categories | Lower experience | Moderate experience | Higher experience | Total |
|---|---|---|---|---|---|
| 1 | Male Sarpanches (n=105) | 50 (47.62) | 18 (17.14) | 37 (35.24) | 105 (100.00) |
| 2 | Female Sarpanches (n=105) | 65 (61.90) | 24 (22.86) | 16 (15.24) | 105 (100.00) |
| Pooled (n=210) | 115 (54.76) | 42 (20.00) | 53 (25.24) | 210 (100.00) |
Table text extracted from the original PDF; superscript letters are shown inline. The original table image is below.
View original table image
In the pooled data, the highest proportion, at 48.57 percent, exhibited lower aspiration, followed by 45.71 percent showing moderate aspiration, and the smallest percentage, at 5.71 percent, demonstrated higher aspiration.
Leadership ability
It For female Sarpanches, the majority, at 67.62 percent, exhibited high leadership ability, followed by 26.67 percent demonstrating moderate leadership ability, and the smallest proportion, at 5.71 percent, showed low leadership ability.
In the pooled data, the majority, at 60.48 percent, demonstrated high leadership ability, followed by 30.95 percent showing moderate leadership ability, and the smallest proportion, at 8.57 percent, exhibited low leadership ability.
Mass media exposure
It can be referred as the extent to which Sarpanches encounter specific messages and to confirm, the data in this regards were collected and grouped into three categories as, (i) lower mass media exposure (ii) moderate mass media exposure and (iii) higher mass media exposure. The classified data are presented in table 16. www.extensionjournal.com The data presented in table 17 shows that male Sarpanches, the majority, at 67.62 percent, exhibited low group motivation, followed by 22.86 percent with moderate group motivation, and the smallest proportion, at 9.52 percent, demonstrated high group motivation. Among Female Sarpanches, 52.38 percent showed moderate group motivation, followed by 30.48 percent with low group motivation and 17.14 percent exhibiting high group motivation.
| Sr. | Categories | Group motivation | — | — | Total |
|---|---|---|---|---|---|
| Low | Moderate | High | |||
| 1 | Male Sarpanches (n=105) | 71 (67.62) | 24 (22.86) | 10 (9.52) | 105 (100.00) |
| 2 | Female Sarpanches (n=105) | 32 (30.48) | 55 (52.38) | 18 (17.14) | 105 (100.00) |
| Pooled (n=210) | 103 (49.05) | 79 (37.62) | 28 (13.33) | 210 (100.00) |
Table text extracted from the original PDF; superscript letters are shown inline. The original table image is below.
View original table image
| Sr. | Categories | Mass media exposure | — | — | Total |
|---|---|---|---|---|---|
| Lower | Moderate | Higher | |||
| 1 | Male Sarpanches (n=105) | 20 (19.05) | 67 (63.81) | 18 (17.14) | 105 (100.00) |
| 2 | Female Sarpanches (n=105) | 25 (23.81) | 57 (54.29) | 23 (21.90) | 105 (100.00) |
| Pooled (n=210) | 21 (10.00) | 158 (75.24) | 31 (14.76) | 210 (100.00) |
Table text extracted from the original PDF; superscript letters are shown inline. The original table image is below.
View original table image
In the pooled data, the highest proportion, at 49.05 percent, exhibited low group motivation, followed by 37.62 percent with moderate group motivation, and the smallest percentage, at 13.33 percent, demonstrated high group motivation.
Political affiliation
Political affiliation refers to an individual's formal or informal association with a particular political party, ideology, or movement. The views of Sarpanches were collected and classified into three categories as, (i) no political affiliation (0 score), (ii) political affiliation with regional party/panel (1 score) and (iii) political affiliation with national party/panel (2 score). The classified data are presented in table 18. Table 18 depicts the distribution of respondents based on their political affiliation, categorized into three groups: no affiliation, affiliation with a regional party/panel, and affiliation with a national party/panel. Among Male Sarpanches, a similar trend is observed, with 68.57 percent affiliating with national parties/panels. Conversely, 27.62 www.extensionjournal.com percent of male respondents report no political affiliation, while a minimal 3.81 percent were affiliated with regional parties/panels. This pattern underscores the prevalence of national-level political ties among Male Sarpanches. Similarly, among Female Sarpanches, a majority, comprising 66.67 percent, are affiliated with national parties/panels. A smaller portion, 26.67 percent, reported no political affiliation, while 6.67 percent were affiliated with regional parties/panels. These figures mirror the broader trend observed in the pooled and Male Sarpanches data, indicating a prevalent association with national-level political entities among Female Sarpanches. The pooled data comprising 240 respondents demonstrates a significant preference for affiliation with national parties/panels, with 67.62 percent indicating such allegiance. This dominance is followed by 27.14 percent of respondents reporting no political affiliation, while only 5.24 percent are affiliated with regional parties/panels. This suggests a strong inclination towards national-level political entities among the surveyed population.
| Sr. | Categories | Political affiliation | — | — | Total |
|---|---|---|---|---|---|
| No | regional party/panel | national party/panel | |||
| 1 | Male Sarpanches (n=105) | 29 (27.62) | 4 (3.81) | 72 (68.57) | 105 (100.00) |
| 2 | Female Sarpanches (n=105) | 28 (26.67) | 7 (6.67) | 70 (66.67) | 105 (100.00) |
| Pooled (n=210) | 57 (27.14) | 11 (5.24) | 142 (67.62) | 210 (100.00) |
Table text extracted from the original PDF; superscript letters are shown inline. The original table image is below.
View original table image
Empathy: Empathy is the ability to understand and share the feelings, perspectives, and experiences of others. The views of the Sarpanches were collected and classified into three categories, (i) lower level of empathy (up to 12 score), (ii) moderate level of empathy (13 to 17 score) and (iii) higher level of empathy (above 17 score). The classified data are presented in table 19. 19 shows that male Sarpanches, 46.67 percent exhibited moderate empathy, followed by 40.00 percent with lower empathy, and the smallest proportion, at 13.33 percent, demonstrated higher empathy. Among Female Sarpanches, the majority, at 57.14 percent, showed moderate empathy, followed by 27.62 percent with higher empathy, and the smallest proportion, at 15.24 percent, exhibited lower empathy.
| Sr. | Categories | Empathy | — | — | Total |
|---|---|---|---|---|---|
| Lower | Moderate | Higher | |||
| 1 | Male Sarpanches (n=105) | 42 (40.00) | 49 (46.67) | 14 (13.33) | 105 (100.00) |
| 2 | Female Sarpanches (n=105) | 16 (15.24) | 60 (57.14) | 29 (27.62) | 105 (100.00) |
| Pooled (n=210) | 58 (27.62) | 109 (51.90) | 43 (20.48) | 210 (100.00) |
Table text extracted from the original PDF; superscript letters are shown inline. The original table image is below.
View original table image
In the pooled data, the highest proportion, at 51.90 percent, exhibited moderate empathy, followed by 27.62 percent with lower empathy, and the smallest percentage, at 20.48 percent, demonstrated higher empathy.
Personality trait
Personality traits reflect people's characteristic patterns of thoughts, feelings and behaviour. Personality traits imply consistency and stability. The views of the Sarpanches were collected and classified into three categories as, (i) lower personality trait (up to 12 score), (ii) moderate personality trait (13 to 17 score) and (iii) higher personality trait (above 17 score). The data are presented in table 20. Data from table 20 opined that for male Sarpanches, 46.67 percent exhibited moderate personality traits, followed by 38.10 percent with lower personality traits, and the smallest proportion, at 15.24 percent, demonstrated higher personality traits. Among Female Sarpanches, the majority, at 56.19 percent, showed moderate personality traits, followed by 20.95 percent exhibiting higher personality traits, and the smallest proportion, at 22.86 percent, exhibited lower personality traits.
| Sr. | Categories | Personality trait | — | — | Total |
|---|---|---|---|---|---|
| Lower | Moderate | Higher | |||
| 1 | Male Sarpanches (n=105) | 40 (38.10) | 49 (46.67) | 16 (15.24) | 105 (100.00) |
| 2 | Female Sarpanches (n=105) | 24 (22.86) | 59 (56.19) | 22 (20.95) | 105 (100.00) |
| Pooled (n=210) | 64 (30.48) | 108 (51.43) | 38 (18.10) | 210 (100.00) |
Table text extracted from the original PDF; superscript letters are shown inline. The original table image is below.
View original table image
In the pooled data, the highest proportion, at 51.43 percent, exhibited moderate personality traits, followed by 30.48 percent with a lower personality trait, and the smallest percentage, at 18.10 percent, demonstrated higher personality traits.
Emotional intelligence of sarpanches
Emotional intelligence (EI) refers to the ability to recognize, understand, manage, and effectively use one's own emotions, as well as those of others. It encompasses a range of skills and competencies that enable individuals to navigate social interactions, manage relationships, and cope with challenges in a healthy and productive manner. In the present study, a scale was developed by using the 'scale product method' which combines the equal appearing interval scale and summated rating technique for ascertaining the response on the scale as proposed by Eysenck and Crown (1949). In scale, all 18 statements were obtained and the views of Sarpanches in this regard were collected and classified into three categories, (i) low www.extensionjournal.com emotional intelligence (up to 42 score), (ii) moderate emotional intelligence (43 to 66 score) and (iii) higher emotional intelligence (above 66). The data are presented in table 21. The table 21 depicts that for male Sarpanches, 69.52 percent demonstrated moderate emotional intelligence, followed by 15.24 percent with high emotional intelligence, and another 15.24 percent with low emotional intelligence. Among female Sarpanches, the majority, at 50.48 percent, exhibited moderate emotional intelligence, followed by 49.52 percent with high emotional intelligence. There were no respondents with low emotional intelligence among female Sarpanches.
| Sr. | Categories | Emotional intelligence | — | — | Total |
|---|---|---|---|---|---|
| Low | Moderate | High | |||
| 1 | Male Sarpanches (n=105) | 16 (15.24) | 73 (69.52) | 16 (15.24) | 105 (100.00) |
| 2 | Female Sarpanches (n=105) | 0 (0.00) | 53 (50.48) | 52 (49.52) | 105 (100.00) |
| Pooled (n=210) | 16 (7.62) | 126 (60.00) | 68 (32.38) | 210 (100.00) |
Table text extracted from the original PDF; superscript letters are shown inline. The original table image is below.
View original table image
In the pooled data, the highest proportion, at 60.00 percent, demonstrated moderate emotional intelligence, followed by 32.38 percent with high emotional intelligence, and the smallest percentage, at 7.62 percent, demonstrated low emotional intelligence.
Conclusion
The comprehensive analysis of Sarpanches' profiles and emotional intelligence reveals intriguing insights. The majority of Sarpanches are middle-aged, with secondary education, and primarily from the Scheduled Tribe category. They predominantly hold moderate annual incomes and landholdings, indicating diverse economic backgrounds. Active involvement in community affairs and leadership roles underscores their significance in local governance.
Training at block and village levels is prevalent, with varied levels of management efficiency and group cohesiveness observed. The study highlights the need for tailored support and development initiatives to enhance leadership effectiveness and emotional intelligence among Sarpanches, ensuring more efficient local governance structures.
Acknowledgement
AcknowledgementThe authors extend their gratitude to Navsari Agricultural University for providing the platform to conduct this research.
Figures and tables from the paper
| Sr. | Categories | Management efficiency | — | — | Total |
|---|---|---|---|---|---|
| Lower | Moderate | Higher | |||
| 1 | Male Sarpanches (n=105) | 62 (59.05) | 35 (33.33) | 8 (7.62) | 105 (100.00) |
| 2 | Female Sarpanches (n=105) | 23 (21.90) | 74 (70.48) | 8 (7.62) | 105 (100.00) |
| Pooled (n=210) | 85 (40.48) | 109 (51.90) | 16 (7.62) | 210 (100.00) |
Table text extracted from the original PDF; superscript letters are shown inline. The original table image is below.
View original table image
| Sr. | Categories | Group cohesiveness | — | — | Total |
|---|---|---|---|---|---|
| Low | Moderate | High | |||
| 1 | Male Sarpanches (n=105) | 62 (59.05) | 37 (35.24) | 6 (5.71) | 105 (100.00) |
| 2 | Female Sarpanches (n=105) | 24 (22.86) | 56 (53.33) | 25 (23.81) | 105 (100.00) |
| Pooled (n=210) | 86 (40.95) | 93 (44.29) | 31 (14.76) | 210 (100.00) |
Table text extracted from the original PDF; superscript letters are shown inline. The original table image is below.
View original table image
| Sr. | Categories | Innovativeness | — | — | Total |
|---|---|---|---|---|---|
| Low | Moderate | High | |||
| 1 | Male Sarpanches (n=105) | 20 (19.05) | 52 (49.52) | 33 (31.43) | 105 (100.00) |
| 2 | Female Sarpanches (n=105) | 6 (5.71) | 36 (34.29) | 63 (60.00) | 105 (100.00) |
| Pooled (n=210) | 26 (12.38) | 88 (41.90) | 96 (45.71) | 210 (100.00) |
Table text extracted from the original PDF; superscript letters are shown inline. The original table image is below.
View original table image
| Sr. | Categories | Communication ability | — | — | Total |
|---|---|---|---|---|---|
| Lower | Moderate | Higher | |||
| 1 | Male Sarpanches (n=105) | 57 (54.29) | 36 (34.29) | 12 (11.43) | 105 (100.00) |
| 2 | Female Sarpanches (n=105) | 18 (17.14) | 44 (41.90) | 43 (40.95) | 105 (100.00) |
| Pooled (n=210) | 75 (35.71) | 80 (38.10) | 55 (26.19) | 210 (100.00) |
Table text extracted from the original PDF; superscript letters are shown inline. The original table image is below.
View original table image
| Sr. | Categories | Decision-making ability | — | — | Total |
|---|---|---|---|---|---|
| Poor | Good | Best | |||
| 1 | Male Sarpanches (n=105) | 42 (40.00) | 43 (40.95) | 20 (19.05) | 105 (100.00) |
| 2 | Female Sarpanches (n=105) | 12 (11.43) | 53 (50.48) | 40 (38.10) | 105 (100.00) |
| Pooled (n=210) | 54 (25.71) | 96 (45.71) | 60 (28.57) | 210 (100.00) |
Table text extracted from the original PDF; superscript letters are shown inline. The original table image is below.
View original table image
| Sr. | Categories | Leadership ability | — | — | Total |
|---|---|---|---|---|---|
| Low | Moderate | High | |||
| 1 | Male Sarpanches (n=105) | 12 (11.43) | 37 (35.24) | 56 (53.33) | 105 (100.00) |
| 2 | Female Sarpanches (n=105) | 6 (5.71) | 28 (26.67) | 71 (67.62) | 105 (100.00) |
| Pooled (n=210) | 18 (8.57) | 65 (30.95) | 127 (60.48) | 210 (100.00) |
Table text extracted from the original PDF; superscript letters are shown inline. The original table image is below.
View original table image
References
7 in the original paper- Goleman D. The emotional intelligence of leaders. Leader to Leader. 1998;10:20-26.
- Harrod NR, Scheer SD. An exploration of adolescent emotional intelligence in relation to demographic characteristics. Adolescence. 2005;40:503.
- Jadhav SB, Patel PL, Chaudhary BC. Relationship of Gram panchayat members with their role performance in agriculture development. Agriculture Update. 2011;6(2):46-49.
- Kharmudai A, Devrani L, Pandey DK, Singh R, Singh RJ. Communication Behaviour of Farmers registered under m4agriNEI. Ind Res J Ext Edu. 2018;18(3):1-5.
- Sadhu S, Sharma C. Factors influencing participation of women in panchayati raj institution: A study of Rajasthan. Int J Sci Res. 2014;3(11):2547-2553.
- Sangada, et al. Constraints faced by the Sarpanchs in Implementation of Selected Rural Development Activities in Tapi District of Gujarat State. Guj J Ext Edu. 2019; Special Issue on National Seminar; c2019 Jun.
- Shrivas RK. To study the role of elected representatives in Panchayati Raj system for agricultural development. Maha J Extn Edu. 2001;20:97-98.
Social participation
Social participation encompasses the active involvement of individuals in their communities, societies, or social groups. The gathered data were classified into four distinct categories: (i) no membership, (ii) membership in one organization, (iii) membership in more than one organization, and (iv) holding position in organization. These categorized data are presented in table 6. www.extensionjournal.com The distribution of respondents' social participation, as delineated in Table 6, unfolds a comprehensive picture of engagement levels among Sarpanches: Notable, none of the male or female Sarpanches reported a lack of membership in any organization, indicating a high level of social engagement within the community. Among male Sarpanches, the majority, comprising 75.24 percent, were affiliated with a single organization, while 56.19 percent of female Sarpanches shared this affiliation, showcasing a significant level of involvement in community activities.
Table text extracted from the original PDF; superscript letters are shown inline. The original table image is below.
View original table image
A considerable portion of respondents, accounting for 24.76 percent of males and 44.76 percent of females, were members in more than one organization, reflecting a diversified engagement in various social groups or initiatives.
Further reveal that a substantial proportion of Sarpanches, representing 80.95 percent of males and 75.24 percent of females, held leadership positions within their respective organizations, underscoring their active roles in driving community initiatives and governance.
Pooling data from both male and female Sarpanches, 65.71 percent were affiliated with a single organization, 34.29 percent were members of multiple organizations, and 78.10 percent held leadership positions. These findings highlight the diverse and active involvement of Sarpanches in community affairs, indicating their significant contributions to local governance and social cohesion.