
Research article · 2024 · Full text
International Journal of Research in AgronomyEconomic analysis of milk production in Himalayan state of India
Volume 7(3S) · Pages 113–117 · DOI: 10.33545/2618060x.2024.v7.i3sb.436 ↗
Research areasLivestock Management and Performance ImprovementAgricultural Economics and PracticesAgricultural risk and resilience
Abstract
Author-writtenThis study was conducted to analyse the profitability of milk production from indigenous and crossbred species and to identify the constraints for technically efficient dairying in the Himachal Pradesh state. Primary data was collected during 2020-2021 from 360 dairy farming households. Tabular analysis was employed to work out the profitability of milk production and Garrett's Ranking Technique (GRT) was performed to identify constraints faced by dairy farmers. The overall gross cost for Indigenous cattle was ₹. 108 per standard animal unit (SAU) per day. Whereas, crossbred cattle accounts double the maintenance cost of indigenous species (₹. 206.02). The average daily milk yield for crossbred (6.41 liters/ day/SAU) and for Indigenous (2.42 litres /day/ SAU). The net returns per SAU per animal in case of crossbred cattle in overall category was ₹ 8.59, whereas, net returns were highest for large category farms (₹ 9.70 per liter), followed by medium and least for small category farmers i.e., ₹ 7.60 and ₹ 6.80 respectively. In study area farmers were facing major constraint were lack of organized milk marketing facility at village level (65.84) followed by non-availability of green fodder throughout the season (64.23) followed by incidence of reproductive disorder (62.00), low productivity of animals (57.30) and less availability of land for fodder cultivation (58.28) in the state.
Summary
Source-checkedPlain-language reading of the full paper, prepared with AI and checked against the text. Each point links to the authors' own words.
Why it matters
- The livestock sector serves as a critical source of livelihood for people living in the mountainous regions of Himachal Pradesh. View evidence ↗
- The sector is a major contributor to agriculture, producing 1392 MT of milk annually, which provides a per capita availability of 565 g per day. View evidence ↗
- Developing dairying in hilly conditions is seen as a way to maximize resource efficiency and benefit farmers with limited resources. View evidence ↗
The question
- The study aimed to analyze the profitability of milk production from indigenous and crossbred cattle and identify constraints to technical efficiency in Himachal Pradesh. View evidence ↗
What they did
- Primary data was gathered from 360 dairy farming households between 2020 and 2021. View evidence ↗
- Households were stratified into three categories based on Standard Animal Units (SAU): Small (0.1-3.0 SAU), Medium (3.1-7 SAU), and Large (>7 SAU). View evidence ↗
- The researchers used tabular analysis to determine profitability and Garrett's Ranking Technique to identify the constraints faced by farmers. View evidence ↗
What they found
- The daily gross cost per SAU for indigenous cattle was ₹108, while crossbred cattle had nearly double the maintenance cost at ₹206.02. View evidence ↗
- Crossbred cattle produced a significantly higher average daily milk yield (6.41 liters/day/SAU) compared to indigenous cattle (2.42 liters/day/SAU). View evidence ↗
- For indigenous cattle, the overall net return per liter per SAU was ₹0.46, with small farms earning ₹0.05 and medium farms earning ₹0.87. View evidence ↗
- Crossbred cattle were more profitable, with an overall net return of ₹8.59 per liter; large farms saw the highest returns (₹9.70), followed by medium (₹7.60) and small farms (₹6.80). View evidence ↗
- Small farms incurred higher labor costs than large farms because large farms utilized mechanization (e.g., milking machines and grass choppers) while small farms relied on manual labor. View evidence ↗
- The primary constraints identified were lack of organized milk marketing (score 65.84), seasonal unavailability of green fodder (64.23), reproductive disorders (62.00), land scarcity for fodder (58.28), and low animal productivity (57.30). View evidence ↗
What it means
- The authors recommend that the government support indigenous cattle by increasing the sale price of their milk from ₹36.5 to ₹50 per liter and providing subsidized concentrates. View evidence ↗
- The study concludes that rearing crossbred cattle is a profitable enterprise in the state, particularly for large-scale farms. View evidence ↗
Figures & tables
From the original paper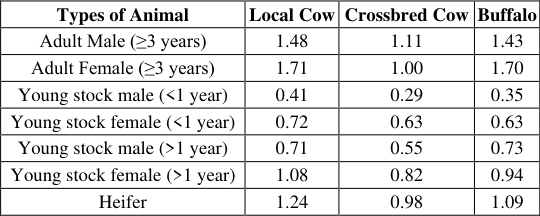 Table 1
 Table 2
 Table 2
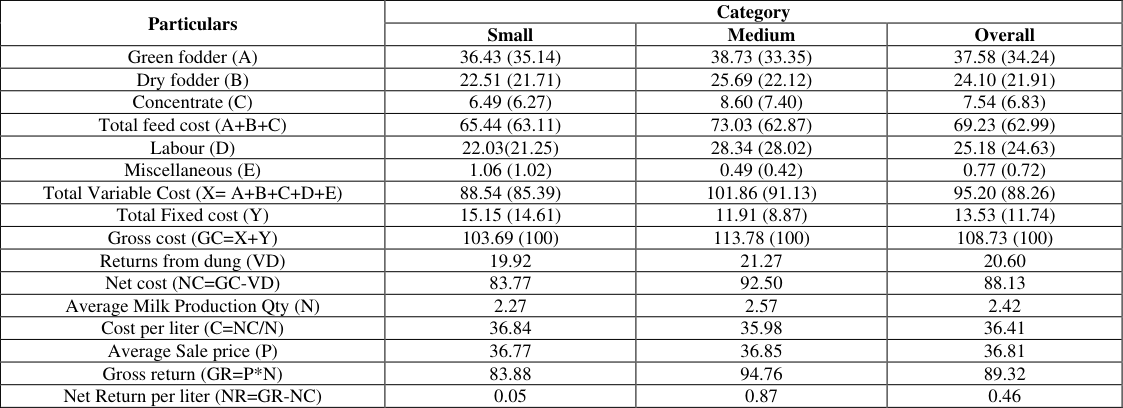 Table 3
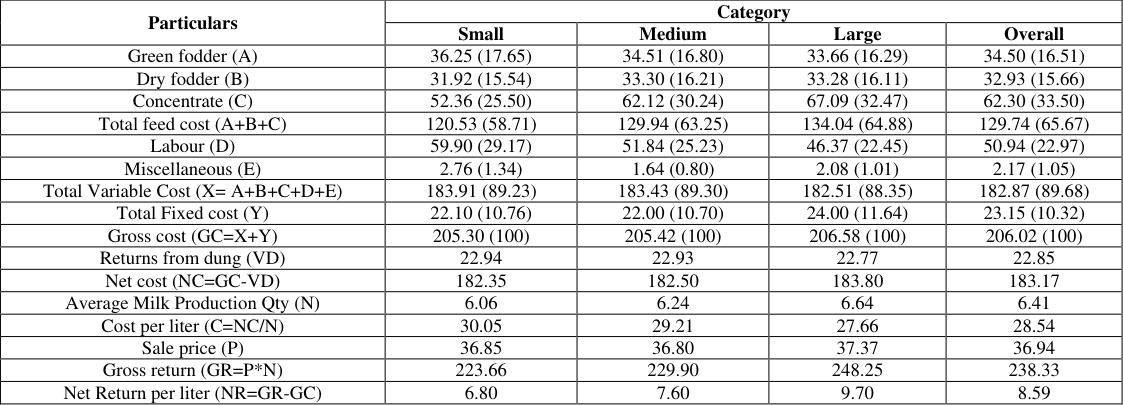 Table 4
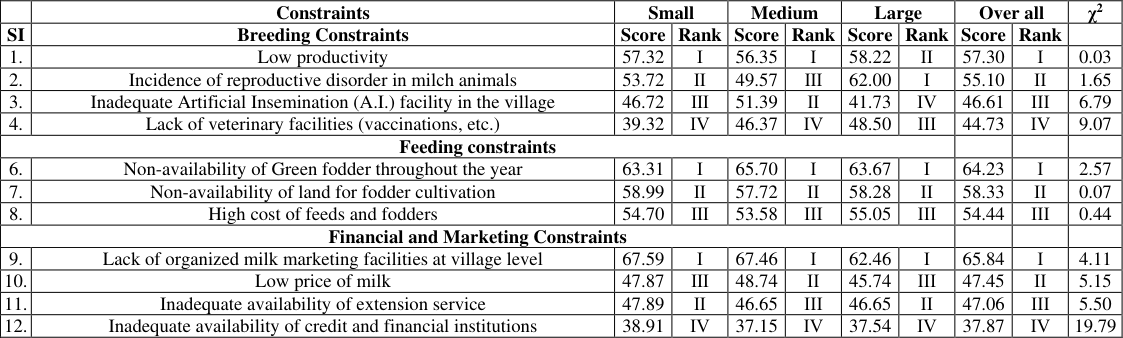 Table 5
Introduction
Livestock sector is an important source of livelihood in the mountainous terrains of the Himachal Pradesh. Himachal Pradesh encompasses total livestock population of 4.41 million in the year 2017, of which 55 percent encompasses of bovine and 40.8 percent ovine population of total livestock population. Livestock sector play an important role in livelihood of state and is a major contributor in agricultural sector with an annual milk production of 1392 MT with the per capita availability of 565 g day -1 (Anonymous, 2021) [2] . Prospects of dairying under hilly conditions would greatly benefit the resource-poor farmers and maximize resource use efficiency. Further, this sector can make significant contribution in promoting redistributive effect on income in favour of weaker sections. Agriculture, Horticulture, hydropower and tourism are important constituent of state's economy (Anonymous, 2019) [1] .
Methodology
For the construction of strata, the cumulative cube root frequency method (Singh and Mangat, 1996) [4] and Standard animal unit method (SAU) Sirohi et al. (2019) [7] was used as explained under. The data were collected on various aspects of dairy enterprises like the composition of the household, occupation, sex, family size, education of head of family, operational holding, herd size, type of animals and their value, dairy equipment, cattle shed along with their present value and expected life, the quantity of feeds and fodders fed to animals along with their prevailing prices, family and hired labour used along with prevailing wage rate, veterinary and miscellaneous expenditure. The information on milk production, consumption and disposal pattern milk and constraints of dairying was also collected. [7] Cube-root cumulative-frequency method In this study, SAUs was used as the covariate for the post stratification process. Dairy farmer households (360) were categorized into three classes, using the cube-root cumulativefrequency method (Singh and Mangat, 1996) [4] . For efficient distribution of households, 3-class stratification method was performed. Thus, range for Small (0.1-3.0 SAU), Medium (3.1-7 SAU) and Large (>7 SAU) were assigned.
Cumulative cube root frequency method
Where, L = No. of strata. L i = Upper limit of i th strata. y i-1 = Lower limit of the class in which L I lies. S k = Cumulative total of f i . f i = Cube root of the frequency of the i th class in which L i lies. S i-1 = Cumulative cube root of the frequency of preceding class to the class to which L i lies. y i = Upper limit of the class in which L i lies. y i -y i-1 = Width of the class in which L i lies. Cost and returns from milk production Information relating to various aspects of dairy farming was collected from selected farmers by survey method with a welldesigned and pre-tested interview schedule. The data on value of animals and investment on cattle shed and equipment were collected from dairy farmers. Details of inputs used like green fodder, dry fodder, concentrates with their quantities and price, labour employed with wage particulars, veterinary and breeding expenses and miscellaneous expenses and data on outputs like milk and manure were also collected from the sample dairy farmers. For the estimation and calculation of various costs, the following assumptions were made.
Fixed costs
Fixed costs do not vary with the level of output and remain unchanged over a short period of time. The various components of fixed cost are depreciation and interest on fixed capital. Capital Recovery Cost (CRC) method was used to calculate fixed cost. The interest on fixed capital does not need to be accounted for separately in CRC approach.
Depreciation costs: Depreciation is the loss of value of an asset due to its use over time and technological obsolescence. This was calculated by straight-line method.
The annual depreciation on cattle shed and store was calculated at the rate of 2 percent for 'pucca' shed and 5 percent for 'kachha' shed assuming the useful life of building as 50 and 20 years, respectively. The depreciation on equipment like chaff cutter, feed and water troughs, milking cans and utensils, bicycle (largely used for purchasing inputs and selling milk) were also calculated as per productive life of the individual equipment's by taking 7 percent as discount factor. The annual depreciation expenses were apportioned as per Standard Animal Unit (SAU) per day for the selected sample households.
Interest
The value of animal, cattle shed and other equipment's relating to milk production were taken as fixed capital. The interest on fixed capital was calculated at the rate of 4 percent per annum, which matches the interest rate being currently charged by the commercial banks. The annualized interest amount was calculated and apportioned per SAU per day.
Variable cost
Variable costs are those costs, which are incurred on the variable factors of production and can be altered in the short run. The major variable costs are feed and fodder cost, labour cost and veterinary and miscellaneous expenditures.
Feed cost
The dairy herd owners were using different types of green fodders and the prices of these fodders differed substantially. Therefore, to estimate the expenditure on fodder, weighted cost was used. The formula used for calculating weighted cost is given below.
Where, W = Weighted Costs (₹). Gi = Quantity of different types of green fodder (kg) which comprised of maize, sorghum, bajra etc. Pi = Price of different green fodder (₹/ kg).
Expenditure on dry fodder and concentrate feed were also calculated in the same manner used for green fodder. Whereas, the imputed cost of farmers farm grown feeds and fodder were taken into consideration as per market price of feeds and fodder prevailing in the study area. In the case of collection of grasses, the cost was computed according to the cost of labour incurred in fetching the grass.
Labour cost
It included cost of family as well as paid labour (hired labour). The cost of hired labour was calculated considering type of work allotted and wages paid whereas, family labour costs were determined on the basis of existing wage rate of permanent farm labour.
Veterinary and miscellaneous costs: The expenditure on breeding and health care of the animals was covered under the veterinary expense. It included, cost of artificial insemination (AI), natural service, vaccination, medicines, fee of veterinary doctor and other related expenses. The miscellaneous expenditure included expenses on repair of fixed assets, water and electricity charges, insurance premium and any other incidental charges. These being joint costs, apportionment of the same were based on SAU
Garrett's ranking technique
To find out the constraints faced by the farmers in production and marketing of milk in the study area, the Garrett's ranking technique (Garrett and Woodworth, 1969) [8] was used. Various constraints were framed for the study keeping in view the reports from the literature (Chand and Raju, 2008; Kumar et al 2013) [5] . Accordingly, constraints were identified and sub divided into breeding, feeding and other common constraints for arriving at the response from the farmers. The factors or constraints were prioritized by using Garrett's ranking technique in the following manner:
Percentage position = 100 (Rij-0.5) Nj
Where, Rij = Rank given for the ith item by the jth, respondent and. Nj = Number of items ranked by the jth, respondent.
The percentage position of each rank was converted into scores using Garrett table. For each constraint, scores of individual respondents were added together and divided by total number of respondents for whom scores were added. Then, mean score for each constraint was ranked by arranging them in the descending order.
Results
Results
Costs and returns of milk production from local cattle across the dairy farm categories in Himachal Pradesh
The estimates of cost and returns of the local cow milk production across the different categories are depicted in the table 3. The findings revealed that the net cost (NC) of maintenance per standard animal unit (SAU) was ₹ 88.13 per day, whereas, gross cost per SAU was ₹ 108.73 per day for overall category. The gross cost of maintenance for small farm (₹ 103.70) was lower as compared with medium farm (₹ 113.78). Total variable cost (TVC) accounts for 88.26 percent of gross cost for overall category, whereas, for small category farm accounts (85.39%) for medium farms (91.13%).
| Particulars | Category | — | — |
|---|---|---|---|
| Small | Medium | Overall | |
| Green fodder (A) | 36.43 (35.14) | 38.73 (33.35) | 37.58 (34.24) |
| Dry fodder (B) | 22.51 (21.71) | 25.69 (22.12) | 24.10 (21.91) |
| Concentrate (C) | 6.49 (6.27) | 8.60 (7.40) | 7.54 (6.83) |
| Total feed cost (A+B+C) | 65.44 (63.11) | 73.03 (62.87) | 69.23 (62.99) |
| Labour (D) | 22.03(21.25) | 28.34 (28.02) | 25.18 (24.63) |
| Miscellaneous (E) | 1.06 (1.02) | 0.49 (0.42) | 0.77 (0.72) |
| Total Variable Cost (X= A+B+C+D+E) | 88.54 (85.39) | 101.86 (91.13) | 95.20 (88.26) |
| Total Fixed cost (Y) | 15.15 (14.61) | 11.91 (8.87) | 13.53 (11.74) |
| Gross cost (GC=X+Y) | 103.69 (100) | 113.78 (100) | 108.73 (100) |
| Returns from dung (VD) | 19.92 | 21.27 | 20.60 |
| Net cost (NC=GC-VD) | 83.77 | 92.50 | 88.13 |
| Average Milk Production Qty (N) | 2.27 | 2.57 | 2.42 |
| Cost per liter (C=NC/N) | 36.84 | 35.98 | 36.41 |
| Average Sale price (P) | 36.77 | 36.85 | 36.81 |
| Gross return (GR=P*N) | 83.88 | 94.76 | 89.32 |
| Net Return per liter (NR=GR-NC) | 0.05 | 0.87 | 0.46 |
Table text extracted from the original PDF; superscript letters are shown inline. The original table image is below.
View original table image
The fixed cost (TFC) i.e. sum of rate of interest on fixed invested capital and depreciation on fixed capital accounted for 11.74 percent to gross cost. The TFC was higher on small category farms (14.61%) as compared to medium category farms (8.87%) because the farmers in hilly area were facing the higher initial establishment cost and lower maintenance cost. Feed cost accounted for 62.99 percent followed by 24.63 percent of labour cost and miscellaneous and veterinary cost accounted for only 0.72 percent of gross cost. Among the feed cost, green fodder accounted highest for indigenous cattle (34.24%) which varied between (₹ 36.43) and (₹ 38.73) for small and medium farms respectively. Emphasis on green fodder was higher for indigenous cattle because there was no much emphasis given on milk yield and managed with freely available resources. Milk productivity of indigenous cattle (2.27 liters per day) was vey less as compared to crossbred (6.6 liters per day) and buffalo (5.7 liters per day) and the emphasis on supply of concentrate feed was also low for indigenous cattle. The sale price per liter was on ₹ 36.67 which is similar to crossbred cattle milk so the sale price should be increased for indigenous milk because of its compositional quality. The net returns per liter per SAU were ₹ 0.46 which ranged between ₹ 0.05 for small farms and ₹ 0.87 for medium farms. The reason for rearing of local cattle even the net returns are negative is in sustainable milk production at lower cost of maintenance. These results are in line with Feroz et al.
(2019) [7] , also reported the returns from local were negative and as compared with crossbred and buffalo the returns were lowest.
Costs and returns from crossbred cattle of milk production across the dairy farm categories in Himachal Pradesh
The estimates of cost and returns of milk production of crossbred cattle for different categories are depicted in the Table 4. The findings revealed that the net return per liter of milk production from crossbred cattle in overall category was ₹ 8.59, whereas, at disaggregate level net returns from crossbred cattle were highest for large category farms (₹ 9.70 per liter), followed medium and least for small category farmers i.e., ₹ 7.60 and ₹ 6.80 respectively. The cost per liter of milk production was ₹ 28.54 for overall category, whereas, and it was least for large category (₹ 27.66 per liter) because the large farmers were technically efficient and the milk productivity of maintained breeds was higher than the breeds with small and medium category farmer. The large farmers were operating in economically high profitable zone compared with others. The large farmers were also having the particular consumers so that they can take risk and feed high quality feed and fodder, whereas, the small and medium category farmers can not able to take higher risk. Large farmers have absolute advantage hence purchase feed and fodder in large quantities. Among the cost components the total feed cost alone accounted for about 65.67 percent to the gross cost (GC) across the categories. Among feed cost, concentrate constitutes more than 33.50 percent to the GC. The cost of concentrates varied among categories, such as for small category it was 25.50 percent, for medium category 30.24 percent and for large farmers 32.47 percent of the GC. Likewise green fodder cost accounted for 16.51 percent in all the categories and was highest for small category farmers (17.65%), whereas, for large farmer it was 16.29 percent. The reason for decrease in cost of green fodder was due to positive correlation between herd size and land holding. The large farmers having their own land so they instead of depending entirely on purchase, produced green fodder by them self. In principle the crossbred cows are fed with lower amount of green fodder as compared to concentrate. The labour cost accounted more than 22.97 percent for all the categories with a range of 29.17 to 22.45 percent of gross cost for small and large category farms respectively. The labour cost in case of small farms was higher than the large farms because the large farms were technically efficient and adopted mechanization such as milking machine, grass chopper and water motor for cleaning the mats, but in case of small farms everything was done manually. The result also reveals that there is a positive association between the net returns and herd size. The overall maintenance cost was ₹. 183.17 per day per SAU and was highest (₹ 183/day/SAU) as large category farmer and lowest (₹ 182.35/day/SAU) for small category farmer. These results are similar to the results reported by Bardan et al. (2012) [9] who also reported that the cost of maintenance was highest for large farmers and least for small farmers. Khovieo et al. (2012) also reported that net returns for crossbred cows were higher for large category farmers as compared to small category farmers.
| Particulars | Category | — | — | — |
|---|---|---|---|---|
| Small | Medium | Large | Overall | |
| Green fodder (A) | 36.25 (17.65) | 34.51 (16.80) | 33.66 (16.29) | 34.50 (16.51) |
| Dry fodder (B) | 31.92 (15.54) | 33.30 (16.21) | 33.28 (16.11) | 32.93 (15.66) |
| Concentrate (C) | 52.36 (25.50) | 62.12 (30.24) | 67.09 (32.47) | 62.30 (33.50) |
| Total feed cost (A+B+C) | 120.53 (58.71) | 129.94 (63.25) | 134.04 (64.88) | 129.74 (65.67) |
| Labour (D) | 59.90 (29.17) | 51.84 (25.23) | 46.37 (22.45) | 50.94 (22.97) |
| Miscellaneous (E) | 2.76 (1.34) | 1.64 (0.80) | 2.08 (1.01) | 2.17 (1.05) |
| Total Variable Cost (X= A+B+C+D+E) | 183.91 (89.23) | 183.43 (89.30) | 182.51 (88.35) | 182.87 (89.68) |
| Total Fixed cost (Y) | 22.10 (10.76) | 22.00 (10.70) | 24.00 (11.64) | 23.15 (10.32) |
| Gross cost (GC=X+Y) | 205.30 (100) | 205.42 (100) | 206.58 (100) | 206.02 (100) |
| Returns from dung (VD) | 22.94 | 22.93 | 22.77 | 22.85 |
| Net cost (NC=GC-VD) | 182.35 | 182.50 | 183.80 | 183.17 |
| Average Milk Production Qty (N) | 6.06 | 6.24 | 6.64 | 6.41 |
| Cost per liter (C=NC/N) | 30.05 | 29.21 | 27.66 | 28.54 |
| Sale price (P) | 36.85 | 36.80 | 37.37 | 36.94 |
| Gross return (GR=P*N) | 223.66 | 229.90 | 248.25 | 238.33 |
| Net Return per liter (NR=GR-GC) | 6.80 | 7.60 | 9.70 | 8.59 |
Table text extracted from the original PDF; superscript letters are shown inline. The original table image is below.
View original table image
Constraints in the development of dairy Farming in Himachal Pradesh
According to the farm conditions the constraints were categorized into three groups i.e. breeding constraints, feeding constraints and financial and marketing constraints. The responses on commonly occurring problems by the farmers in the study area were arranged and analyzed by using Garret ranking technique and results of breeding, feeding and financial and marketing constraints are presented in Table 5.
| — | Constraints | Small | — | Medium | — | Large | — | Over all | — | χ2 |
|---|---|---|---|---|---|---|---|---|---|---|
| SI | Breeding Constraints | Score | Rank | Score | Rank | Score | Rank | Score | Rank | |
| 1. | Low productivity | 57.32 | Ⅰ | 56.35 | Ⅰ | 58.22 | ⅠⅠ | 57.30 | Ⅰ | 0.03 |
| 2. | Incidence of reproductive disorder in milch animals | 53.72 | Ⅱ | 49.57 | Ⅲ | 62.00 | Ⅰ | 55.10 | ⅠⅠ | 1.65 |
| 3. | Inadequate Artificial Insemination (A.I.) facility in the village | 46.72 | Ⅲ | 51.39 | Ⅱ | 41.73 | Ⅳ | 46.61 | ⅠⅠⅠ | 6.79 |
| 4. | Lack of veterinary facilities (vaccinations, etc.) | 39.32 | Ⅳ | 46.37 | Ⅳ | 48.50 | ⅠⅠⅠ | 44.73 | ⅠⅤ | 9.07 |
| Feeding constraints | ||||||||||
| 6. | Non-availability of Green fodder throughout the year | 63.31 | Ⅰ | 65.70 | Ⅰ | 63.67 | Ⅰ | 64.23 | Ⅰ | 2.57 |
| 7. | Non-availability of land for fodder cultivation | 58.99 | Ⅱ | 57.72 | ⅠⅠ | 58.28 | ⅠⅠ | 58.33 | ⅠⅠ | 0.07 |
| 8. | High cost of feeds and fodders | 54.70 | Ⅲ | 53.58 | ⅠⅠⅠ | 55.05 | ⅠⅠⅠ | 54.44 | ⅠⅠⅠ | 0.44 |
| Financial and Marketing Constraints | ||||||||||
| 9. | Lack of organized milk marketing facilities at village level | 67.59 | Ⅰ | 67.46 | Ⅰ | 62.46 | Ⅰ | 65.84 | Ⅰ | 4.11 |
| 10. | Low price of milk | 47.87 | Ⅲ | 48.74 | ⅠⅠ | 45.74 | ⅠⅠⅠ | 47.45 | ⅠⅠ | 5.15 |
| 11. | Inadequate availability of extension service | 47.89 | Ⅱ | 46.65 | ⅠⅠⅠ | 46.65 | ⅠⅠ | 47.06 | ⅠⅠⅠ | 5.50 |
| 12. | Inadequate availability of credit and financial institutions | 38.91 | Ⅳ | 37.15 | Ⅳ | 37.54 | Ⅳ | 37.87 | Ⅳ | 19.79 |
Table text extracted from the original PDF; superscript letters are shown inline. The original table image is below.
View original table image
Figures and tables from the paper
| Types of Animal | Local Cow | Crossbred Cow | Buffalo |
|---|---|---|---|
| Adult Male (≥3 years) | 1.48 | 1.11 | 1.43 |
| Adult Female (≥3 years) | 1.71 | 1.00 | 1.70 |
| Young stock male (<1 year) | 0.41 | 0.29 | 0.35 |
| Young stock female (<1 year) | 0.72 | 0.63 | 0.63 |
| Young stock male (>1 year) | 0.71 | 0.55 | 0.73 |
| Young stock female (>1 year) | 1.08 | 0.82 | 0.94 |
| Heifer | 1.24 | 0.98 | 1.09 |
Table text extracted from the original PDF; superscript letters are shown inline. The original table image is below.
View original table image
| Categories | Small | Medium | Large |
|---|---|---|---|
| Cumulative frequency range | 0-3 | 3.1-6.9 | ≥7 |
| Sample size (No.) | 177 | 119 | 64 |
Table text extracted from the original PDF; superscript letters are shown inline. The original table image is below.
View original table image
References
7 in the original paper- Anonymous. Ministry of Agriculture and Farmers Welfare Annual Reports 2019. Government of India; c2019.
- Anonymous. Economic Survey 2021. Economics and Statistics Department. Government of Himachal Pradesh; c2021.
- Lal P, Chandel BS. Total factor productivity in milk production in Haryana. Agric. Econ. Res. Rev. 2017;30:279-284.
- Feroze SM, Singh R, Sirohi S. Economics of milk production and factors affecting milk yield in Meghalaya: estimating the seasonal effect. Indian J Dairy Sci. 2019;72:328-335.
- Seh-Bardan BJ, Othman R, Wahid SA, Husin A, SadeghZadeh F. Bioleaching of heavy metals from mine tailings by Aspergillus fumigatus. Bioremediation Journal. 2012 Apr 1;16(2):57-65.
- Jadhav VJ, Pal M, Mishra GS. Etiological significance of Candida albicans in otitis externa. Mycopathologia. 2003 Dec;156(4):313-315.
- Thejesh S, Das A, Gururaj M, Khalandar S, Subash S, Sivaram M. Economic impact of COVID-19 pandemic on dairy farmers of Karnataka. The Indian Journal of Animal Sciences. 2022 Jan 1;92(1):126-131.
Cited by 2
From OpenAlex, OpenCitations and reference lists read by Scinovex
- Effect of fortified pine needle biochar on green fodder yield, nutrient uptake of oat and soil properties ↗
Abhishek Saxena, Prakash Chandra Srivastava, Prakash Chandra Srivastava, Anand Pathak, Satya Pratap Pachauri, Prashant K. Srivastava et al. · Soil Advances · 2024
In the Himalayan region, the low green fodder supply to livestock necessitates agronomic interventions, including the use of fortified pine needle biochar, a viable option for slow-release nutrients, to enhance fodder oat production, improve soil health, and safely manage the abundant pine needles that pose a fire risk. In a greenhouse study, the effect of different levels of pine needle…
❝ 7PDF - Economics and constraints of milk production in Chandrapur district of Maharashtra
Trupti S Ghate, VK Khobarkar, RD Vaidkar, UR Chinchmalatpure, SP Nage · International Journal of Agriculture Extension and Social Development · 2026
The present study estimated the maintenance cost and returns of cow and buffalo milk production and constrains during milk production in Chandrapur district, Maharashtra. Primary data for 2025 were collected from 120 randomly selected milk producers (60 buffalo and 60 cow) across four villages in two tahsils, through personal interviews using a pre-tested schedule and analyzed using standard cost concepts and frequency-percentage method. Results showed that although annual maintenance cost was higher for buffaloes (₹91,939.47) than cows (₹82,998.51), buffaloes yielded more milk (2,050.52 litre