
Research article · 2024 · Full text
International Journal of Agriculture Extension and Social DevelopmentMapping the dynamics of agriculture mechanization: present dynamics and future trajectories
Volume 7(3) · Pages 181–186 · DOI: 10.33545/26180723.2024.v7.i3c.425 ↗
Research areasAgriculture and Rural Development Research
Abstract
Author-writtenThe evolution of agricultural mechanization in India shows dynamic and location-specific trends. While studies often indicate a positive link between farm mechanization and crop yield, there is a research gap, particularly regarding farm power availability and mechanization in Eastern India, notably in Odisha. This study aims to fill this gap by examining the impact of farm power on crop production, productivity, and cropping intensity over three decades. Using verified secondary sources, statistical analysis, and district-wise mapping, the research provides comprehensive insights. The study reveals a significant change in the gender composition of the agricultural workforce, with the proportion of females increasing from 30% in 1991 to 44% in 2011. From 1996-97 to 2021-22, there was a notable shift in power sources for agricultural operations. Draught animal power decreased substantially from 87.30% to 15.44%, while tractors became the primary power source, accounting for 52.41% of total power and resulting in an overall farm power availability of 2.00 kW/ha. Despite the increase in farm power, there has been a recent decline in cropping intensity, attributed to various social welfare schemes. Combine harvester sales surpassed rice transplanter sales, while tractor sales slowed down. Despite the growing demand for farm mechanization, manual labour remains essential for tasks like sowing, weeding, and fertilizer application. In conclusion, the study's thorough assessment provides valuable insights for policymakers in the agricultural sector.Highlight: The present total farm power availability has attained a level of 2.00 kW/ha.
Summary
Source-checkedPlain-language reading of the full paper, prepared with AI and checked against the text. Each point links to the authors' own words.
Why it matters
- Agriculture is a vital economic driver in Asian countries like India, providing essential income for rural households and contributing significantly to the GDP. View evidence ↗
- Integrating farm mechanization into agricultural policies is necessary to lower cultivation costs, reduce labor-intensive work, and ensure operations are completed on time. View evidence ↗
- Although mechanization is generally linked to better crop yields, there is a lack of research on farm power availability and mechanization specifically in Eastern India, particularly in Odisha. View evidence ↗
The question
- The study aims to analyze how farm power has impacted crop production, productivity, and cropping intensity in Odisha over a thirty-year period. View evidence ↗
What they did
- The researchers used verified secondary data, statistical analysis, and district-level mapping to conduct their assessment. View evidence ↗
What they found
- The proportion of women in the agricultural workforce grew from 30% in 1991 to 44% in 2011. View evidence ↗
- From 1996-97 to 2021-22, the share of tractors in total farm power rose from 7.98% to 52.41%, and power tillers rose from 0.12% to 7.73%. View evidence ↗
- By 2022, the tractor density in Odisha reached approximately 40.52 units per thousand hectares of net sown area. View evidence ↗
- Despite increased power availability, cropping intensity decreased from 166% in 2011-12 to 158% in 2021-22. View evidence ↗
- Food grain productivity in the region increased from 0.732 t/ha in 1971-72 to 2.173 t/ha in 2021-22. View evidence ↗
- Manual labor remains essential for sowing, weeding, and applying fertilizer, despite the overall increase in machinery. View evidence ↗
What it means
- The authors recommend that future policies and research focus on balancing traditional practices with modern technology to ensure sustainable farming for both small and large-scale farmers. View evidence ↗
- The continued reliance on manual labor is limited by high machinery costs, limited access to credit, and general economic feasibility. View evidence ↗
Visual summary
2 visualsIllustrations explain the paper; charts are replotted from the paper's own table values.
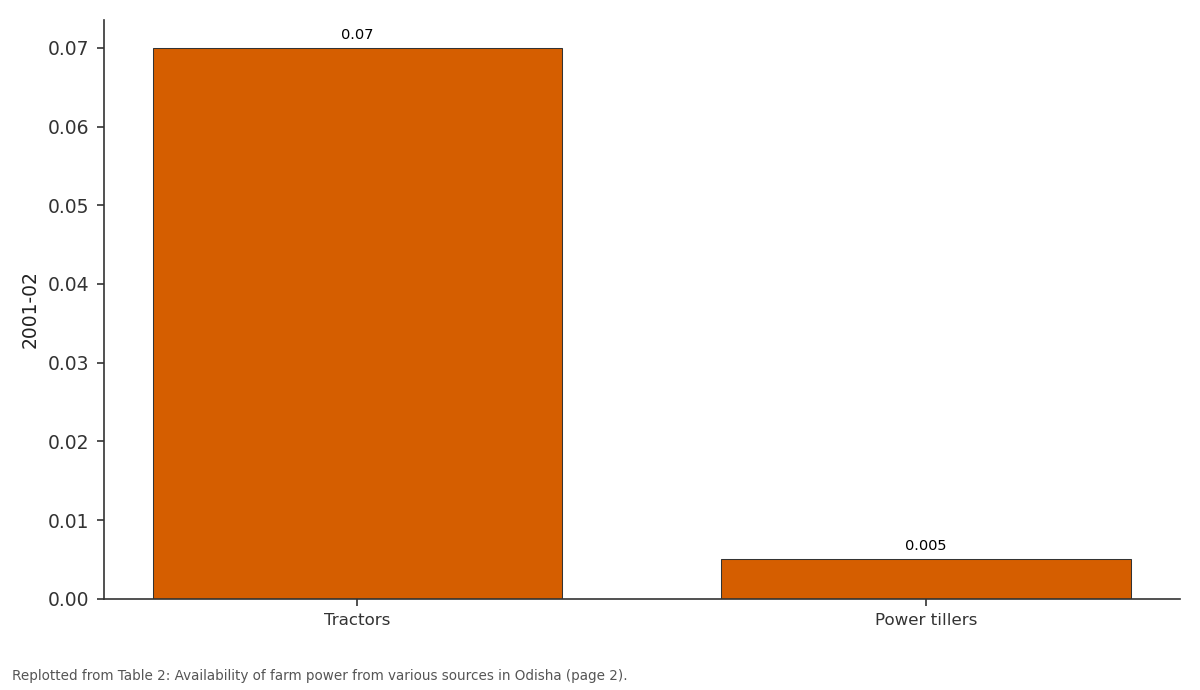
2001-02: Tractors vs Power tillers
Replotted from Table 2 (page 2) of the original paper. Every bar is the paper's own table value.
View source evidence ↗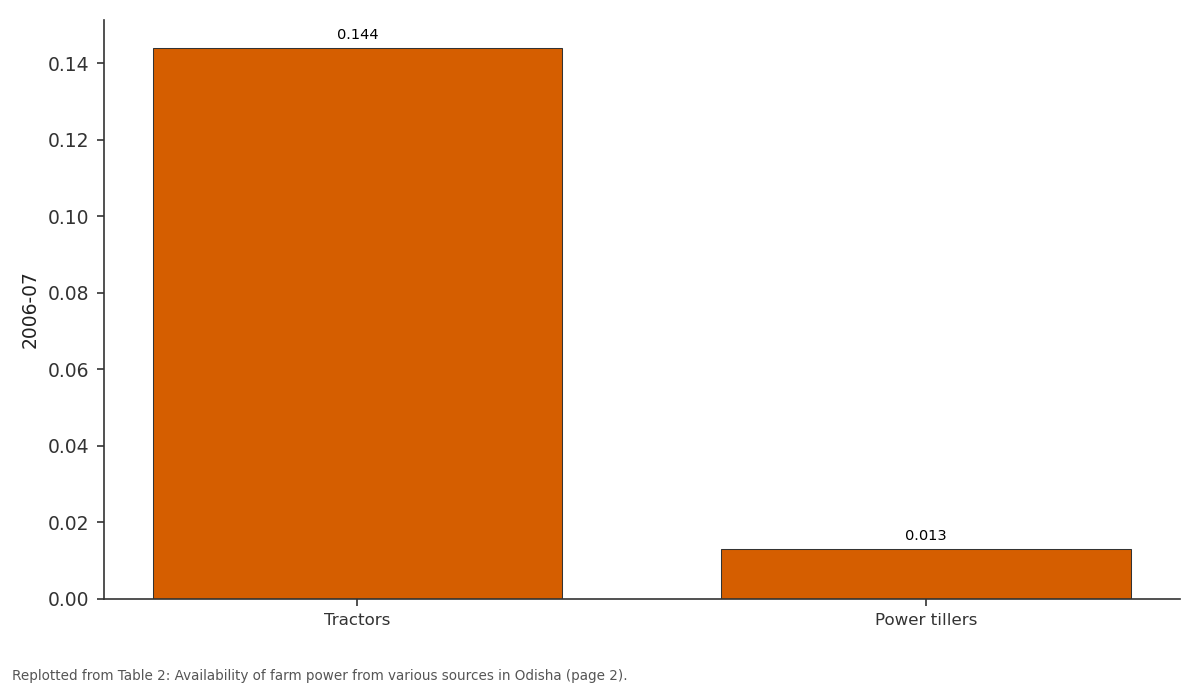
2006-07: Tractors vs Power tillers
Replotted from Table 2 (page 2) of the original paper. Every bar is the paper's own table value.
View source evidence ↗Figures & tables
From the original paper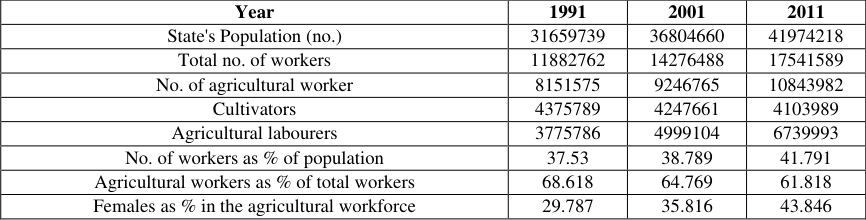 Table 1
 Table 2
 Table 2
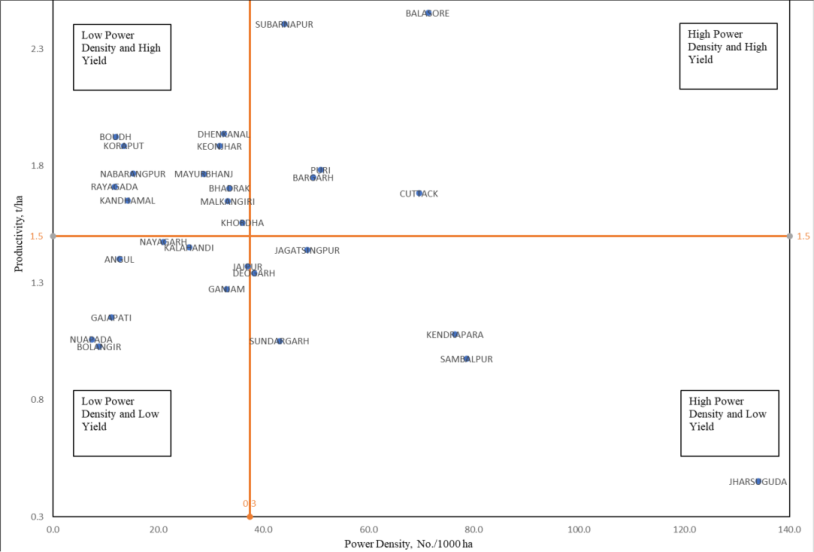 Figure 1
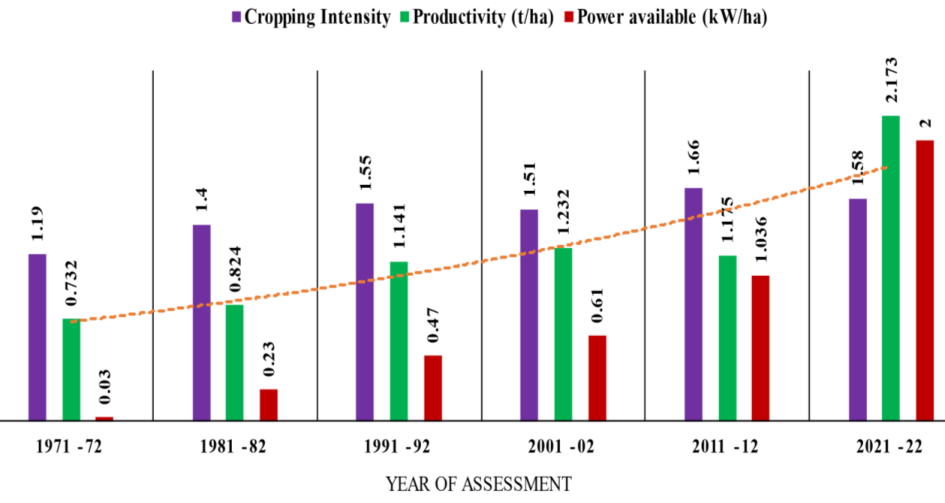 Figure 2
Introduction
In many Asian countries, including India, the agricultural sector plays a crucial role in the economy, providing income for rural households and contributing significantly to the GDP. Agricultural inputs can be broadly classified into durable inputs, such as farm machinery, which are used over extended periods, and consumable inputs, including seeds and fertilizers, which are used for shorter durations. Policies and investments in agriculture need to integrate farm mechanization to ensure timely operations, reduce labourintensive tasks, and lower cultivation expenses. Research has documented the advantages of mechanization in agriculture, including increased productivity and farm income (Kahlon, 1984; NCAER, 1980; Vaidyanathan, 2010) [27, 32, 45] , alleviation of physical strain on workers (Gupta, 2008) [46] , intensification of farming practices (Jodha, 1974) [26] , timely completion of operations (Bhalla & Singh, 2012) [14] , and overall enhancement in the efficiency of farm activities. However, the impact of farm mechanization on labour employment, particularly in labour-abundant countries like India, remains a subject of debate (Agarwal, 1983; Binswanger, 1978; 1986; 1987; Gifford, 1981; Hazell, 2009) [1,16,18,17,20,23] . Indian farmers are adopting farm mechanization at an accelerated pace compared to previous years (Ministry of Finance, GoI, 2018) [8] . Tractor and power tiller sales have more than doubled over the past decade, with annual tractor sales increasing from 2.5 lakh in 2004-2005 to 5.8 lakh in 2016-2017 (DoACFW, 2018). Similarly, annual power tiller sales rose from less than 18 thousand in 2004-2005 to over 45 thousand in 2016-2017 (DoACFW, 2018). The surge in agricultural mechanization in India can be attributed to increased production intensity, economic growth, and the commercialization of agriculture (Pingali, 2007) [34] . Regional variations in agricultural mechanization are influenced by agro-climatic conditions, cropping patterns, technological extension gaps, policy implementation disparities, and socio-economic factors. The Indo-Gangetic plain displays a higher adoption trend in agricultural mechanization than other regions. The concept of induced innovation suggests that rising wages and labour scarcity drive a shift towards mechanical power and laboursaving technology. The adoption of tractors and power tillers has surged in India, with a shift towards electrical and mechanical power sources. In India, sugarcane productivity is positively influenced by human labour, machinery, fertilizers, insecticides, and farm size. The adoption of mechanical technologies in densely populated Asian nations has enhanced agricultural productivity and reduced unit crop production costs. The state of Odisha has witnessed a notable surge in farm mechanization, with agricultural machinery sales exceeding Rs 805 crore in the fiscal year 2022-23, and a projected target of Rs 1000 crore for 2023www.extensionjournal.com 24. The state government has actively promoted improved farm machinery, contributing to the increased sales. Rajkhowa and Kubik (2021) [35] found that each incremental unit of agricultural mechanization increased the demand for hired labour by 12%. Based on the aforementioned facts, it is hypothesized that in Odisha, there has been a notable rise in farm mechanization due to the state government's promotion of enhanced machinery through subsidies and incentives. This initiative has resulted in increased sales of agricultural machinery. However, the degree of mechanization varies across different crops, indicating a requirement for additional investment in power resources to enhance mechanization in agriculture. Comprehending the factors influencing the adoption of mechanization is vital for informed policymaking and promoting farm mechanization among both large-scale and small-scale farmers.
Agrarian Workforce
The range of farm power sources includes agricultural labourers, draught animals, tractors, power tillers, diesel engines, and electric motors. Over the last three decades, there has been a notable shift in the proportional share of these power sources in agricultural activities. In Odisha, there are approximately 10.8 million agricultural workers, with females constituting 44% and agricultural workers comprising about 62% of the total worker population (Table 1). Data shows a decline in cultivator numbers, an upward trend in agricultural labourers, and a notable increase in female workers from 1991 to 2011. Similar trend has been observed in Indian scenario. The proportion of females in the agricultural workforce increased from 30% in 1991 to 44% in 2011 (Anonymous, 2011) [5] . Projections suggest a decrease in India's rural population to 62.83% by 2025 and further to 44.83% by 2050, emphasizing the continued significance of farm workers (Anonymous, 2011) [5] . Initiatives like the "Gender Mainstreaming" component of SMAM and gender-friendly equipment training aim to address gender concerns and enhance farm efficiency. Along with improvements in agricultural wages, inclusive and appropriate mechanization remains necessary in India (Mehta et al., 2014) [30] . In Odisha, the proportion of agricultural employees in total farm power has remained relatively consistent, ranging from 4.04% to 5.01% between 1996-97 and 2021-22 (Table 2). The power generated from draught animals has decreased from 0.45 kW/ha in 1996-97 to 0.30 kW/ha in 2021-22, with the percentage share dropping from 87.30% to 15.44% during the same period (Anonymous, 2012). This decline can be attributed to significant livestock loss caused by the super cyclone in October 1999. Meanwhile, power from tractors, power tillers, diesel engines, and electric motors has increased. In 2021-22, tractors contributed 52.41% to the total farm power available (Table 2). The current tractor population in Odisha exceeds two lakh units in 2021-22 (TMA, 2022), while power tillers have surged from 687 units in 1996-97 to 1, 49, 309 units in 2021-22 (DBT, 2022). Table 2 indicate, tractor and power tiller percentages in total farm power have increased from 7.98% to 52.41% and from 0.12% to 7.73%, respectively, between 1996-97 and 2021-22. The introduction of combine harvesters in Odisha began in 2007-08, with their share in total farm power reaching 0.062 kW/ha in 2021-22, and a population of approximately 7407 units. The share of diesel engines has grown from 0.000 kW/ha to 0.307 kW/ha, while electrical power's percentage share has increased from 0.55% to 1.00% between 1996-97 and 2021-22. The estimated total power availability in Odisha currently stands at about 2.00 kW/ha, exhibiting an increase from 0.523 to 2.000 kW/ha over the past three decades. The targeted value for total farm power availability in 2022 was 1.96, according to the SAMS report (Anonymous, 2018). Prior to the adoption of SMAM, the www.extensionjournal.com average farm power availability in Odisha was 1.442 kW/ha in 2014, growing to 1.647 kW/ha by the end of 2016-17, reflecting a 14.2% increase in farm power availability in three years (Anonymous, 2018). The Pearson correlation test (Table 3) indicates a strong positive correlation of tractor power (c.c.=0.993), followed by diesel engines (c.c.=0.989), power tillers (c.c.=0.982), combine harvesters (c.c.=0.935), and electrical power (c.c.=0.926) contributing to total farm power availability. .000 Agricultural workers also make a considerable contribution with a correlation coefficient of 0.640, while draught animals show a negative correlation of -0.827. Tractors have shown substantial growth (c.c.=0.957), followed by power tillers (c.c.=0.951), diesel engines (c.c.=0.908), agricultural labourers (c.c.=0.819), combine harvesters (c.c.=0.792), and electrical prime movers (c.c.=0.78).
| — | Pearson Correlation Coefficients | — | — | — | — | — | — | — |
|---|---|---|---|---|---|---|---|---|
| Agricultural workers | Draught animals | Tractors | Power tiller | Combine harvester | Diesel engine | Electrical power | Total | |
| Year | 0.819 | -0.860 | 0.957 | 0.951 | 0.792 | 0.908 | 0.780 | 0.949 |
| Total power | 0.640 | -0.827 | 0.993 | 0.982 | 0.935 | 0.989 | 0.926 | 1.000 |
Table text extracted from the original PDF; superscript letters are shown inline. The original table image is below.
View original table image
| Year | Farm power, kW/ha | — | — | — | — | — | — | — |
|---|---|---|---|---|---|---|---|---|
| Agricultural workers | Draught animals | Tractors | Power tillers | Combine harvesters | Diesel engines | Electrical power | Total | |
| 1996-97 | 0.021 | 0.456 | 0.042 | 0.001 | 0.000 | 0.000 | 0.003 | 0.523 |
| 2001-02 | 0.079 | 0.459 | 0.070 | 0.005 | 0.000 | 0.0001 | 0.003 | 0.616 |
| 2006-07 | 0.082 | 0.474 | 0.144 | 0.013 | 0.000 | 0.0004 | 0.003 | 0.717 |
| 2011-12 | 0.102 | 0.316 | 0.487 | 0.06 | 0.003 | 0.068 | 0.004 | 1.036 |
| 2016-17 | 0.096 | 0.296 | 0.669 | 0.12 | 0.017 | 0.188 | 0.007 | 1.389 |
| 2021-22 | 0.100 | 0.309 | 1.048 | 0.155 | 0.062 | 0.307 | 0.020 | 2.000 |
Table text extracted from the original PDF; superscript letters are shown inline. The original table image is below.
View original table image
| Year | 1991 | 2001 | 2011 |
|---|---|---|---|
| State's Population (no.) | 31659739 | 36804660 | 41974218 |
| Total no. of workers | 11882762 | 14276488 | 17541589 |
| No. of agricultural worker | 8151575 | 9246765 | 10843982 |
| Cultivators | 4375789 | 4247661 | 4103989 |
| Agricultural labourers | 3775786 | 4999104 | 6739993 |
| No. of workers as % of population | 37.53 | 38.789 | 41.791 |
| Agricultural workers as % of total workers | 68.618 | 64.769 | 61.818 |
| Females as % in the agricultural workforce | 29.787 | 35.816 | 43.846 |
Table text extracted from the original PDF; superscript letters are shown inline. The original table image is below.
View original table image
Agricultural Mechanization: Recent Advances
The agricultural machinery sector in the Asia-Pacific region has seen increased demand, with India driving market expansion for tractors, power tillers, and related equipment. In Odisha, tractors and power tillers have become primary sources of farm power, showing a notable increase in prevalence. This surge in power tiller adoption is due to the state's reliance on rice cultivation and the need to address the requirements of small and dispersed land holdings. Sales of agricultural machinery are on a consistent upward trend, indicating growing mechanization among farmers in the region. The trade of tractors in Odisha has grown at a Compound Annual Growth Rate (CAGR) of 2.5% over the past 12 years, with the 31-32 kW tractor segment dominating the market. The overall tractor density per thousand hectares of net sown area in Odisha reached approximately 40.52 in 2022. In contrast, the CAGR for tractor sales in India was 10.64%, with an overall tractor density of 30.31 per thousand hectares reported in 2014 (Mehta et al., 2014) [30] . At the district level, the mean tractor density per thousand hectares in Odisha is 44, with Cuttack district leading at 274 tractors per thousand hectares. Power tillers have also gained popularity, especially in irrigated regions with multiple rice crops annually. The power tiller market in India is mainly concentrated in the eastern and southern regions due to smaller land holdings and intensive rice cultivation. Over the past 15 years, power tiller sales in Odisha have grown at a CAGR of 8.6%, with 11,000 units sold in 2021-22. The estimated power tiller market in India reached 56,000 units during 2013-14 (Mehta et al., 2014) [30] . In Odisha, the overall power tiller density is approximately 27.84 per thousand hectares of net sown area, with VST Tillers Tractors Ltd. and Kerala Agro Machinery Corporation Ltd. emerging as dominant players. Figure 1 illustrates the correlation between tractor and power tiller density and productivity in Odisha's districts. Districts are categorized based on average power density and foodgrain productivity. The analysis reveals disparities in tractor and power tiller density and their relationship to major mechanical farm power sources, highlighting factors such as agricultural practices, resource availability, and farmers' awareness of mechanization. The introduction of combine harvesters in Odisha began in the fiscal year 2007-08, initially with only four units (DBT, 2022). Before this, combine harvesters from neighbouring Chhattisgarh were imported to western Odisha after completing their own state's harvesting work. Since 2007, the trade of combine harvesters in Odisha has shown a remarkable Compound Annual Growth Rate (CAGR) of 45.5%. The estimated combine harvester market in India comprises 4,000-5,000 units annually by sales, experiencing a CAGR of 28% since 2006 (Mehta et al., 2014) [30] . Among various types of combine harvesters, tractor-mounted wheeltype models have gained more popularity than track-type ones. Tractor-mounted combine harvesters constitute approximately 60% of the total combine harvester market in India (Mehta et al., 2014) [30] . Both tractor-mounted and self-propelled wheel-type combine harvesters are suitable for higher and medium-land paddy fields where waterlogging during harvesting is not a concern. Track-type combine harvesters are utilized in wet paddy fields during harvesting to avoid sinkage issues. All combine harvesters in the state are primarily used for custom hiring within their local areas. Some combine harvesters from districts like Balasore and Mayurbhanj also extend their services to neighbouring West Bengal, where paddy harvesting occurs later. The traditional method of manually transplanting rice in Odisha was exclusively carried out by female agricultural workers. However, a significant shift occurred in 2004-05 with the introduction of Chinese-made self-propelled rice transplanters, initially selling only 10 units (DBT, 2022). From 2005 to 2012, average annual sales of transplanters fluctuated between 10 and 45 units. Increased subsidies for rice transplanter purchases, as outlined in the Odisha Agricultural Policy of 2013, led to a substantial surge in average annual sales, exceeding 600 units from 2013 to 2016. Presently, the average sale of transplanters in Odisha has exceeded 1200 units per year. The Chinese 8-row selfpropelled riding-type transplanters were primarily used in paddy fields with smaller bunds and adequate water drainage facilities. However, their usage faced challenges in low-lying areas due to sinkage and maneuverability issues arising from the presence of only one traction wheel. Currently, 4-row walk-behind type transplanters, though priced higher than the 8-row variant, have gained more popularity. Several Indian companies import rice transplanters from China, Korea, and Japan, marketing them throughout India. Indian manufacturers like Mahendra & Mahendra Ltd. have also entered the market, promoting 4row walk-behind type rice transplanters, which have found adoption among many farmers in Odisha. Similar to combine harvesters, rice transplanters in Odisha are employed for custom hiring, with charges ranging from 800 to 1000 Rs/hour. The sale of rice transplanters in Odisha has experienced a Compound Annual Growth Rate (CAGR) of 30.4% since 2002, indicative of the growing acceptance and adoption of mechanized transplanting methods in rice cultivation. The rice transplanters industry witnessed a growth of more than 50% in 2014-15, with Chhattisgarh, Odisha, Bihar, and southern states exhibiting positive signs of technology adoption (Mehta et al., 2014) [30] . In Odisha, the market for rotavators and axial flow threshers stands out among various agricultural machinery. Initially imported from agriculturally advanced states like Punjab and Haryana, these machines are now locally produced by several manufacturers in Odisha. The average annual sales of rotavators and axial flow threshers surpass 5000 and 3000 units, respectively. Over the past two decades, rotavator sales have experienced a Compound Annual Growth Rate (CAGR) of 30.7%, while the sales of axial flow threshers have grown at a CAGR of 10.3% over the past 15 years. A similar trend is observed at the national level in India, with a CAGR of 10% for threshers and 20% for rotavators (Mehta et al., 2014) [30] . Despite advancements in agricultural machinery, tasks such as sowing, weeding, and fertilizer application continue to heavily rely on manual labour in Odisha. This reliance can be attributed to factors such as machinery cost, limited credit availability, and economic feasibility. Groundnut and green gram are two crucial non-paddy crops in Odisha that require strategic attention and supportive measures for effective crop diversification and increased cropping intensity. The diffusion of technical knowledge and targeted capacity development programs can complement efforts to make production cost-effective and profitable (Hossain et al., 2023) [24] . The suitability and compatibility of machinery with local farming practices and crop varieties further contribute to this reliance. Additionally, traditional farming practices, local customs, and labor availability influence farmers' preferences for manual labor in specific tasks. Nevertheless, ongoing efforts aim to promote the adoption of suitable machinery and enhance mechanization practices, ultimately improving agricultural efficiency and productivity.
Cropping Intensity
During 1971-72, Odisha's cropping intensity was 119% with a productivity of 0.732 t/ha (Fig. 2) (Anonymous, 2020). Subsequent power availability increases led to a rise in cropping intensity to 158%, with a productivity of 2.173 t/ha in 2021-22. However, there was a notable decrease in cropping intensity over the past decade, falling from 166% in 2011-12 to 158% in 2021-22. Conversely, power available per unit production increased from 0.88 kW/t in 2011-12 to 0.92 kW/t in 2021-22, indicating a decline in cropping intensity despite greater power availability. This decrease may be due to social welfare schemes like the "KALIA YOJANA" program, leading many small farmers to give up farming and rely on aid. Consequently, there has been a reduction in gross cropped area. However, food grain productivity has increased from 0.732 t/ha in 1971-72 to 2.173 t/ha in 2021-22. Farm power availability has also increased from 0.61 to 2.00 kW/ha between 2001 and 2022. A direct relationship between farm power availability and food grain productivity exists over the last few decades, showing an exponential trendline from 1971-72 to 2021-22 (Fig. 3). However, Tiwari et al., (2019) [42] found a linear trend between food grain productivity and power availability during 1960-61 to 2032-33 for the Indian agriculture scenario. This difference may be attributed to food grain production variability among different states of India. www.extensionjournal.com
Conclusion
Despite encountering several primary challenges, the farm mechanization industry in Odisha has made significant advancements, thus validating the hypothesis. Unlike other agricultural sectors, the structural framework of the farm mechanization industry is more intricate. Factors such as land size, cropping patterns, crop market prices (particularly the Minimum Support Price or MSP), availability of manpower, and labour costs all play crucial roles in shaping agricultural mechanization. These complexities pose significant barriers to the expansion of both the industry and agriculture in Odisha. The substantial increase in power tiller adoption, observed in Odisha, can be attributed to the region's heavy reliance on rice cultivation and the need to address challenges posed by small, widely dispersed land holdings. While the consistent growth in sales indicates an increasing acceptance of mechanization among farmers, it is important to note that manual labour still plays a significant role in crucial tasks such as sowing, weeding, and fertilizer application. Furthermore, there has been a decline in the proportion of power derived from agricultural workers and draft animals. The share of power from draft animals has decreased from 87.30% in 1996-97 to 16.19% in 2021-22, highlighting the importance of ensuring timely and efficient field operations. Over the past three decades, the average farm power availability and productivity has increased from 0.61 to 2.00 kW/ha and 1.23 to 2.17 t/ha respectively. This coexistence of traditional practices and modern technology underscores the complex dynamics shaping agricultural practices in the region. Future research and policy initiatives should aim to strike a balance between these approaches, ensuring sustainable and efficient agricultural practices for large-scale and small-scale farmers along with the foreseeable future.
References
17 in the original paper- Anonymous. Odisha Livestock Census -III. Odisha Livestock Resources Development Society (OLRDS). Government of Odisha. [Internet]. Available from: https://olrds.nic.in/upload/files/Odisha%20Livestock%2 0Census%20-III.pdf. [Accessed 16th March 2024].
- Binswanger H. Agricultural mechanization: a comparative historical perspective. The World Bank Research Observer. 1986;1(1):27-56.
- DBT. DBT Schemes for farm implements. Directorate of Agriculture & Food Production, Odisha. [Internet]. Available from: https://odishafarmmachinery.nic.in/. [Accessed 16th March 2024].
- Hayami Y, Ruttan VW. Agricultural productivity differences among countries. Am Econ Rev. 1970;60(5):895-911.
- Mehta CR, Pajnoo RK. Role of Japan in promotion of agricultural mechanization in India. Agric Mech Asia Am Lat Am. 2013;44(4):15-17.
- Mehta CR, Chandel NS, Senthilkumar T. Status, challenges and strategies for farm mechanization in India. Agric Mech Asia Afr Lat Am. 2014;45(4):43-50.
- Mehta CR, Chandel NS, Jena PC, Jha A. Indian agriculture counting on farm mechanization. Agric Mech Asia Afr Lat Am. 2019;50(1):84-89.
- Pingali P. Agricultural mechanization: adoption patterns and economic impact. In: Handbook of agricultural economics. 2007;3:2779-2805.
- Rajkhowa P, Kubik Z. Revisiting the relationship between farm mechanization and labour requirement in India. Indian Econ Rev. 2021;56(2):487-513.
- Ruttan VW. Productivity growth in world agriculture: sources and constraints. J Econ Perspect. 2002;16(4):161-184.
- Shambhu VB, Jha SK. Problems and Prospects of Agricultural Mechanization in Bihar, India. AMA Agric Mech Asia Afr Lat Am. 2012;43(3):55.
- Singh G. Estimation of a mechanisation index and its impact on production and economic factors-A case study in India. Biosyst Eng. 2006;93(1):99-106.
- Singh G. Agricultural mechanisation development in India. Indian J Agric Econ. 2015;70(902-201668362):64-82.
- Tiwari PS, Singh KK, Sahni RK, Kumar V. Farm mechanization-trends and policy for its promotion in India. Indian J Agric Sci. 2019;89(10):1555-1562.
- TMA. Tractor and Mechanization Association. Confederation of Indian Industry. https://www.tmaindia.in/. 2022.
- Upreti P, Singh A. An economic analysis of sugarcane cultivation and its productivity in major sugar producing states of Uttar Pradesh and Maharashtra. Econ Aff. 2017;62(4):711-718.
- Gupta D, Denton B. Appointment scheduling in health care: Challenges and opportunities. IIE transactions. 2008 Jul 21;40(9):800-19.
Cited by 2
From OpenAlex, OpenCitations and reference lists read by Scinovex
- Climate and land use dynamics in India’s livestock industry ↗
Souryabrata Mohapatra, Dukhabandhu Sahoo, Kirtti Ranjan Paltasingh · China Agricultural Economic Review · 2026
Purpose India’s high-value livestock sector is integral to rural livelihoods and food security, yet it faces mounting pressures from climate change and resource constraints. This study empirically investigates how climate variability and land use influence livestock production and population dynamics, with a focus on India’s vulnerable rainfed-mixed systems. Design/methodology/approach Using district-level data from 301 districts across 15 major Indian states,…
❝ 2PDF - Agricultural mechanization as a catalyst for enhancing rice production and farmer livelihoods ↗
R. Ayu Chairunnisya, Yaumil Khairiyah, R L Lubis, Khairun Purgawa, Junianto S. Batubara, R Izzati et al. · IOP Conference Series Earth and Environmental Science · 2025
Abstract Agricultural mechanization is a key driver for improving crop productivity and farmer livelihoods in Indonesia, especially as the population is projected to reach 318.9 million by 2045, heightening food demand under the pressures of climate change. This study investigates the impact of mechanization on rice production in five provinces: East Java, West Java, Central Java, South Sulawesi, and South…
❝ 2PDF