
Research article · 2024 · Full text
International Journal of Agriculture Extension and Social DevelopmentProduction trend and export performance of apple from Afghanistan
Volume 7(3) · Pages 123–128 · DOI: 10.33545/26180723.2024.v7.i3b.418 ↗
Research areasPlant Physiology and Cultivation StudiesAgricultural Economics and Practices
Abstract
Author-writtenAfghanistan’s horticultural sector has been growing steadily, and it play a significant role in the economy of the country. In 2019, fruit production in Afghanistan covered around 222 thousand hectares of arable land, representing almost (2.84%) of the total arable land area. Furthermore, the county presently produces approximately 1.5 million tonnes of fresh fruits annually. Wardak province was the highest apple producing province in Afghanistan as compared to another province. Wardak had the highest share in area under apple production with 29.05 percent while the production share was with 29.31 percent during 2007–2013; however, the share in area and production decreased from 2014–2019, which witnessed negative (-4.94%) and (-1.37%), respectively. However, the province observed a positive change in productivity (0.4%). The production of apple was 54,769 tonnes which accounted (9.71%) exported from Afghanistan during 2007, more ever in the year 2019 production increased to 2,50,324 tonnes, however percentage of export decreased to (9.33%). The percentage share of Afghanistan's apple exports to the world market ranges from almost negligible to (0.02%) between 2012 to 2020. The majority of Afghanistan's apples are exported to Pakistan and India. Exports of apples from Afghanistan to Pakistan in terms of value declined from (97.71%) in 2008 to (85.00%) in 2020. India shares import in term of quantity increased from 154.30 tonnes in 2008 to 1,379.79 tonnes in 2020, and in term of values increased from (2.00%) in 2008 to (9.00%) in 2020.
Summary
Source-checkedPlain-language reading of the full paper, prepared with AI and checked against the text. Each point links to the authors' own words.
Why it matters
- Agriculture is critical to Afghanistan's economic development, serving as the primary income source for approximately 75% of rural households. View evidence ↗
- Apples are a key horticultural commodity in Afghanistan, with trade expanding at an average rate of 22%. View evidence ↗
- Government support for production and export systems is considered essential for reducing poverty among small and medium-scale farmers and ensuring sustainability. View evidence ↗
The question
- The study aimed to evaluate the extent of apple production in Afghanistan and its significance within the agricultural sector, specifically regarding export activities. View evidence ↗
What they did
- The research used time series data on apple cultivation in Afghanistan for the 2020-21 agricultural year. View evidence ↗
- Compound Annual Growth Rate (CAGR) analysis was employed to determine growth trends in apple production area, total production, and productivity. View evidence ↗
- The Revealed Comparative Advantage (RCA) index was used to assess Afghanistan's comparative trading patterns for apples relative to global exports. View evidence ↗
- Markov chain analysis was applied to annual export data from 2008 to 2020 to determine the competitiveness and shifts in apple export composition. View evidence ↗
What they found
- Apple productivity rose from 6.80 to 9.10 tonnes per hectare between 2007 and 2019, though the CAGR of -0.68% was non-significant. View evidence ↗
- Afghanistan's share of the global apple export market remained very low, ranging from nearly zero to 0.02% between 2012 and 2020. View evidence ↗
- India's import of Afghan apples grew from 154.30 tonnes in 2008 to 1,379.79 tonnes in 2020, with its value share increasing from 2.00% to 9.00%. View evidence ↗
- Afghanistan demonstrated competitiveness in the global apple market, as indicated by RCA values greater than one and RSCA values greater than zero. View evidence ↗
- Markov chain analysis showed that Pakistan retained 98.65% of its import share from Afghanistan and gained competitiveness relative to India and other nations. View evidence ↗
What it means
- The authors conclude that although Afghanistan ranks 46th globally in apple production, it is competitive in the global market. View evidence ↗
Visual summary
2 visualsIllustrations explain the paper; charts are replotted from the paper's own table values.
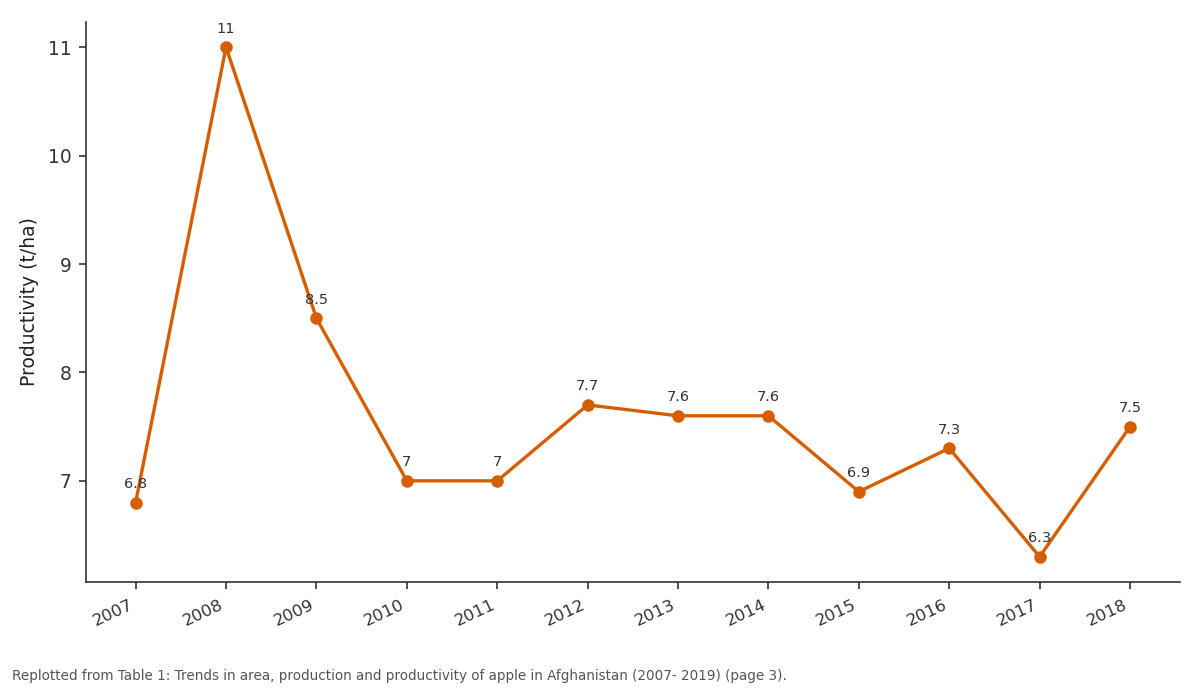
Productivity (t/ha): 2007 vs 2008 vs 2009 vs 2010 vs 2011
Replotted from Table 1 (page 3) of the original paper. Every bar is the paper's own table value.
View source evidence ↗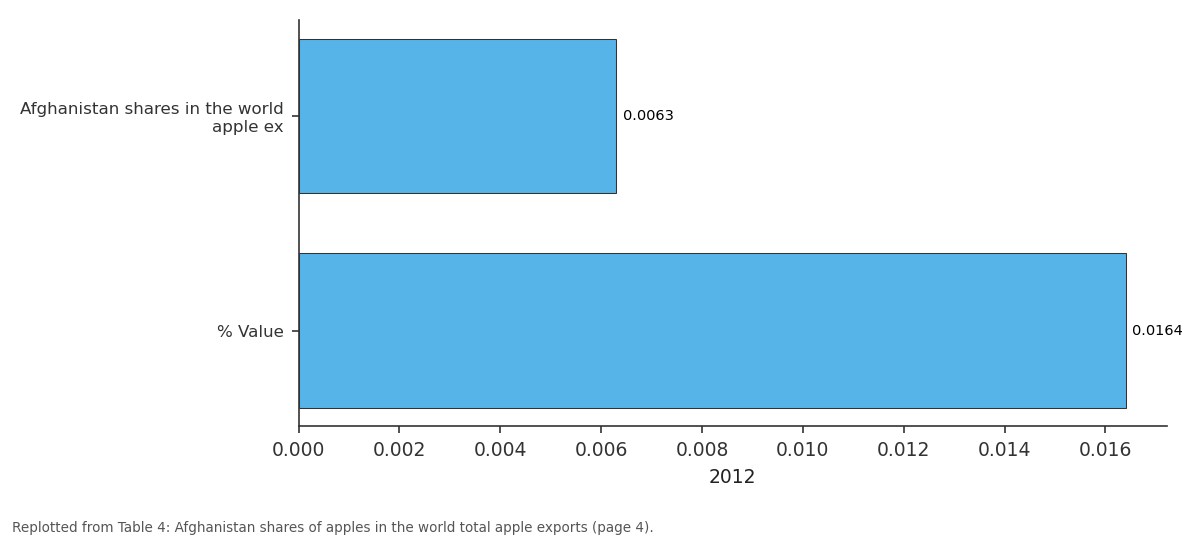
2012: Afghanistan shares in... vs % Value
Replotted from Table 4 (page 4) of the original paper. Every bar is the paper's own table value.
View source evidence ↗Figures & tables
From the original paper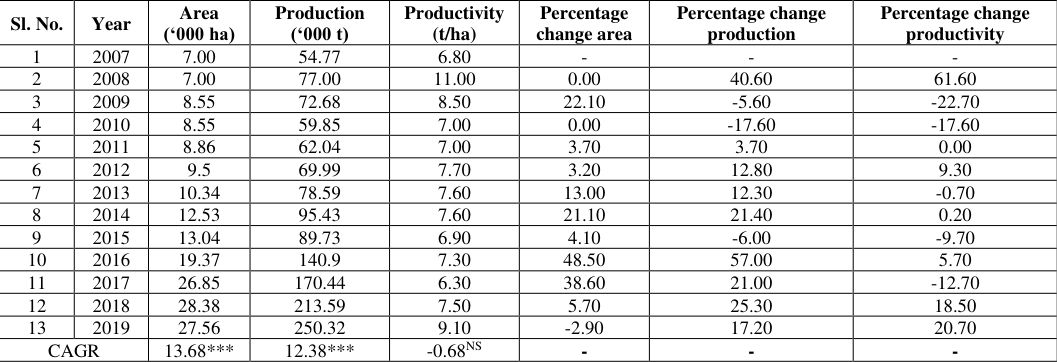 Table 1
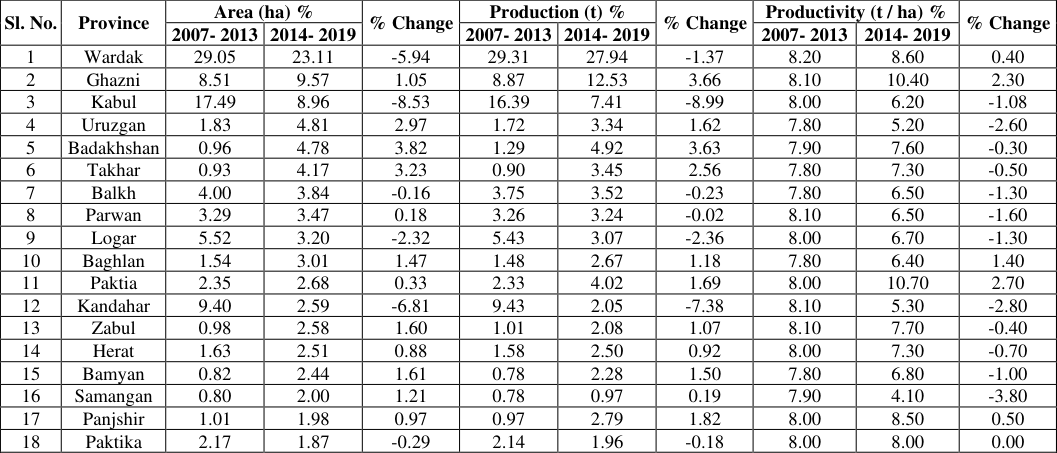 Table 2
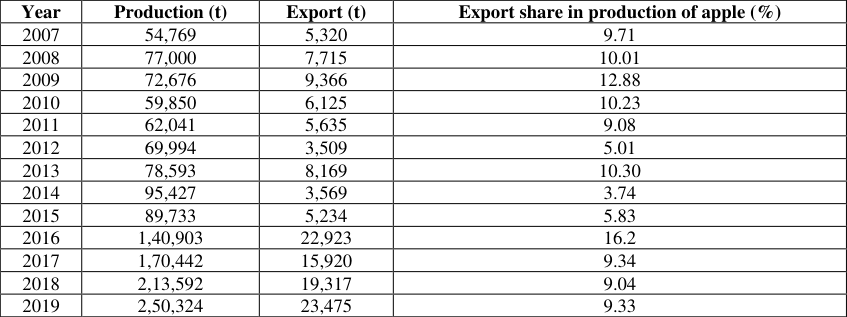 Table 3
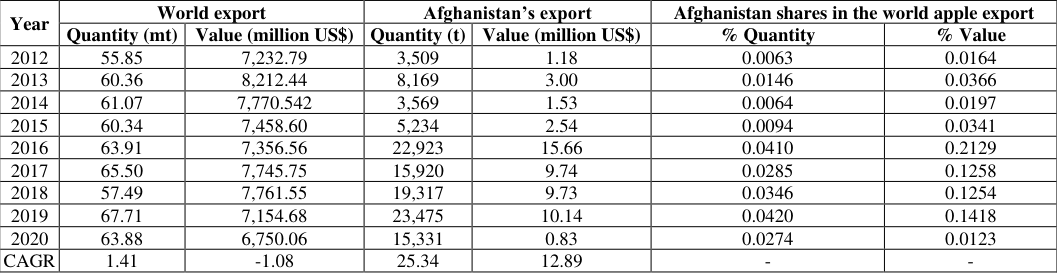 Table 4
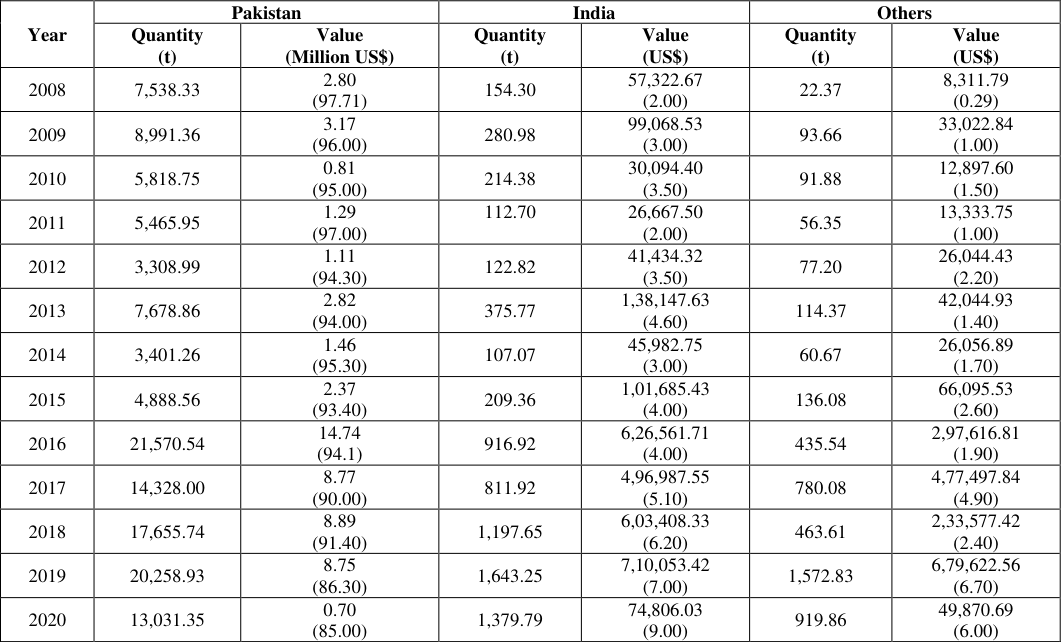 Table 5
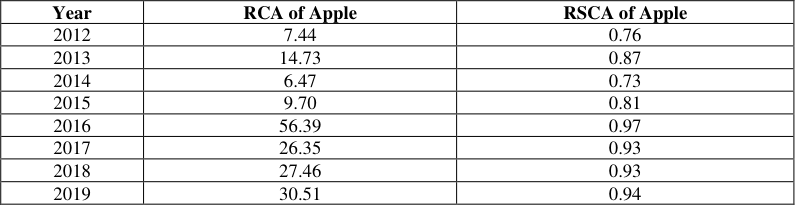 Table 6
 Table 7
Introduction
Afghanistan's economic development is heavily dependent on agriculture. Nearly (75%) of rural households rely on agriculture as their main source of income. According to Anonymous (2020) [2] , the combined contribution of agriculture and its allied industries to the GDP in 2020 was 27.01 percent. Apple holds a significant position in horticulture commodities traded in Afghanistan and its trade has expanded at a rate of 22 percent on average in the markets. Apple is a temperate-climate fruit. It is native to many parts of temperate Europe and Asia. Its origin is in Central Asia. Apple is a highly popular fruit in Afghanistan and holds the second position in terms of production, right after grapes. The cultivation of apple is practiced in all the province of Afghanistan. Major contributors' provinces to the apple production are Wardak, Ghazni, Kabul, Uruzgan, Badakhshan, Takhar etc. As per the horticulture census in 2019, the total area occupied was 27,559 hectares, with a production of 2,503,242 tonnes. The average yield of apples in Afghanistan was 9.08 tonnes per hectare during 2019. Almost all apples produced in Afghanistan are sold in Afghanistan, Pakistan and India and used for fresh consumption, with only small quantities used for processing into products such as apple juice, jelly, and jam. Afghan apples are in high demand around the world, with Pakistan and India being the main importers. The overall performance of agriculture depends, not only on efficiency in marketing or supply, but also on production efficiency. Government intervention in the production system and export capabilities are imperative to ensure sustainability and improve rural life by reducing poverty among small and medium scale farmers. Export competitiveness studies are essentially empirical exercises that test economic theory predictions and provide insights into the transfer of production changes to other sectors, reflecting factory utilization levels and market efficiency. The study focused on evaluating the production and export of Afghanistan's main commercial horticultural crops, which is (Apple). The study aimed to measure the extent of apple production and its significance in the country's agricultural sector, specific in term of export activities. www.extensionjournal.com
Materials and Methods
Materials and Methods
Source of data
The research was conducted in Afghanistan for the agricultural year 2020-21, utilizing time series data on apple cultivation. The study focused on variables such as area, production, productivity, and apple exports from Afghanistan.
Compound Annual Growth Rate (CAGR)
The compound annual growth rate (CAGR) analysis was carried out to ascertain the growth in area, production and productivity of apple in Afghanistan. The mean annual growth rate of a parameter over a defined period of time. Compound fit is given by the equation.
Where, Y = Dependent variable (Area / Production / Productivity) a = Intercept (constant) b = Regression coefficient 'a' and 'b' are the parameters to be estimated t = time period Ut= Disturbance term for the year 't' Ordinary Least Squares (OLS) approach was used to estimate the equation (1) after it was translated into log linear form as shown below.
The given relationship was used to calculate the compound growth rate (g) as a percentage.
Where, g = Compound growth rate in percent per annum b = Antilog of b The significance of regression co-efficient was tested using, 't' test as defined below Where, bi = Regression co-efficient SE(bi) = Standard error of the regression co-efficient The standard error of the regression co-efficient was used to test its significance with 't' statistic.
Markov Chain Analysis
The Markov chain analysis was utilized to determine the competitiveness of the export of apple composition from Afghanistan. Annual export data from 2008 to 2020 in quantities as well as value terms realized were used for the analysis. The trade direction of Afghanistan's apple exports was analyzed using the first order Markov chain approach. Central to Markov chain analysis is the estimation of the transitional probability matrix "P" whose elements indicate the probability of export switching from country "i" to country 'j' over time. The diagonal element where i=j, measures the probability of a country retaining its market share, or, in other words, the loyalty of an importing country to a particular country's exports.
Revealed Comparative Advantage Index (RCA)
The RCA index is calculated as the ratio between two shares. The numerator represents the proportion of a country's total exports of a specific commodity to its overall exports, while the denominator represents the proportion of global exports of the same commodity to total global exports. The concept of RCA, introduced by Balassa in 1965, 1977, 1986, and 1989, pertains to the comparative trading patterns of countries concerning specific goods. The Balassa's index is calculated as, Where:
= Revealed comparative advantage ratio for Afghanistan apple = Afghanistan's exports of apple = Total exports of Afghanistan = World export of apple = World total exports RCA value lies between 0 and ∞. A country is said to have a comparative advantage if the value exceeds 1.
Revealed Symmetric Comparative Advantage (RSCA)
The RCA index has a wide range from one to infinity when a country has a comparative disadvantage, making it difficult to compare. On the other hand, the RSCA index is more concise,
Results and Discussion
The results in Table 1 depicts that the area under apple cultivation in the year 2007 was 7.00 thousand hectares which had been increased significantly to 27.56 thousand hectares in the year 2019 with cumulative compound annual growth rate (CAGR) of 13.68. Similarly, the production has increased from 54.77 thousand tonnes to 250.32 thousand tonnes from 2007 to 2019 with a significant positive change in (CAGR) 12.38 percent. Whereas the productivity of apple has increased from 6.80 to 9.10 tonnes per hectare from 2007 to 2019 with a non-significance CAGR -0.68 percent. As a studied of (Mohammad, S. et al 2020) [9] which was conducted on Economic analysis of apple production in Kabul province, Afghanistan, the production of was 1,70,443 metric tons in 2017 to 2018. [2] . and own competition
| Sl. No. | Year | Area (‘000 ha) | Production (‘000 t) | Productivity (t/ha) | Percentage change area | Percentage change production | Percentage change productivity |
|---|---|---|---|---|---|---|---|
| 1 | 2007 | 7.00 | 54.77 | 6.80 | - | - | - |
| 2 | 2008 | 7.00 | 77.00 | 11.00 | 0.00 | 40.60 | 61.60 |
| 3 | 2009 | 8.55 | 72.68 | 8.50 | 22.10 | -5.60 | -22.70 |
| 4 | 2010 | 8.55 | 59.85 | 7.00 | 0.00 | -17.60 | -17.60 |
| 5 | 2011 | 8.86 | 62.04 | 7.00 | 3.70 | 3.70 | 0.00 |
| 6 | 2012 | 9.5 | 69.99 | 7.70 | 3.20 | 12.80 | 9.30 |
| 7 | 2013 | 10.34 | 78.59 | 7.60 | 13.00 | 12.30 | -0.70 |
| 8 | 2014 | 12.53 | 95.43 | 7.60 | 21.10 | 21.40 | 0.20 |
| 9 | 2015 | 13.04 | 89.73 | 6.90 | 4.10 | -6.00 | -9.70 |
| 10 | 2016 | 19.37 | 140.9 | 7.30 | 48.50 | 57.00 | 5.70 |
| 11 | 2017 | 26.85 | 170.44 | 6.30 | 38.60 | 21.00 | -12.70 |
| 12 | 2018 | 28.38 | 213.59 | 7.50 | 5.70 | 25.30 | 18.50 |
| 13 | 2019 | 27.56 | 250.32 | 9.10 | -2.90 | 17.20 | 20.70 |
| CAGR | 13.68*** | 12.38*** | -0.68NS | - | - | - |
Table text extracted from the original PDF; superscript letters are shown inline. The original table image is below.
View original table image
Province wise share in the area, production and productivity of apple in Afghanistan
The province wise analysis reveals in Table 2 that the area and production are highest in Wardak Province in Afghanistan compared to another province. Wardak had the highest share in area under apple production with (29.05%) while the production share was (29.31%) in period I (2007-13). The share in area and production decreased in Period II (2014-2019), which witnessed a negative (-5.94%) and (-1.37%) share in area and production, respectively. However, the province observed a positive change in productivity (0.4 %) despite the significant negative change in area. Other provinces in Afghanistan, such as Ghazni, Kabul, and Uruzgan, are also higher apple producer provinces in Afghanistan. As reported by (Matiullah, A. et al., 2015) [7] The major area of apple production, that is, producing more than 1,000 metric tons per year, are Ghazni, Kabul, Paktika, Wardak. Wardak is the first province by cultivation and producing of apple in Afghanistan. [2] .
| Sl. No. | Province | Area (ha) % | — | % Change | Production (t) % | — | % Change | Productivity (t / ha) % | — | % Change |
|---|---|---|---|---|---|---|---|---|---|---|
| 2007- 2013 | 2014- 2019 | 2007- 2013 | 2014- 2019 | 2007- 2013 | 2014- 2019 | |||||
| 1 | Wardak | 29.05 | 23.11 | -5.94 | 29.31 | 27.94 | -1.37 | 8.20 | 8.60 | 0.40 |
| 2 | Ghazni | 8.51 | 9.57 | 1.05 | 8.87 | 12.53 | 3.66 | 8.10 | 10.40 | 2.30 |
| 3 | Kabul | 17.49 | 8.96 | -8.53 | 16.39 | 7.41 | -8.99 | 8.00 | 6.20 | -1.08 |
| 4 | Uruzgan | 1.83 | 4.81 | 2.97 | 1.72 | 3.34 | 1.62 | 7.80 | 5.20 | -2.60 |
| 5 | Badakhshan | 0.96 | 4.78 | 3.82 | 1.29 | 4.92 | 3.63 | 7.90 | 7.60 | -0.30 |
| 6 | Takhar | 0.93 | 4.17 | 3.23 | 0.90 | 3.45 | 2.56 | 7.80 | 7.30 | -0.50 |
| 7 | Balkh | 4.00 | 3.84 | -0.16 | 3.75 | 3.52 | -0.23 | 7.80 | 6.50 | -1.30 |
| 8 | Parwan | 3.29 | 3.47 | 0.18 | 3.26 | 3.24 | -0.02 | 8.10 | 6.50 | -1.60 |
| 9 | Logar | 5.52 | 3.20 | -2.32 | 5.43 | 3.07 | -2.36 | 8.00 | 6.70 | -1.30 |
| 10 | Baghlan | 1.54 | 3.01 | 1.47 | 1.48 | 2.67 | 1.18 | 7.80 | 6.40 | 1.40 |
| 11 | Paktia | 2.35 | 2.68 | 0.33 | 2.33 | 4.02 | 1.69 | 8.00 | 10.70 | 2.70 |
| 12 | Kandahar | 9.40 | 2.59 | -6.81 | 9.43 | 2.05 | -7.38 | 8.10 | 5.30 | -2.80 |
| 13 | Zabul | 0.98 | 2.58 | 1.60 | 1.01 | 2.08 | 1.07 | 8.10 | 7.70 | -0.40 |
| 14 | Herat | 1.63 | 2.51 | 0.88 | 1.58 | 2.50 | 0.92 | 8.00 | 7.30 | -0.70 |
| 15 | Bamyan | 0.82 | 2.44 | 1.61 | 0.78 | 2.28 | 1.50 | 7.80 | 6.80 | -1.00 |
| 16 | Samangan | 0.80 | 2.00 | 1.21 | 0.78 | 0.97 | 0.19 | 7.90 | 4.10 | -3.80 |
| 17 | Panjshir | 1.01 | 1.98 | 0.97 | 0.97 | 2.79 | 1.82 | 8.00 | 8.50 | 0.50 |
| 18 | Paktika | 2.17 | 1.87 | -0.29 | 2.14 | 1.96 | -0.18 | 8.00 | 8.00 | 0.00 |
Table text extracted from the original PDF; superscript letters are shown inline. The original table image is below.
View original table image
Apple production to export share in Afghanistan
Afghanistan's share of apple production in export quantity, Table 3 presents the obtained results of the study. That the production of apples in Afghanistan during 2007 was 54,769 tonnes and the quantity exported was about 5,320 tonnes which accounted for 9.71 percent of production exported from Afghanistan. Between 2017 and 2019, production increased from 1,70,442 tonnes up to 2,50,324 tonnes, but the percentage of exports decreased from 9.34 to 9.33 percent. Apple production to export share in Afghanistan Table 4. It was discovered that global apple exports increased in quantity from 55.85 million tonnes in 2012 to 63.88 million tonnes in 2020. Similarly, in Afghanistan, the export of apples increased from 3,509 tonnes in 2012 to 15,331 tonnes in 2020. Apple exports have decreased in value from US$ 1.18 million in 2012 to US$ 0.83 million in 2020. The CAGR of Afghanistan apples revealed a growth of 25.34 and 12.89 percent respectively, in quantity as well as in value terms for the period from 2012 to 2020. Between 2012 and 2020, the percentage share of Afghan apple exports to global markets ranges from almost non-existent to 0.02 percent. The result in Table 6 of the RCA and RSCA reveals that Afghanistan is competitive in the world market in terms of apple exports. Since the calculated values of RCA and RSCA for the year under study were greater than one and greater than zero, respectively.
| Year | RCA of Apple | RSCA of Apple |
|---|---|---|
| 2012 | 7.44 | 0.76 |
| 2013 | 14.73 | 0.87 |
| 2014 | 6.47 | 0.73 |
| 2015 | 9.70 | 0.81 |
| 2016 | 56.39 | 0.97 |
| 2017 | 26.35 | 0.93 |
| 2018 | 27.46 | 0.93 |
| 2019 | 30.51 | 0.94 |
Table text extracted from the original PDF; superscript letters are shown inline. The original table image is below.
View original table image
| Year | World export | — | Afghanistan’s export | — | Afghanistan shares in the world apple export | — |
|---|---|---|---|---|---|---|
| Quantity (mt) | Value (million US$) | Quantity (t) | Value (million US$) | % Quantity | % Value | |
| 2012 | 55.85 | 7,232.79 | 3,509 | 1.18 | 0.0063 | 0.0164 |
| 2013 | 60.36 | 8,212.44 | 8,169 | 3.00 | 0.0146 | 0.0366 |
| 2014 | 61.07 | 7,770.542 | 3,569 | 1.53 | 0.0064 | 0.0197 |
| 2015 | 60.34 | 7,458.60 | 5,234 | 2.54 | 0.0094 | 0.0341 |
| 2016 | 63.91 | 7,356.56 | 22,923 | 15.66 | 0.0410 | 0.2129 |
| 2017 | 65.50 | 7,745.75 | 15,920 | 9.74 | 0.0285 | 0.1258 |
| 2018 | 57.49 | 7,761.55 | 19,317 | 9.73 | 0.0346 | 0.1254 |
| 2019 | 67.71 | 7,154.68 | 23,475 | 10.14 | 0.0420 | 0.1418 |
| 2020 | 63.88 | 6,750.06 | 15,331 | 0.83 | 0.0274 | 0.0123 |
| CAGR | 1.41 | -1.08 | 25.34 | 12.89 | - | - |
Table text extracted from the original PDF; superscript letters are shown inline. The original table image is below.
View original table image
| Year | Production (t) | Export (t) | Export share in production of apple (%) |
|---|---|---|---|
| 2007 | 54,769 | 5,320 | 9.71 |
| 2008 | 77,000 | 7,715 | 10.01 |
| 2009 | 72,676 | 9,366 | 12.88 |
| 2010 | 59,850 | 6,125 | 10.23 |
| 2011 | 62,041 | 5,635 | 9.08 |
| 2012 | 69,994 | 3,509 | 5.01 |
| 2013 | 78,593 | 8,169 | 10.30 |
| 2014 | 95,427 | 3,569 | 3.74 |
| 2015 | 89,733 | 5,234 | 5.83 |
| 2016 | 1,40,903 | 22,923 | 16.2 |
| 2017 | 1,70,442 | 15,920 | 9.34 |
| 2018 | 2,13,592 | 19,317 | 9.04 |
| 2019 | 2,50,324 | 23,475 | 9.33 |
Table text extracted from the original PDF; superscript letters are shown inline. The original table image is below.
View original table image
Figures and tables from the paper
| Year | Pakistan | — | India | — | Others | — |
|---|---|---|---|---|---|---|
| Quantity (t) | Value (Million US$) | Quantity (t) | Value (US$) | Quantity (t) | Value (US$) | |
| 2008 | 7,538.33 | 2.80 (97.71) | 154.30 | 57,322.67 (2.00) | 22.37 | 8,311.79 (0.29) |
| 2009 | 8,991.36 | 3.17 (96.00) | 280.98 | 99,068.53 (3.00) | 93.66 | 33,022.84 (1.00) |
| 2010 | 5,818.75 | 0.81 (95.00) | 214.38 | 30,094.40 (3.50) | 91.88 | 12,897.60 (1.50) |
| 2011 | 5,465.95 | 1.29 (97.00) | 112.70 | 26,667.50 (2.00) | 56.35 | 13,333.75 (1.00) |
| 2012 | 3,308.99 | 1.11 (94.30) | 122.82 | 41,434.32 (3.50) | 77.20 | 26,044.43 (2.20) |
| 2013 | 7,678.86 | 2.82 (94.00) | 375.77 | 1,38,147.63 (4.60) | 114.37 | 42,044.93 (1.40) |
| 2014 | 3,401.26 | 1.46 (95.30) | 107.07 | 45,982.75 (3.00) | 60.67 | 26,056.89 (1.70) |
| 2015 | 4,888.56 | 2.37 (93.40) | 209.36 | 1,01,685.43 (4.00) | 136.08 | 66,095.53 (2.60) |
| 2016 | 21,570.54 | 14.74 (94.1) | 916.92 | 6,26,561.71 (4.00) | 435.54 | 2,97,616.81 (1.90) |
| 2017 | 14,328.00 | 8.77 (90.00) | 811.92 | 4,96,987.55 (5.10) | 780.08 | 4,77,497.84 (4.90) |
| 2018 | 17,655.74 | 8.89 (91.40) | 1,197.65 | 6,03,408.33 (6.20) | 463.61 | 2,33,577.42 (2.40) |
| 2019 | 20,258.93 | 8.75 (86.30) | 1,643.25 | 7,10,053.42 (7.00) | 1,572.83 | 6,79,622.56 (6.70) |
| 2020 | 13,031.35 | 0.70 (85.00) | 1,379.79 | 74,806.03 (9.00) | 919.86 | 49,870.69 (6.00) |
Table text extracted from the original PDF; superscript letters are shown inline. The original table image is below.
View original table image
| Countries | Pakistan | India | Others |
|---|---|---|---|
| Pakistan | 0.98658 | 0.00871 | 0.0047 |
| India | 0 | 0.87992 | 0.12008 |
| Others | 0 | 0.31174 | 0.68826 |
Table text extracted from the original PDF; superscript letters are shown inline. The original table image is below.
View original table image
References
5 in the original paper- Abdullah Y. Horticulture in Afghanistan: Challenges and opportunities. J Dev Sustainable Agric. 2016;11:36-42.
- Bhat MS, Lone FA, Shafiq M, Rather, Javaid A. Evaluation of long-term trends in apple cultivation and its productivity in Jammu and Kashmir from 1975 to 2015. Gio J. 2021;86:1193-1202.
- Kusuma DK, Basavaraja H. Stability analysis of mango export markets of India: Markov Chain approach. Karnataka J Agric Sci. 2014;1:36-39.
- Mustafa N. Consumers apple consumption preferences in Afghanistan. 2017;3:299-304.
- Mohammad S, Padma R, Anjugam M. Economic analysis of apple production in Kabul province, Afghanistan. Int J Agric Sci Res. 2020;10(4):47-54.
Cited by 2
From OpenAlex, OpenCitations and reference lists read by Scinovex
- Assessment of the vulnerability of orchard farmers to climate change in the central highlands of Afghanistan ↗
Lutfullah Safi · Theoretical and Applied Climatology · 2025
Agriculture is the backbone of Afghanistan’s economy, benefiting from a unique climate well-suited for the cultivation of temperate fruits. However, the agriculture and horticulture sub-sector is highly vulnerable to climate change, which adversely affects agroecosystems, food production, and livelihoods. Therefore, the present study was undertaken to assess horticultural crop growers’ vulnerability to climate change using a mixed quantitative and qualitative…
❝ 4PDF - Growth and Instability in Area, Production, and Productivity of Apple in Afghanistan ↗
Sebghatullah Samim, Mohammad Ismail Hashime · Afghan International Journal of Science · 2026
This study addresses the lack of empirical evidence on the growth, instability, and export performance of apple production in Afghanistan by examining changes in area, production, and productivity from 2011 to 2023, with a focus on the major apple-producing provinces. The objective was to estimate growth rates, assess instability, and analyze export trends. The study used secondary data from NSIA…
❝ 0PDF