
Research article · 2024 · Full text
International Journal of Agriculture Extension and Social DevelopmentCharacterization of commercial fish landings of Chandragiri estuary, Kerala, India
Volume 7(3S) · Pages 146–152 · DOI: 10.33545/26180723.2024.v7.i3sb.414 ↗
Research areasFisheries and Aquaculture StudiesFish Biology and Ecology Studies
Abstract
Author-writtenBetween January 2020 and December 2021, the average exploited fisheries resources in the Chandragiri estuary was 87.98t. Finfish accounted for 67.3% of total landings, followed by molluscs (19.5%), and crustaceans (13.2%). The exploited fishery included 97 finfish species from 38 families, 7 penaeid shrimp species, 1 palaemonid prawn species, 6 crab species, and 6 bivalve species. Gelonia bengalensi ( 16.685 t), Lutjanus argentimaculatus (4.435 t), Etroplus suratensis(4.256 t), Acanthopagrus berda (3.841 t), Epinephelus coioides (3.221t), Sillago sihama (2.751 t), Portunus pelagicus (2.739 t), Gerres filamentosus (2.478 t), Caranx heberi (2.428 t) and Lates calcarifer formed the bulk of landings accounted for 52% of the total catch. The highest landings were recorded in January (8.988 t), December (8.151t), and March (8.151t). June had the lowest production (6.067 t), followed by July (6.244 t) and August (6.264 t). The seasonal mean fish catch was highest during the post-monsoon (35.60%), followed by the pre-monsoon (35.43%), and the lowest during the monsoon (28.97%). Finfish landings were highest during the monsoon season (21.385 t), followed by the post-monsoon season (20.394 t), and the lowest during the pre-monsoon season (17.433 t). In the case of shellfish, the pre-monsoon period had the highest landings (13.737 t), followed by the post-monsoon period (10.922 t), and the monsoon season had the lowest landings (4.108 t). From monsoon to post-monsoon, fish productivity in the estuary increased steadily, with the bulk of species supporting lucrative fisheries in the estuary peaking during high-saline months.
Summary
Source-checkedPlain-language reading of the full paper, prepared with AI and checked against the text. Each point links to the authors' own words.
Why it matters
- Estuaries in tropical coastal ecosystems are critical nursery sites for fish and invertebrates because their abundant food sources support larval development and juvenile growth. View evidence ↗
- Fisheries in estuaries provide essential biological and economic benefits, specifically offering food and employment to local populations. View evidence ↗
- Estuarine habitats are currently facing rapid degradation and significant stress caused by fishing operations. View evidence ↗
The question
- The study aimed to quantify the fishery resources of the Chandragiri estuary in Kerala to help develop a management plan for the system. View evidence ↗
What they did
- Fishery catch estimations were collected every two weeks from local fishermen at the Chandragiri estuary between January 2020 and December 2021. View evidence ↗
- Researchers recorded the total weight of all landed individuals, sorted them into finfish and shellfish, and identified them to the species level using standard references. View evidence ↗
What they found
- The average annual exploited fishery resource in the Chandragiri estuary was 87.98 t from January 2020 to December 2021. View evidence ↗
- Finfish were the primary component of landings at 67.3%, followed by molluscs at 19.5% and crustaceans at 13.2%. View evidence ↗
- The fishery resources consisted of 97 finfish species (38 families), 7 penaeid shrimp species, 1 palaemonid prawn species, 6 crab species, and 6 bivalve species. View evidence ↗
- Monthly production peaked in January (8.988 t) and was lowest in June (6.067 t). View evidence ↗
- Seasonal mean landings were highest during the post-monsoon (31.316 t; 35.60%) and lowest during the monsoon (25.493 t; 28.97%). View evidence ↗
- Finfish landings peaked during the monsoon (21.385 t) and were lowest during the pre-monsoon (17.433 t). View evidence ↗
- Shellfish landings were highest during the pre-monsoon (13.737 t) and lowest during the monsoon (4.108 t). View evidence ↗
What it means
- The authors conclude that the Chandragiri estuary has lower landings compared to other Kerala estuaries, which may be due to its size and increased nutrient loading. View evidence ↗
- The authors state that understanding these landing dynamics is essential for the sustainable management of fisheries in estuarine ecosystems. View evidence ↗
Visual summary
1 visualsIllustrations explain the paper; they do not show study data.
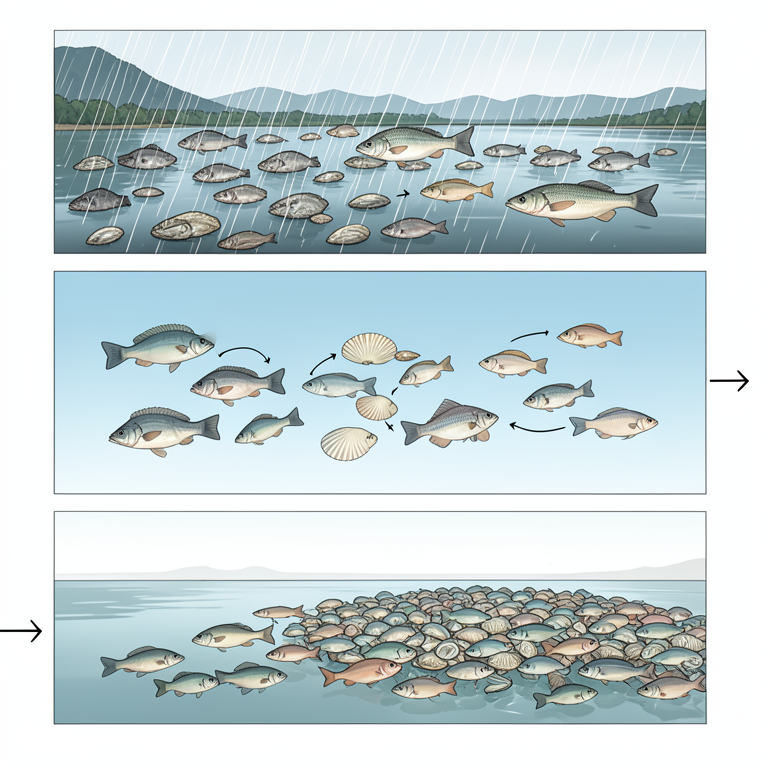
Seasonal Landing Dynamics
AI-generated conceptual illustration (commercial fish and shellfish landings in an estuary). It explains the idea and does not show study data.
View source evidence ↗Figures & tables
From the original paper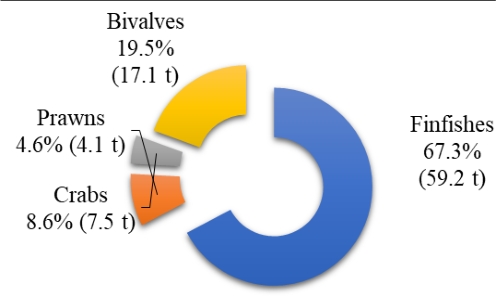 Figure 1
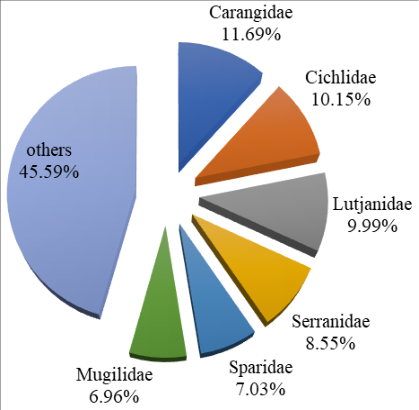 Figure 2
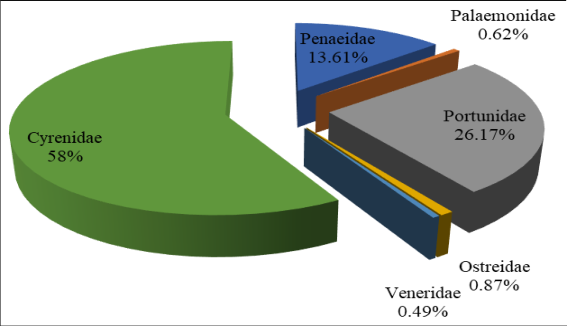 Figure 3
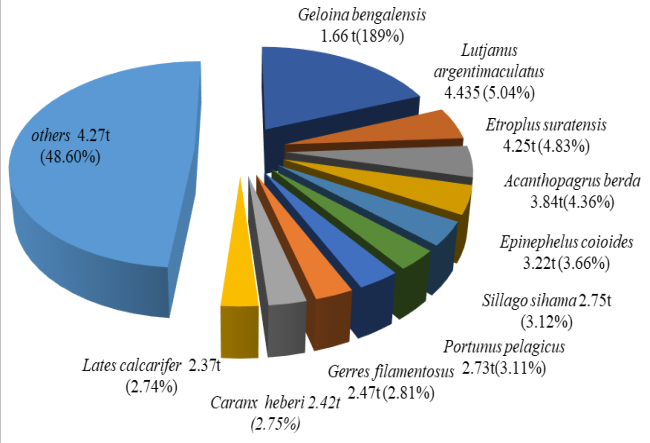 Figure 4
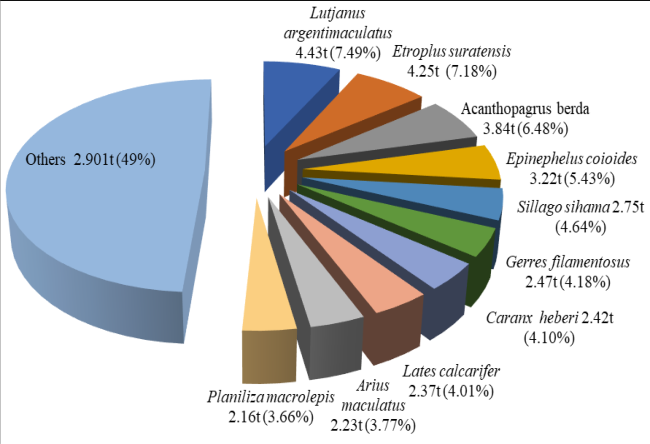 Figure 5
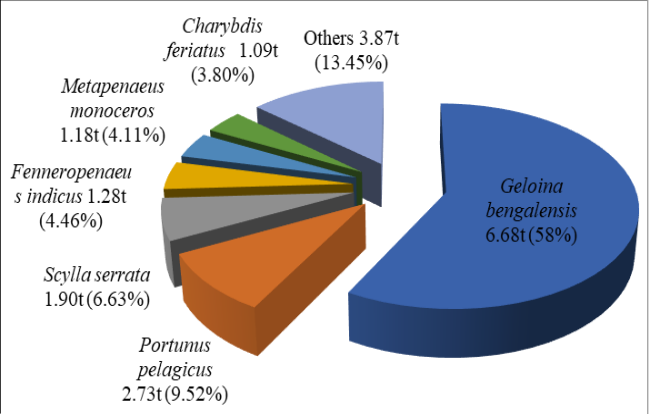 Figure 6
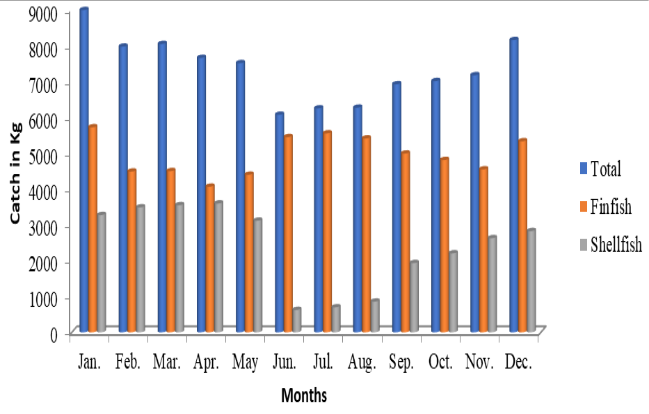 Figure 7
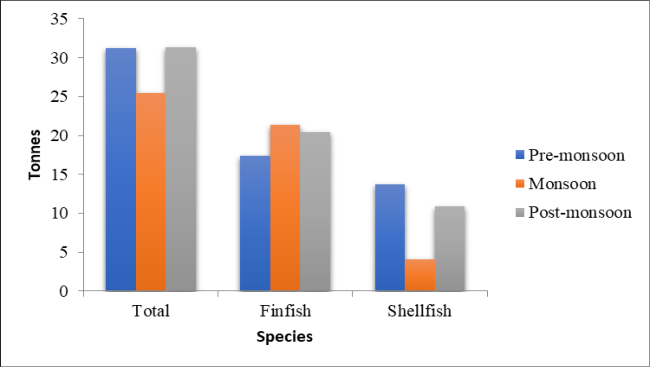 Figure 8
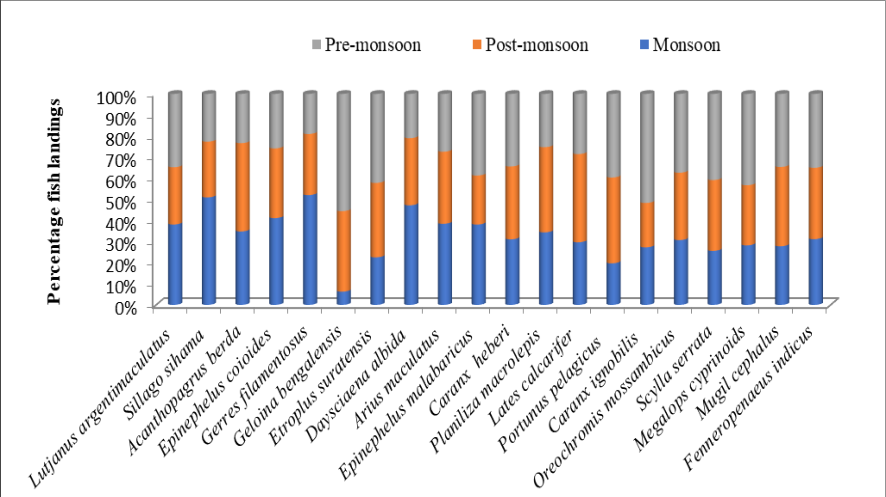 Figure 9
Introduction
In tropical coastal ecosystems, estuaries play an important role in supporting a wide variety of aquatic life such as fish and crustaceans. Estuaries are considered nursery sites for many invertebrate and fish species (Barletta et al., 2003) [3] because the abundance of food in coastal lagoons promotes larval development and juvenile fish growth. These species congregate in this zone for reproduction, feeding, and shelter. Most of the world's fish-landed species spend at least part of their lives in estuarine waters (Pauly, 1988; Pauly and Yanez-Arancibia, 1994; Barletta et al., 1998) [13,2,14] . Their nutrient richness often improves yields and promotes good catches. Estuarine fisheries are a valuable resource with significant economic and biological benefits for many people by providing food and employment. The average yield of estuarine fish production in India was estimated to vary from 45 to 75 kg ha -1 (Sugunan, 2010) [17] . The fish and fisheries play an important role in the Kerala economy, especially among the communities near the coast. Kerala's backwaters provide habitat for more than 200 resident and migratory species of fish and shellfish, and fishing in these water bodies provides livelihoods for approximately 200,000 fishermen and full-time employment for more than 50,000 fishers (Bijoy Nandan, 2008) [4] . Estuary ecosystems are under significant stress as a result of fishing operations and many estuarine habitats are being rapidly degraded. Understanding the structure and dynamics of multispecies fisheries is necessary for predicting the ecological and fishery implications of exploitation tactics, as well as preventing undesirable changes in the particular composition (Brander, 1988; Sainsbury, 1982) [5,15] . As a result, any new information about seasonal changes in fish composition and quantity, as well as the effects of environmental variables on the fishery, is critical not just for fishery managers but also for fishermen who want to engage in sustainable fishing. The current study attempted to quantify the fishery resources of Chandragiri estuary, Kasaragod district, Kerala to propose a management plan for the estuarine system.
Methodology
Estimation of fishery catch has been made fortnightly from fishermen who fished around Chandragiri estuary from January 2020 to December 2021. The total catches were sorted into finfish and shellfish. The total weight of all landed individuals was recorded. Landed species were identified up to species level with the help of standard references (Day, 1889; Talwar and Jhingran, 1991; Jayaram, 1999; Munro, 2000; Froese and Pauly, 2022) [6,8,18,10,12] .
Results
Between January 2020 and December 2021, the estuary's average annual exploited fishery was estimated to be 87.98t. Finfish accounted for 67.3% of the total landings, followed by molluscan (19.5%) and crustacean (13.2%) (Fig. 1). Major exploited fishery resources of estuary comprised 97 www.extensionjournal.com finfish species from 38 families, 7 species of penaeid shrimps, 1 species of palaemonid prawns, 6 species of crabs and 6 species of bivalves.
Fig 1: Groupwise percentage contribution to fish landings
The dominant fish family was Carangidae, which had nine species, followed by Sciaenidae, which had seven species, and the other fish families were Engraulididae, Mugilidae, and Lutjanidae, each with six species. The fish families Gerreidae, Serranidae, and Ariidae each had four species. Dasyatidae, Siganidae, Cichlidae, Clupidae, Haemulidae, and Cynoglossidae each had three species. Belonidae, Hemiramphidae, Terapontidae, Platycephalidae, Sillaginidae, Sparidae, Sphyraenidae, Soleidae and Bagridae had two species each while the remaining fish families in the study had one species each. In shellfish most dominant family was penaeidae, which had seven species followed by portunidae had six species, veneridae, cyrenidae and osteridae each had two species. Palaemonidae consisted of only one species. The predominant groups in the exploited finfishes during the two years were Carangidae, Cichlidae, Lutjanidae, Serranidae, Sparidae, and Mugilidae. 3). Gerres filamentosus (2.478 t), Caranx heberi (2.428 t) and Lates calcarifer (2.379 t)) together accounted for 52% of the total landings. The remaining 77 species made up the remaining 48% (Fig. 4).
Fig 4: Major species landings in Chandragiri estuary
Lutjanus argentimaculatus (7.49%) had the highest biomass of finfish, followed by Etroplus suratensis (7.18%), Acanthopagrus berda (6.48%), Epinephelus coioides (5.43%), Sillago sihama (4.64%), Gerres filamentosus (4.18%), Caranx heberi (4.1%), Lates calcarifer (4.01%), Arius maculates (3.77%), Planiliza macrolepis (3.66%) and others contributed 49% of the total fish biomass (Fig. 5). In shellfish, Geloina bengalensis (58%) had highest biomass, followed by Portunus pelagicus (9.53%), Scylla serrata (6.63%), Fenneropenaeus indicus (4.46%), Metapenaeus monoceros (4.11%) and Charybdis feriatus (3.80%) in which if combined, comprised 86.54% of the total landings and other contributed 13.45% of the total shellfish biomass (Fig. 6).
The month wise overall production from the estuary is given in Fig. 7. Highest landings were recorded during January (8.988 t) followed by December (8.151 t) and March (8.042%). The lowest production was recorded in June (6.067 t) followed by July (6.244 t) and August (6.264 t). Highest finfish catch was recorded in the month of January (5.718 t) followed by July (5.548 t) June (5.444 t) and August (5.407). April had the lowest catch (4.060 t), followed by May (4.394 t) and February (4.483 t). The highest catch of shellfish was recorded in April (3.593 t) followed by March (3.546 t) and February (3.485 t). The month of June had the lowest production (0.623 t), followed by July (0.696 t) and August (0.857 t). Seasonal mean fish landings were highest during postmonsoon 31.316 t (35.60%), followed by pre-monsoon 31.170 t (35.43%) and the lowest production was observed during monsoon 25.493t (28.97 %,). Finfish landings were more during the monsoon at about 21.385 t followed by post-monsoon 20.394 t and the lowest catch was recorded during pre-monsoon at 17.433 t. In the case of shellfish, the highest landing was seen during pre-monsoon (13.737 t) followed by post-monsoon (10.922 t) and the lowest landing was recorded during monsoon (4.108 t) (Fig. 8). Portunus pelagicus (0.540 t) and Scylla serrata(0.489 t). Fenneropenaeus indicus (0.400 t) and Metapenaeus monoceros (0.279 t). Geloina bengalensis (1.050 t) and Magallana bilineata (0.086 t). During post-monsoon Acanthopagrus berda (1.608 t), Etroplus suratensis (1.498 t) and Lutjanus argentimaculatus (1.203 t). Fenneropenaeus indicus (0.435 t) and Metapenaeus monoceros (1.114 t). Portunus pelagicus (0.540 t) and Scylla serrata (0.640 t). Geloina bengalensis (6.36t) and Magallana bilineata (0.108 t) were dominant catches during post-monsoon (Fig. 9).
Fig 9: Seasonal percentage contribution of major species landings
Fig 9: Seasonal percentage contribution of major species landings
Discussion
In the present study, the annual landings of finfish and shellfish were 87.98 t. The current study was compared to previous studies. According to Harkrishnan et al., 2011 from the Azhikode Estuary, 369 t (2005-2006) and 424.8 t (2006-2007) were recorded. Sugunan (2010) [17] reported 14000-17000 t in Vembanad Lake and other Kerala backwaters. The study found lesser fish landings than the Kerala estuaries and backwaters, possibly due to the area of the estuary, increased nutrient loading. Both fisheries exploitation and increased nutrient loading have a major impact on finfish and shellfish abundance and output in estuaries. The exploited fishery in Chandragiri estuary was represented by 117 species belonging to 44 families in that 97 species of fishes, 7 species of penaeid shrimps, 1 species of palaemonid prawns, 6 species of crabs and 6 species of bivalves. The finfish contributed 67.3% to the total fishery followed by molluscs (19.5%) and crustaceans (13.2%). Sanu et al. (2010) [19] found 25 fish species, 6 prawn species, and 1 crab species in the Kodungallur-Azhikode estuary. According to Harikrishnan et al. (2011) [9] , the Azhikode estuary's fisheries resources included 30 finfish species from 18 families, 6 species of penaeid shrimp, 2 species of palaemonid prawns, 2 species of crabs, and 4 species of bivalves. Fishery resources from Vembanad lake comprised of 80 species of finfishes, 5 species of penaeid shrimps, 3 species of palaemonid prawns and 2 species of crabs with the dominance of finfishes contributing 26.7% (1192.17 t) to the total fishery (Asha et al., 2014) [1] . Changes in sampling methodology and effort, as well as differences in geomorphology and geography of estuaries, could cause a variation in the number of fish species and families. During the study, the top finfish family was Carangidae, followed by Cichlidae and Lutjanidae, and the dominant shellfish family was Cyrenidae, Portunidae, and Penaeidae. The majority of Carangids found in the estuary are mostly piscivorous, feeding on the most frequent fish of a suitable size that is available in the area. On the other hand, their affinity for coastal ecosystems and estuaries contributed to their large collective weight. These explanations may not apply to the Family Cichlidae and Lutjanidae species found in the estuary. Cyrenidae, Portunidae, and Penaeidae production are generally higher near estuaries, which may be due to increased food availability, resulting in their high collective weight. Gelonia bengalensis, Lutjanus argentimaculatus, Etroplus suratensis, Acanthopagrus berda, Epinephelus coioides and Sillago sihama had high landings throughout the study period. This is because of the euryhaline and eurythermic characteristics. The monthwise overall production showed that the highest landings were recorded in January (8.988 t) but least in June (6.067 t). The highest finfish catch were recorded in January www.extensionjournal.com (5.718 t) and the least in April (4.060 t). In crustaceans, the highest landings were recorded in the month of April (3.593 t) and lowest in June (0.623 t). In both years, the highest landings were during post-monsoon 31.316 t (35.60%), followed by pre-monsoon 31.170 t (35.43%) and the lowest production was observed during monsoon 25.493 t (28.97%). Seasonal mean fish catch in Kodungallur-Azhikode estuary was highest during pre-monsoon (397.9 t) followed by post-monsoon (311.5 t) and south-west monsoon period (199.2 t) (Bijoy Nandan et al., 2012) [4] . In general, gillnets and cast nets catch more fish during the pre-monsoon and post-monsoon seasons. This could be due to the low water level and high plankton production. Plankton production increases significantly during the postmonsoon season as a result of the massive amount of nutrients brought in by rainwater reaching the estuary from the surrounding areas, as well as mixing activities. high availability of plankton as food leads to a high rate of growth and breeding activity, resulting in an increased fish population. Food availability and abundance are two important factors that influence the abundance and CPUE of fish whereas Competition and predation are also important limiting factors (McConnell and Lowe-Mc Connel, 1987) [11] . Finfish landings were highest during the monsoon season, followed by the post-monsoon season, while the lowest catch was recorded during the pre-monsoon. Some fishes were attracted to the estuary during the monsoon due to physiological/behavioural attraction to river discharge and precipitation as a result of a preference for lower salinity for part or all of their life cycle (Day et al., 1989) [7] . In the case of shellfish, the maximum landings occurred during the premonsoon period, followed by the post-monsoon period, and the lowest landings occurred during the monsoon period. Due to strong river discharge, fishermen are unable to collect crustaceans during the monsoon, resulting in a lesser catch.
Acknowledgement
Acknowledgements
Figures and tables from the paper
References
14 in the original paper- Asha CV, Suson PS, Retina CI, Nandan SB. Decline in diversity and production of exploited fishery resources in Vembanad wetland system: strategies for better management and conservation. Open J Mar. Sci. 2014;4(04):344.
- Barletta M, Barletta-Bergan A, Saint-Paul U. Mangrove-Dominated Region of Bragança (State of Para, North Brazil). Ecotropica. 1998;4:41-53.
- Barletta M, Barletta-Bergan A, Saint-Paul U, Hubold G. Seasonal changes in density, biomass, and diversity of estuarine fishes in tidal mangrove creeks of the lower Caeté Estuary (northern Brazilian coast, east Amazon). Mar Ecol Prog Ser. 2003;256:217-28.
- Brander K. Multispecies fisheries of the Irish Sea. Fish population dynamics. 1988:303-28.
- Day F. Fauna of British India, including Ceylon and Burma. Fishes. 1889;1(2):1-548.
- Day J, Hall, CAS, Kemp WM, Yanez-Arancibia A. Estuarine ecology. John Wiley and Sons, New York; 1989, 588.
- Froese R, Pauly D. FishBase. World Wide Web electronic publication. www.fishbase.org., version (02/2022).
- Harikrishnan M, Vipin PM, Kurup BM. Status of exploited fishery resources of Azhikode Estuary, Kerala, India. 2011;48(1):19-24.
- Jayaram KC. The freshwater fishes of the Indian region. 1999, 551.
- McConnell R, Lowe-McConnell RH. Ecological studies in tropical fish communities. Cambridge University Press; 1987.
- Munro ISR. The marine and fresh water fishes of Ceylon. Biotech Books, Delhi; 2000, 349pp.
- Pauly D. Fisheries research and the demersal fisheries of Southeast Asia. Fish Population Dynamics: the Implications for Management. 1988;330-348.
- Pauly D, Yanez-Arancibia A. Fisheries in Coastal Lagoons in Coastal Lagoon Processes Amsterdam, The Netherlands. Kjerfve, B. (Eds.). Elsevier. 1994;377399.
- Sainsbury KJ. The ecological basis of tropical fisheries management. In: Theory and management of tropical fisheries. ICLARM Conference Proceedings. 1982;167194.