
Research article · 2024 · Full text
International Journal of Advanced Biochemistry ResearchIndia’s growth in agricultural mechanization during last decades
Volume 8(3S) · Pages 178–181 · DOI: 10.33545/26174693.2024.v8.i3sc.715 ↗
Research areasAgricultural Economics and PracticesAgricultural risk and resilience
Abstract
Author-writtenFarm mechanization is a crucial component of contemporary agriculture. In addition to lowering cultivation costs and human labor, it increases production. Mechanization enhances the quality and value addition of the crop while also increasing worker safety and comfort and the efficiency with which other inputs are used in agriculture. Improved machinery not only allows farmers to cultivate a second crop but also increases productivity and production. The role of farm mechanization has shifted in improving agricultural production as well as productivity through time-saving of field operation and by enabling proper utilization of critical inputs. Utilizing appropriate farm machines for field preparation can save time and energy and enables the farmers to sow the crops in time and thus obtain higher yields. Farm mechanization also improves quality of life by reducing drudgery and by providing respectability to farm operators. The annual share of power availability per ha 2020-21 was 2.761 kW. During the year 2020-21, it increased by 47.03 percent as compared to 2011-12 (262.921 million kW) of a source of power accessibility in India. During the year 2022-23, in India, sales of power tillers and tractors were recorded at 35,000 and 835,000, respectively.
Summary
Source-checkedPlain-language reading of the full paper, prepared with AI and checked against the text. Each point links to the authors' own words.
Why it matters
- Farm mechanization is essential for modern agriculture because it increases production while reducing human labor and cultivation costs. View evidence ↗
- Combining farm mechanization with improved agricultural inputs can lead to yield increases of 10% to 15%. View evidence ↗
- Estimates suggest that using the correct equipment can reduce cultivation costs by about 20% and increase output by up to 30%. View evidence ↗
The question
- The study aims to examine the growth and trends of agricultural mechanization in India over recent decades. View evidence ↗
What they did
- The study collected data from various Agriculture Departments and affiliated bodies across India, focusing on major agricultural production areas. View evidence ↗
What they found
- In 2020-21, the power availability per hectare in India was 2.761 kW. View evidence ↗
- Total power accessibility in India increased by 47.03% in 2020-21 compared to the 262.921 million kW available in 2011-12. View evidence ↗
- During 2022-23, India recorded sales of 835,000 tractors and 35,000 power tillers. View evidence ↗
- Tractor sales grew by 81.49%, rising from 535,000 in 2011-12 to 971,000 in 2021-22. View evidence ↗
- Power tiller sales saw a slight decrease of 1%, falling from 60,000 in 2011-12 to 54,000 in 2021-22. View evidence ↗
- In 2022-23, the highest tractor sales occurred in Uttar Pradesh (99,968), Madhya Pradesh (96,853), and Maharashtra (85,845). View evidence ↗
- There is a trend of increasing power from mechanical sources (tractors, tillers, engines, motors) and a decrease in power derived from humans and animals. View evidence ↗
What it means
- The authors conclude that India has seen a significant increase in the use of mechanical power sources, such as tractors and power tillers, over the last ten years. View evidence ↗
Visual summary
3 visualsIllustrations explain the paper; charts are replotted from the paper's own table values.
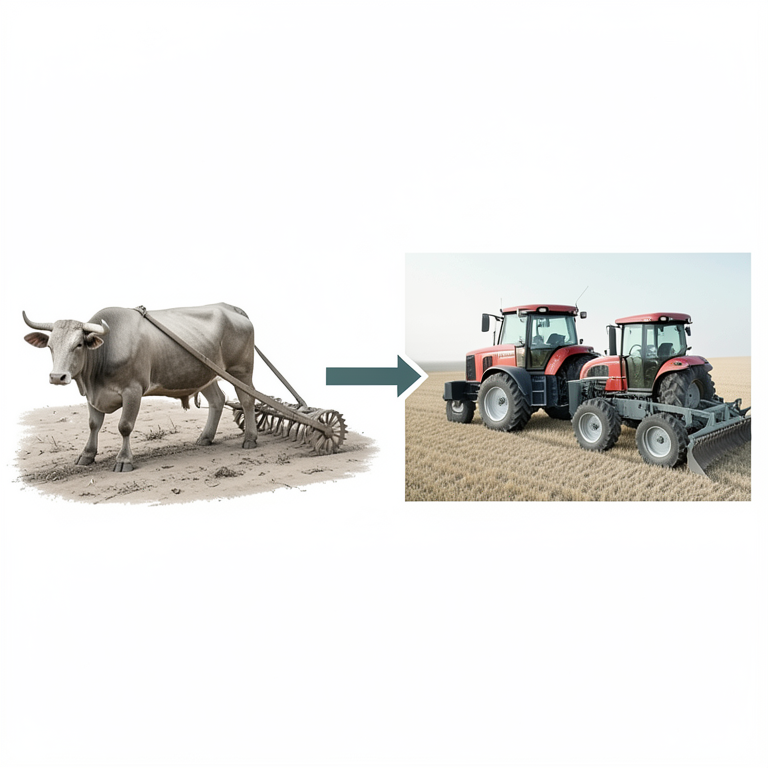
Shift in Farm Power Sources
AI-generated conceptual illustration (Indian farmland with draft oxen and modern tractors). It explains the idea and does not show study data.
View source evidence ↗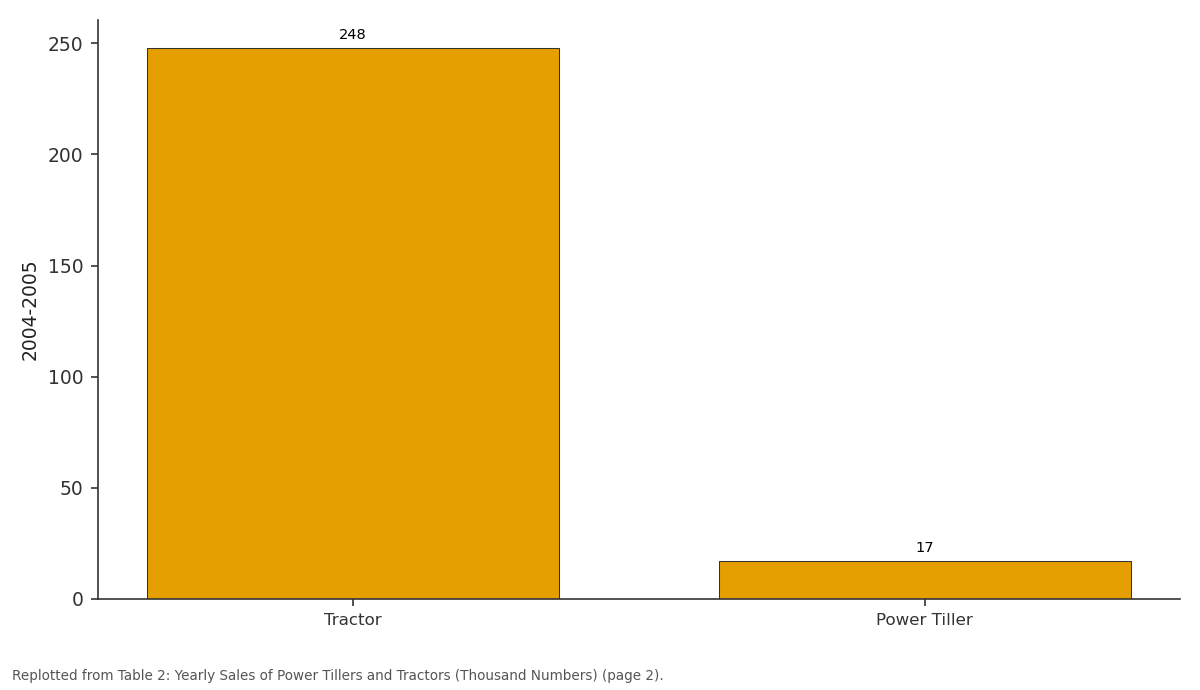
2004-2005: Tractor vs Power Tiller
Replotted from Table 2 (page 2) of the original paper. Every bar is the paper's own table value.
View source evidence ↗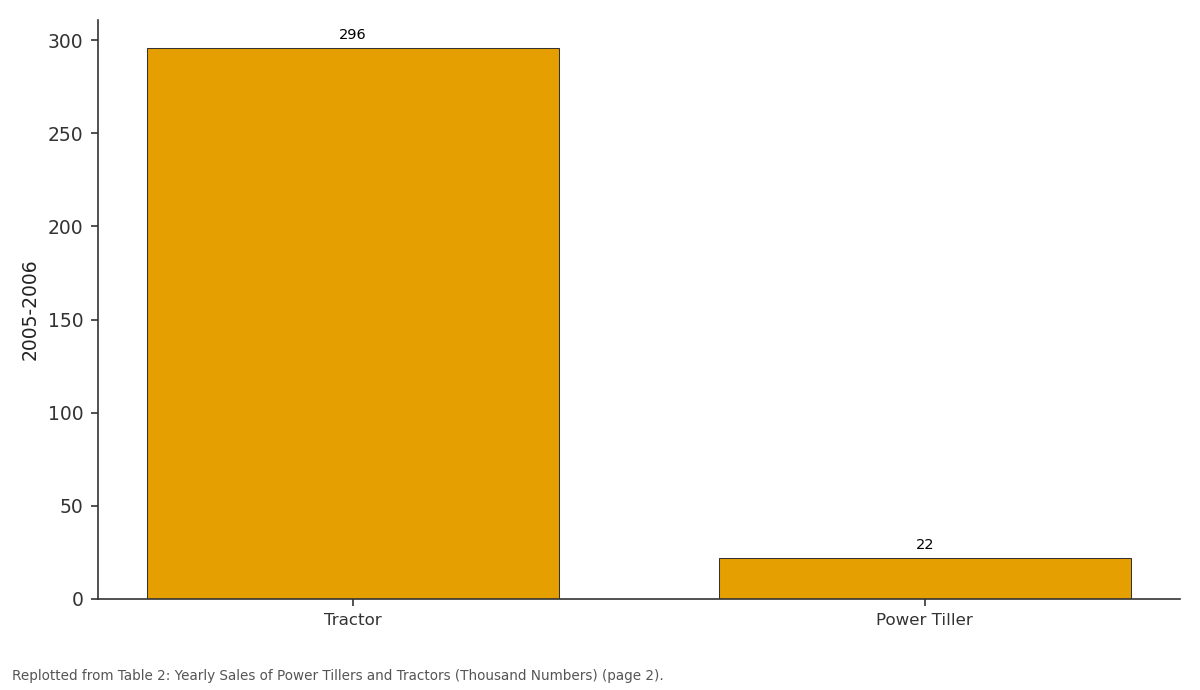
2005-2006: Tractor vs Power Tiller
Replotted from Table 2 (page 2) of the original paper. Every bar is the paper's own table value.
View source evidence ↗Figures & tables
From the original paper Table 1
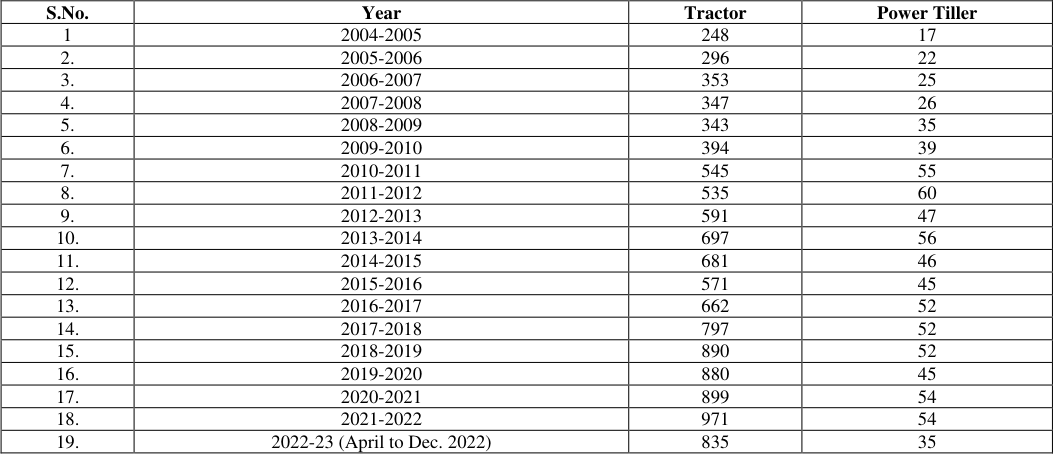 Table 2
 Table 3
 Table 4
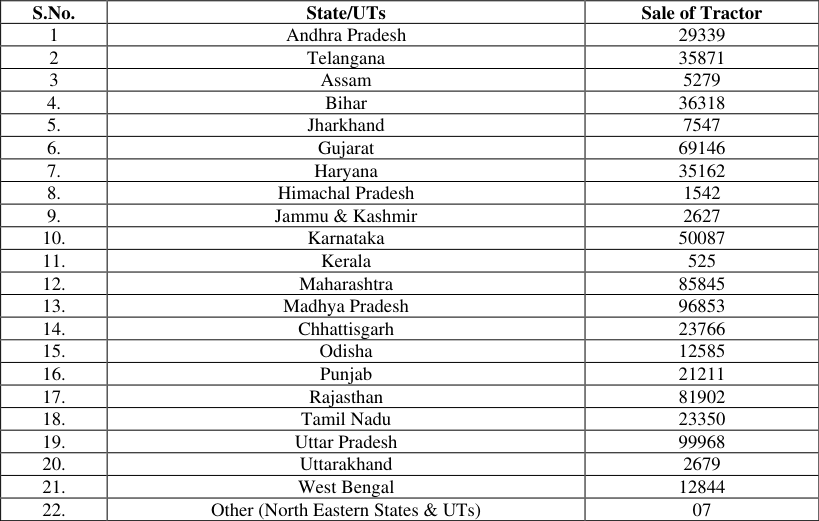 Table 5
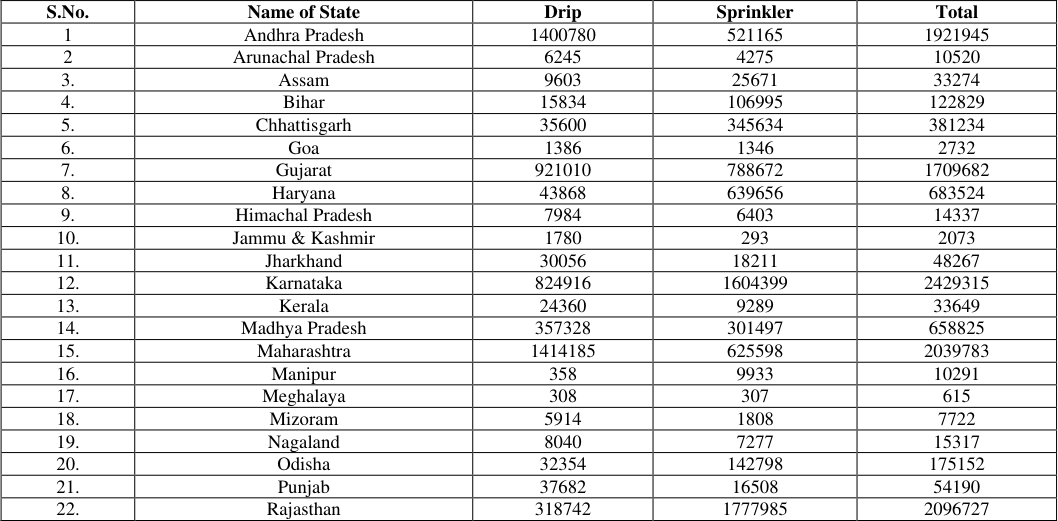 Table 6
Introduction
India is a large agricultural country with a geographic land area of 329 million hectares, of the 329 million hectares in total geographic area of the country. There are 166 million hectares that can be farmed, and in the last thirty years, the net sown area has remained around 141 million ha of which about 65 million ha (46%) is irrigated and remaining 76 million ha (54%) is rain-fed. The entire process of preparing for tillage, planting, weeding, spraying, harvesting, threshing, and post-harvest operations is included in the agriculture field value chain. The utilization of farm equipment and machinery improves the efficiency of man and machine at each stage of the crop production life cycle.
Farm mechanization reduces labor and time expenditures, but it additionally decreases production costs and losses. Mechanization facilitates the most efficient use of available resources (e.g. land, labour and water) and costly inputs for farming (chemicals, fertilizers, and seeds). Efficient use of time, labour, and resources helps facilitate sustainable multi-cropping and timely planting of crops, which can give crops more time to mature leading to an increase in productivity. Additionally, using equipment minimizes drudgery, pollution, and losses.
Improved agricultural inputs combined with farm mechanization have been demonstrated to increase yields by 10% to 15%. According to additional estimates, using appropriate equipment can boost output by up to 30% and minimize cultivation costs by approximately 20%. In terms of importance, agriculture leads the Indian economy. Indian farmers used to mostly depend on both human and animal power.
However, with time came the development of tractors and tractor-driven agricultural tools through government-sponsored initiatives. Over the past ten years, it has been noted that the idea of farm mechanization and its significance have gained traction, leading to the development and commercialization of new farm tools and equipment. In addition to decreasing the drudgery involved in farming operations, this has enhanced productivity and production to feed the world's growing population. Due to the opportunities it provides for operators, mechanics, salespeople, and other professionals, farm mechanization has contributed positively to the growth of employment in rural areas.
IJABR 2024; SP-8(3): 178-181 Dr. Umesh Kumar Dhruw Assistant Professor (FMPE), IGKV, RSV College of Agriculture & Research Station Bemetara, Chhattisgarh, India Er. DK Roy Assistant Professor (FMPE), IGKV, SK College of Agriculture & Research Station Kawardha, Chhattisgarh, India Er. PD Verma Subject Matter Specialist (FMPE), IGKV, Krishi Vigyan Kendra, Bhatapara, Chhattisgarh, India Dr.
Umesh Kumar Dhruw Assistant Professor (FMPE), IGKV, RSV College of Agriculture & Research Station Bemetara, Chhattisgarh, India https://www.biochemjournal.com With the help of a centrally supported program, the use of tractors and other farm machinery and equipment has increased significantly in India, although its distribution has been uneven. According to Singh et al. (2009) [4], the country's total farm power availability was 2.24 kW/ha in 2016–17. Tractors, power tillers, combine harvesters, diesel engines, electric motors, humans, and draught animals accounted for 1.324 kW/ha, 0.018 kW/ha, 0.021 kW/ha, 0.0460 kW/ha, 0.193 kW/ha, 0.091 kW/ha, and 0.130 kW/ha, respectively. Singh (2015) [7] reported that sale of tractors was highest in state of Uttar Pradesh during the year 2000-01 to 2013-14.
During this period, more than 68 percent of the tractor sales in the country were from Uttar Pradesh, Madhya Pradesh, Rajasthan, Maharashtra, Andhra Pradesh, Gujarat and Haryana. Singh (2021) [8] reported that the power availability per ha in the year 2020-21 was 2.761 kW. Of this power availability per ha from the tractor, power tiller, diesel engine, electric motor, animal and human is 1.64 kW, 0.03 kW, 0.39 kW, 0.54 kW, 0.084 kW and 0.080 kW respectively.
Materials And Methods
The present study was conducted in the India and other states which are the major agriculture production areas. The information was gathered from various Agriculture Departments and affiliated departments. Table 1: Available power from different sources during periods in India Year Source of power Availability, million kW Total power million kW Human Animal Tractor Power Tiller Diesel engine Electric motor 2011-12 13.15 16.903 118.8229 1.927 45.987 66.130 262.921 2020-21 11.5 11.694 229.5291 3.951 54.225 75.678 386.576 In the table 1, the Availability of farm power from human, animal, tractor, power tiller, diesel engine and electric motor were 13.15 kW, 16.903 kW, 118.8229 kW, 1.927 kW, 45.987 kW and 66.1330 kW during the year 2011-12. The assessed.
| Year | Source of power Availability, million kW | — | — | — | — | — | Total power million kW |
|---|---|---|---|---|---|---|---|
| Human | Animal | Tractor | Power Tiller | Diesel engine | Electric motor | ||
| 2011-12 | 13.15 | 16.903 | 118.8229 | 1.927 | 45.987 | 66.130 | 262.921 |
| 2020-21 | 11.5 | 11.694 | 229.5291 | 3.951 | 54.225 | 75.678 | 386.576 |
Table text extracted from the original PDF; superscript letters are shown inline. The original table image is below.
View original table image
This may be due to the migration of farm workers to cities for livelihood. In table 3, in year 2020-21, it is increased by 47.03 percent as compared to 2011-12 (262.921 million kW) of a source of power accessibility in India. Availability of farm power from human, animal, tractor, power tiller, diesel engine and electric motor was 11.5 kW, 11.694 kW, 229.5291 kW, 3.951 kW, 54.225 kW and 75.678 kW during the year 2020-21. Table 2: Yearly Sales of Power Tillers and Tractors (Thousand Numbers) S.No.
| S.No. | Year | Tractor | Power Tiller |
|---|---|---|---|
| 1 | 2004-2005 | 248 | 17 |
| 2. | 2005-2006 | 296 | 22 |
| 3. | 2006-2007 | 353 | 25 |
| 4. | 2007-2008 | 347 | 26 |
| 5. | 2008-2009 | 343 | 35 |
| 6. | 2009-2010 | 394 | 39 |
| 7. | 2010-2011 | 545 | 55 |
| 8. | 2011-2012 | 535 | 60 |
| 9. | 2012-2013 | 591 | 47 |
| 10. | 2013-2014 | 697 | 56 |
| 11. | 2014-2015 | 681 | 46 |
| 12. | 2015-2016 | 571 | 45 |
| 13. | 2016-2017 | 662 | 52 |
| 14. | 2017-2018 | 797 | 52 |
| 15. | 2018-2019 | 890 | 52 |
| 16. | 2019-2020 | 880 | 45 |
| 17. | 2020-2021 | 899 | 54 |
| 18. | 2021-2022 | 971 | 54 |
| 19. | 2022-23 (April to Dec. 2022) | 835 | 35 |
Table text extracted from the original PDF; superscript letters are shown inline. The original table image is below.
View original table image
Year Tractor Power Tiller 1 2004-2005 248 17 2. 2005-2006 296 22 3. 2006-2007 353 25 4. 2007-2008 347 26 5. 2008-2009 343 35 6. 2009-2010 394 39 7. 2010-2011 545 55 8. 2011-2012 535 60 9. 2012-2013 591 47 10. 2013-2014 697 56 11. 2014-2015 681 46 12. 2015-2016 571 45 13. 2016-2017 662 52 14. 2017-2018 797 52 15. 2018-2019 890 52 16. 2019-2020 880 45 17. 2020-2021 899 54 18. 2021-2022 971 54 19. 2022-23 (April to Dec. 2022) 835 35 (Source: Department of Agriculture & Farmers Welfare) In table 2, Year-wise sales of tractors and power tillers have continuously increasing during the year 2004-05 to 2022-23. In the table 2, during year 2022-23, the sale of tractors and power tillers was observed 835,000 and 35,000 number in India.
Results And Discussion
Table 3: Power available from different sources during periods in India S. No. Total Power million, kW 2011-12 2020-21 Absolute Change Relative Change % 1 Source of power Availability, million kW 262.921 386.576 123.655 47.03% Table.1 showed the increasing trends in the power available from tractors, power tillers, diesel engines and electric motors while negative trends were observed with human and animal power availability. Power available from human power beings showed increasing trend up to decade of 2011- 12 and during the period 2020-21, a negative trend is https://www.biochemjournal.com Table 4: Sale of Tractor and Power Tiller (Thousand Number) 2021-22 (Thousand Number) Absolute Change Relative Change % S.
| S. No. | Sales of Tractor and Power tiller | 2011-12 (Thousand Number) | 2021-22 (Thousand Number) | Absolute Change | Relative Change % |
|---|---|---|---|---|---|
| 1 | Tractor | 535 | 971 | 436 | 81.49% |
| 2 | Power Tiller | 60 | 54 | -6 | -1% |
Table text extracted from the original PDF; superscript letters are shown inline. The original table image is below.
View original table image
No. Sales of Tractor and Power tiller 2011-12 (Thousand Number) 1 Tractor 535 971 436 81.49% 2 Power Tiller 60 54 -6 -1% In the table 4, during the year 2011-12, the sales of Tractor in India were found to be 535,000. During the year 2021-22, the sales of Tractors in India were found to be 971,000. It is increased by 81.49 percent as compared to 2011-12.
In the table 4, during the 2011-12, the sales of power tillers in India were found to be 60,000. During the year 2021-22, the sales of power tillers in India were found to be 54,000. It is decreased by -1 percent as compared to 2011-12. Table 5: State wise sale of tractors during 2022-23(Number) (April 2022 to December 2022) sales of tractors in different state such as North Eastern & UTs, Kerala and Himachal Pradesh were found to be 07, 525, and 1542.
| S.No. | State/UTs | Sale of Tractor |
|---|---|---|
| 1 | Andhra Pradesh | 29339 |
| 2 | Telangana | 35871 |
| 3 | Assam | 5279 |
| 4. | Bihar | 36318 |
| 5. | Jharkhand | 7547 |
| 6. | Gujarat | 69146 |
| 7. | Haryana | 35162 |
| 8. | Himachal Pradesh | 1542 |
| 9. | Jammu & Kashmir | 2627 |
| 10. | Karnataka | 50087 |
| 11. | Kerala | 525 |
| 12. | Maharashtra | 85845 |
| 13. | Madhya Pradesh | 96853 |
| 14. | Chhattisgarh | 23766 |
| 15. | Odisha | 12585 |
| 16. | Punjab | 21211 |
| 17. | Rajasthan | 81902 |
| 18. | Tamil Nadu | 23350 |
| 19. | Uttar Pradesh | 99968 |
| 20. | Uttarakhand | 2679 |
| 21. | West Bengal | 12844 |
| 22. | Other (North Eastern States & UTs) | 07 |
Table text extracted from the original PDF; superscript letters are shown inline. The original table image is below.
View original table image
S.No. State/UTs Sale of Tractor 1 Andhra Pradesh 29339 2 Telangana 35871 3 Assam 5279 4. Bihar 36318 5. Jharkhand 7547 6.
Gujarat 69146 7. Haryana 35162 8. Himachal Pradesh 1542 9. Jammu & Kashmir 2627 10.
Karnataka 50087 11. Kerala 525 12. Maharashtra 85845 13. Madhya Pradesh 96853 14.
Chhattisgarh 23766 15. Odisha 12585 16. Punjab 21211 17. Rajasthan 81902 18.
Tamil Nadu 23350 19. Uttar Pradesh 99968 20. Uttarakhand 2679 21. West Bengal 12844 22.
Other (North Eastern States & UTs) 07 (Source: Department of Agriculture & Farmers Welfare) In the table 5, during the year 2022-23, the highest sales of Tractors in different states such as Uttar Pradesh, Madhya Pradesh and Maharashtra were found to be 99968, 96853 and 85845. In the table 5, during the 2022-23, the lowest Table 6: State wise Area Covered under Micro-Irrigation (as on 31/03/2022) (Hectares) S.No. Name of State Drip Sprinkler Total 1 Andhra Pradesh 1400780 521165 1921945 2 Arunachal Pradesh 6245 4275 10520 3. Assam 9603 25671 33274 4.
| S.No. | Name of State | Drip | Sprinkler | Total |
|---|---|---|---|---|
| 1 | Andhra Pradesh | 1400780 | 521165 | 1921945 |
| 2 | Arunachal Pradesh | 6245 | 4275 | 10520 |
| 3. | Assam | 9603 | 25671 | 33274 |
| 4. | Bihar | 15834 | 106995 | 122829 |
| 5. | Chhattisgarh | 35600 | 345634 | 381234 |
| 6. | Goa | 1386 | 1346 | 2732 |
| 7. | Gujarat | 921010 | 788672 | 1709682 |
| 8. | Haryana | 43868 | 639656 | 683524 |
| 9. | Himachal Pradesh | 7984 | 6403 | 14337 |
| 10. | Jammu & Kashmir | 1780 | 293 | 2073 |
| 11. | Jharkhand | 30056 | 18211 | 48267 |
| 12. | Karnataka | 824916 | 1604399 | 2429315 |
| 13. | Kerala | 24360 | 9289 | 33649 |
| 14. | Madhya Pradesh | 357328 | 301497 | 658825 |
| 15. | Maharashtra | 1414185 | 625598 | 2039783 |
| 16. | Manipur | 358 | 9933 | 10291 |
| 17. | Meghalaya | 308 | 307 | 615 |
| 18. | Mizoram | 5914 | 1808 | 7722 |
| 19. | Nagaland | 8040 | 7277 | 15317 |
| 20. | Odisha | 32354 | 142798 | 175152 |
| 21. | Punjab | 37682 | 16508 | 54190 |
| 22. | Rajasthan | 318742 | 1777985 | 2096727 |
Table text extracted from the original PDF; superscript letters are shown inline. The original table image is below.
View original table image
Bihar 15834 106995 122829 5. Chhattisgarh 35600 345634 381234 6. Goa 1386 1346 2732 7. Gujarat 921010 788672 1709682 8.
Haryana 43868 639656 683524 9. Himachal Pradesh 7984 6403 14337 10. Jammu & Kashmir 1780 293 2073 11. Jharkhand 30056 18211 48267 12.
Karnataka 824916 1604399 2429315 13. Kerala 24360 9289 33649 14. Madhya Pradesh 357328 301497 658825 15. Maharashtra 1414185 625598 2039783 16.
Manipur 358 9933 10291 17. Meghalaya 308 307 615 18. Mizoram 5914 1808 7722 19. Nagaland 8040 7277 15317 20.
Odisha 32354 142798 175152 21. Punjab 37682 16508 54190 22. Rajasthan 318742 1777985 2096727 https://www.biochemjournal.com 23. Sikkim 7006 10518 17524 24.
Tamil Nadu 867898 387723 1255621 25. Telangana 222603 91085 313688 26. Tripura 2304 3204 5508 27. Uttar Pradesh 57963 245138 303101 28.
Uttarakhand 14941 11796 26737 29. West Bengal 10437 107259 117696 Total 6679434 7812443 14491877 (Source: Department of Agriculture & Farmers Welfare) In the table 6, during the year 2022-23, largest area covered by micro-irrigation (drip & Sprinkler irrigation)in different state such as Karnataka, Rajasthan, Maharashtra were found.
Conclusions
It is stated that throughout the past ten years, the population of various farm power sources in India has noticed an increase in mechanical power (tractor and power tiller, etc.). In 2020–21, the power available per hectare was 2.761 kW. The source power availability in India increased by 47.03 percent in 2020–21 compared to 2011–12 (262.921 million kW). In year 2022-23 sale of tractors and power tillers were observed 835,000 and 35,000 number in India. During the year 2022-23, the highest sales of the tractors in different state such as Uttar Pradesh, Madhya Pradesh and Maharashtra have been found to be 99968, 96853 and 85845.
References
9 in the original paper- Annual Report. Department of Agriculture and Farmers Welfare. Ministry of Agriculture and Farmers Welfare, New Delhi; c2021-22.
- Anonymous; Agricultural Statistics at a Glance. Govt. of India. Directorate of Economics and Statistics. Ministry of Agriculture and Farmers Welfare, New Delhi; c2022.
- Power Tiller Manufacturers Association (PTMA)
- Sing SP, Singh RS, Singh Surendra. Tractor production and sales in India. Agril. Eng. Today. 2009;33(1):20- 32.
- Singh Surendra. Engineering Interventions in Agriculture; National Seminar on Agricultural Engineering: The way to improve rural economy; c2011. p. 1-9.
- Singh RS, Singh S, Singh SP. Farm power availability and agriculture production scenario in India. Agric. Engg. Today. 2010;34(1):9-20.
- Singh RS, Singh Surendra, Singh SP. Farm Power and Machinery Availability on Indian Farms. Agril. Engg. Today. 2015;39(1):45-56.
- Singh SP, Singh Surendra. Farm Power Availability and its Perspective in Indian Agriculture. RASSA Journal of Science for Society. 2021;3(2):114-126.
- Tractor Manufactures Association of India (TMA) 10. www./Slideshare.net/ D.S. Balachandra Babu/ Farm Mechanization in India
Cited by 2
From OpenAlex, OpenCitations and reference lists read by Scinovex
- Influence of tillage on soil penetration resistance and maize performance in Ghana's coastal savannah agro-ecological zone ↗
Hans Fumba Murangaza, Francis Kumi, Shadrack Kwadwo Amponsah · Heliyon · 2026
Tillage practices tend to influence soil physical characteristics and the performance of crops. This study assessed the impacts of different tillage systems (i.e. two conservation tillage systems (no-tillage (NT) and harrowing only (H)) and two conventional tillage systems (ploughing only (P) and ploughing followed by harrowing (PH)) on soil penetration resistance and their impact on abontem maize variety growth and…
❝ 0PDF - Impact of Agricultural Credit by Commercial Banks on Agricultural GDP ↗
S. C. Asha, Dr Mahesh Ramaswamy, Santosh Kumar · SDMIMD Journal of Management · 2024
The farming sector in India has always been an essential and significant part of the country’s economy. Agriculture has long been a significant employer of over 43% of the workforce and a large contributor to the nation’s Gross Domestic Product (GDP), (14.39%) but it has also experienced difficulties including exploitation and uneven regulations. Despite these challenges, agriculture remains essential for…
❝ 0PDF