
Research article · 2024 · Full text
International Journal of Agriculture Extension and Social DevelopmentAssessing the status and needs of dairy farmers in Uttar Pradesh
Volume 7(3S) · Pages 113–117 · DOI: 10.33545/26180723.2024.v7.i3sb.407 ↗
Research areasLivestock Management and Performance ImprovementAgricultural Economics and PracticesAgricultural Systems and Practices
Abstract
Author-writtenThis study investigated farming practices in Uttar Pradesh, India. Researchers surveyed farmers across numerous villages, blocks, and districts within the state. The study found that a significant portion of farmers were middle-aged. Most farm families were of medium size, and the majority of farmers owned their land. However, many farmers operated small landholdings and had limited annual income. Despite this, a high percentage of respondents used ATMs for financial transactions, and many also utilized digital payment platforms. Farmers typically owned several animals, primarily for milk production, and incurred substantial expenses related to animal feed, treatment, and pesticides. The study also highlights a need for improved knowledge and adoption of advanced practices in dairy farming. Areas such as breeding, feeding, management, and healthcare require further attention from both government and social organizations to bridge the technological gap and achieve self-sufficiency in the dairy sector. The study revealed a gap in the farmers' technical knowledge and the adoption of modern dairy farming practices. However, the farmers expressed a strong desire for support, including improved infrastructure and access to experts in relevant fields. This suggests a willingness to learn and adopt new methods to enhance their farm businesses.
Summary
Source-checkedPlain-language reading of the full paper, prepared with AI and checked against the text. Each point links to the authors' own words.
Why it matters
- India is the world's leading milk producer, with a total production of 230.58 million tonnes in 2022-23. View evidence ↗
- Uttar Pradesh is the top dairy-producing state in India, accounting for 15.72% of the national total. View evidence ↗
- Despite its leadership, the productivity of Uttar Pradesh's dairy sector is hindered by a lack of modern practices and technical knowledge among farmers. View evidence ↗
The question
- The study aimed to analyze the socio-economic status of dairy farmers, including age, land, and animal holdings, and identify factors that could facilitate improvement. View evidence ↗
What they did
- The research was conducted during 2020-21 across 275 villages, 33 blocks, and 15 districts in Uttar Pradesh. View evidence ↗
- Data analysis was performed using descriptive statistics, specifically frequency, averages, and percentages. View evidence ↗
What they found
- The average age of the surveyed farmers was 48 years, with the largest group (34.78%) falling between 46 and 60 years old. View evidence ↗
- Most farm families were of medium size, with 55.38% consisting of 5 to 8 members. View evidence ↗
- Over 95% of farmers owned their land, though the majority (67.19%) held small plots of 1 to 3 acres. View evidence ↗
- Annual income was limited for many, with 52.44% of families earning less than 1.5 lakh. View evidence ↗
- Financial digitalization is prevalent, with 74.02% of farmers using ATM cards and 58.66% utilizing digital payment platforms. View evidence ↗
- On average, families held 2 milking cows and 2 buffaloes, and 1 of each other category (female/male calves, pregnant, and dry animals). View evidence ↗
- Farmers spent an average of Rs. 6,765 per month on feeding inputs for each animal. View evidence ↗
- Monthly expenditures for animal treatment averaged approximately Rs. 933 per farmer. View evidence ↗
- A vast majority (756 farmers) identified a need for services such as artificial insemination, mobile veterinary care, animal insurance, and technical knowledge. View evidence ↗
What it means
- The authors recommend implementing regular expert-led workshops to educate farmers on modern management, nutrition, and technology. View evidence ↗
- The study encourages the formation of self-help groups to reduce risk and suggests pursuing collective milk processing to increase revenue. View evidence ↗
Visual summary
3 visualsIllustrations explain the paper; charts are replotted from the paper's own table values.
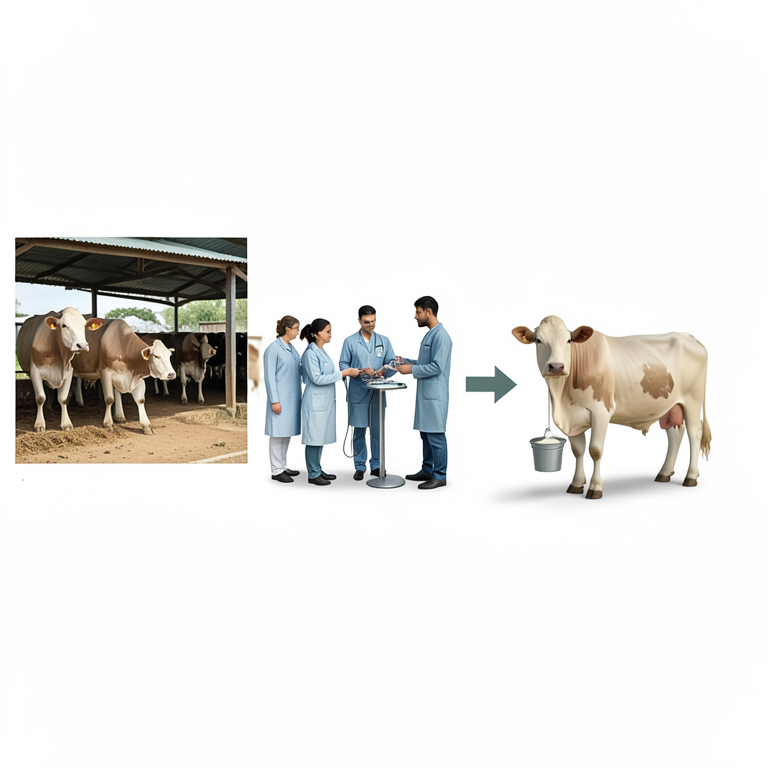
Knowledge Gap and Support Cycle
AI-generated conceptual illustration (Indian Holstein-Friesian crossbred cows and dairy farmers in Uttar Pradesh). It explains the idea and does not show study data.
View source evidence ↗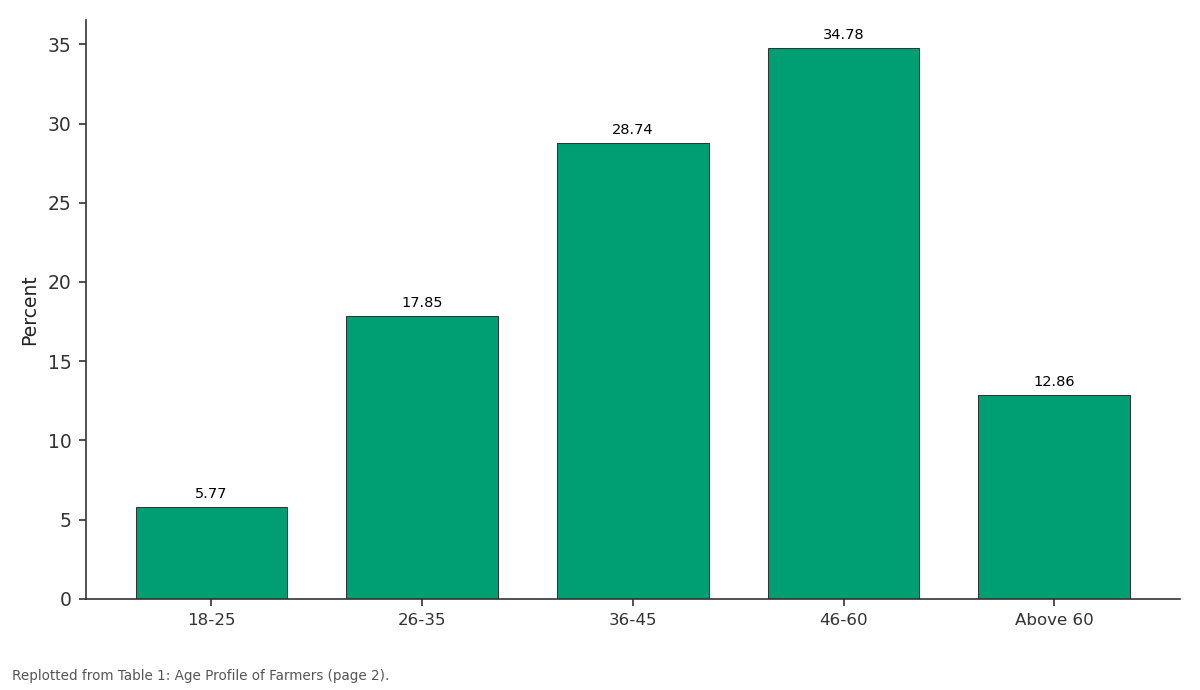
Percent: 18-25 vs 26-35 vs 36-45 vs 46-60 vs Above 60
Replotted from Table 1 (page 2) of the original paper. Every bar is the paper's own table value.
View source evidence ↗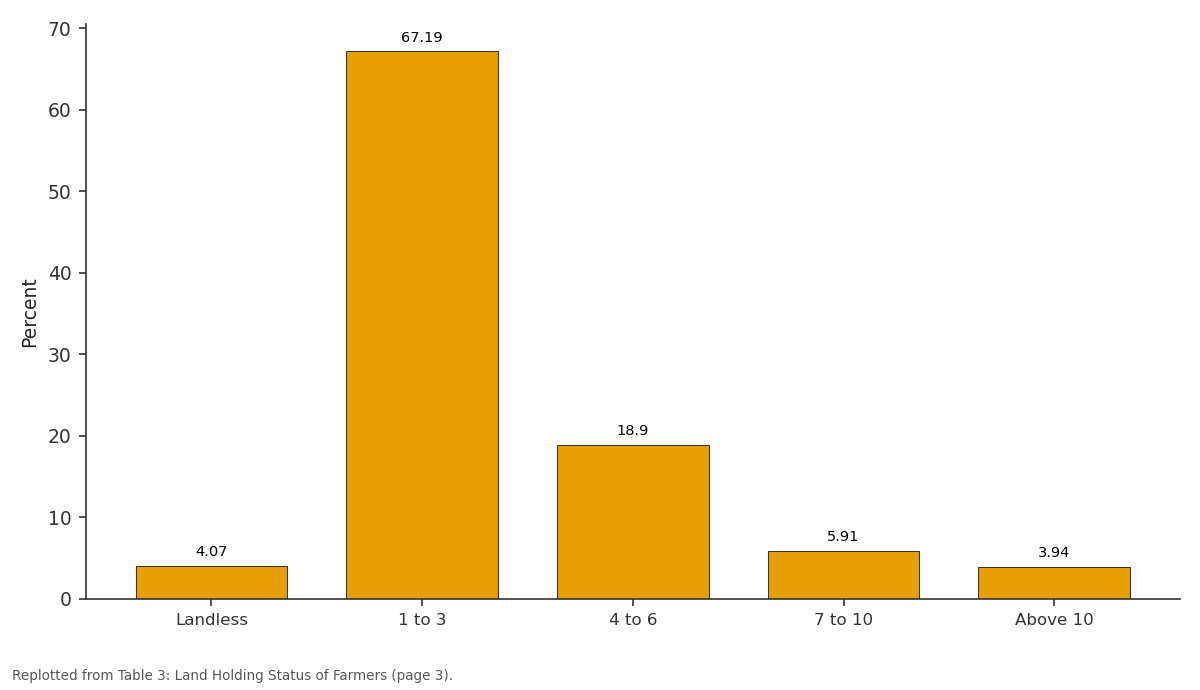
Percent: Landless vs 1 to 3 vs 4 to 6 vs 7 to 10 vs Above 10
Replotted from Table 3 (page 3) of the original paper. Every bar is the paper's own table value.
View source evidence ↗Figures & tables
From the original paper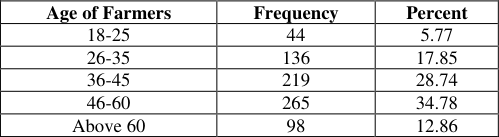 Table 1
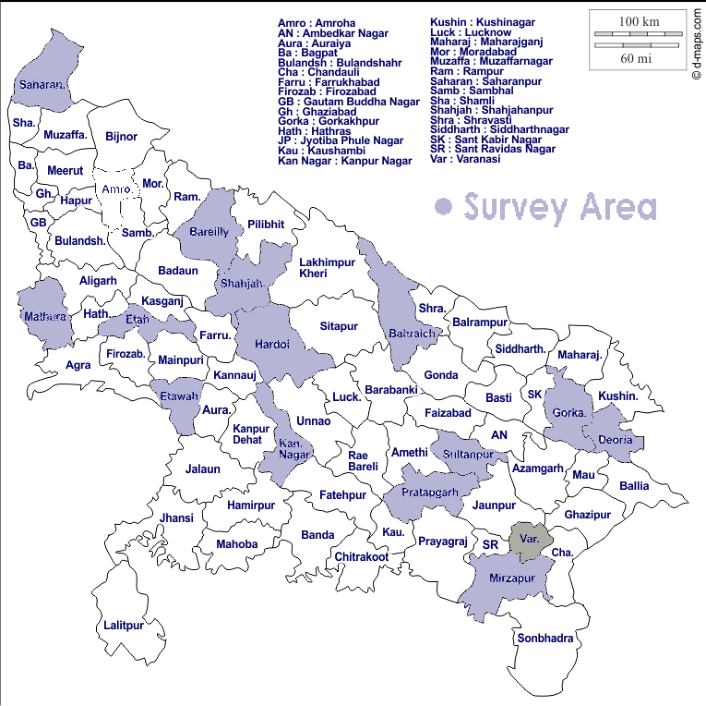 Figure 1
 Table 2
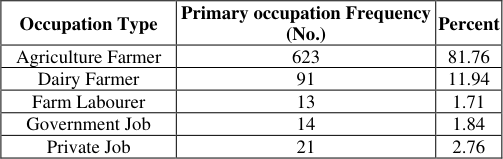 Table 5
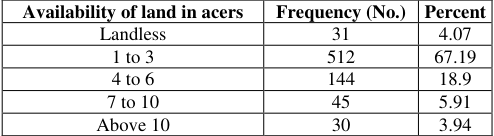 Table 3
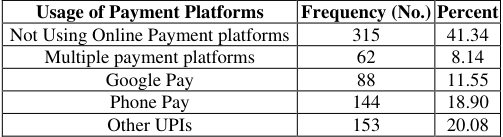 Table 6
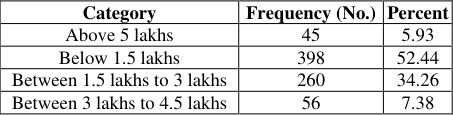 Table 4
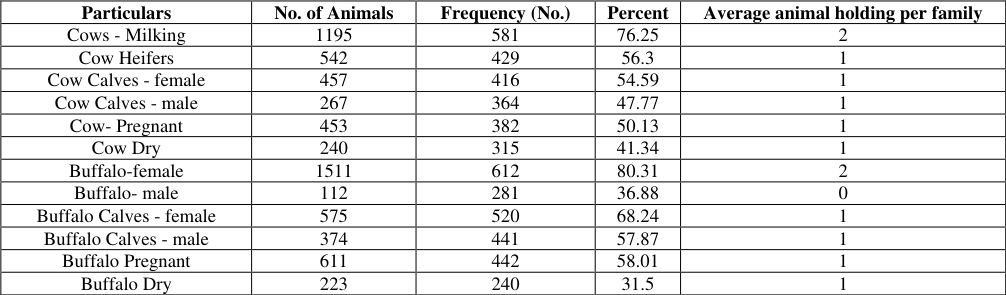 Table 7
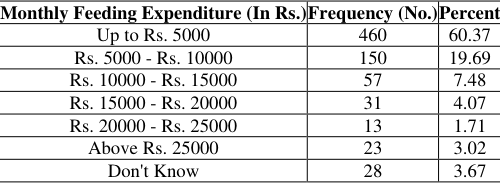 Table 8
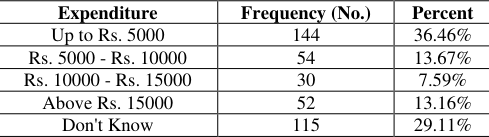 Table 10
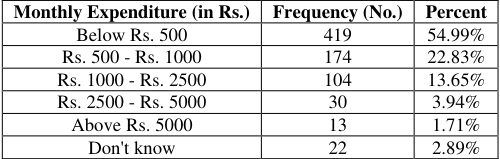 Table 9
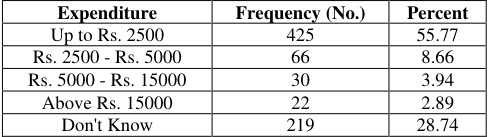 Table 11
Introduction
India continues to be the largest producer of milk in world. Total milk production in the country is 230.58 million tonnes during 2022-23. India ranks 1st in the world in terms of total milk production. (Source: FAO). The milk production has increased by 3.83% over the previous year (2021-22). The per-capita availably of milk is 459 grams per day. Top 5 Milk producing States are: Uttar Pradesh (15.72%), Rajasthan (14.44%), Madhya Pradesh (8.73%), Gujarat (7.49%), Andhra Pradesh (6.70%). They together contribute 53.08% of total Milk production in the country (Source-BasicAnimalHusbandryStatistic-2023 https://dahd.nic.in/sites/default/filess/BAHS2023.pdf). Uttar Pradesh stands tall as the undisputed leader in India's dairy sector contributing 15.72% share of total milk production of India. But the studies reveal a lack of technical knowledge and modern practices among some farmers, hindering optimal productivity. Uttar Pradesh's dairy sector presents a promising picture. With continued government efforts, advancements in technology, and increased farmer awareness, the state is well-positioned to further strengthen its leadership in the national dairy landscape. In view of the above this study was conducted with the following main objectives: To study socio-economic parameters of dairy farmers with respect to age, land and animal holding capacity To know primary and secondary occupation, different type of animal expenses, bank holding details To highlight facilitating factors that could help promoting dairy development to improve socioeconomic status of milk producers.
Materials and Methods
The present investigation was carried out during the year 2020-21 in 15 districts 33 blocks 275 villages of Uttar Pradesh state. Objective of the study was to analyse the status of the dairy farmers with their requirement in the selected area. Average fifty farmers were selected from each district for the present study making a total sample size of 750 farmers. This survey was made for understanding the customers involved in dairy and agricultural activities.
Formats were prepared for collecting the responses from the farmers. Details as of coverage area with other details are as [7] in his study reported majority of respondents were in middle age group. (2020) [7] reported The average size of family in the sample was 7.66 persons with 4.12 male members and 3.53 female www.extensionjournal.com members. State-wise differentials shows that on an average there were 8.74 members per household in Bihar, followed by Uttar Pradesh (6.76 members) and Maharashtra (6.17 members).
Land Holding
More than 95% farmers having their own land Majority out of which (67.19%) of the farmers had small size of land 1 to 3 landless (4.07%), 4 to 6 (18.9%), 7 to 10 (5.91%) and 3.94% have above 10 acers land. Potdar et al (2020) [7] observed 90.3% farmers were those who owned land nearly 56% of the land owners were Marginal farmers (owning 0.1 -1 ha of land), 23% were small (1.1-2 ha) land owners while about 12% farmers owned above 2 ha of land. Ravinder Kumar et al (2020) [8] reported Maximum (35%) farmers were small (landholding up to 0.93-1.69 ha) and minimum (05.5%) were landless farmers followed by marginal (landholding 0.08-0.84 ha) farmers (33.5%), medium (landholding 1.77-2.53 ha) farmers (15.5%) and large (landholding above 2.53 ha) farmers (10.5%), respectively Annual Income: nearly (52.44%) surveyed families were shown their annual income below 1.5 lakh. 34.26% families were between ranges of 1.5 lakh to 3 lakh, 7.38% families between 3 lakh to 4.5 lakh while 5.93% families have income above 5 lakhs. This clearly suggests that livelihood options are limited and source for sustainable income generation are lacking among the major populace. Major proportion of family income comes from primary occupation and it is noticed that agriculture was the largest type of primary occupation in the survey area. Along with the primary occupation, additional income source of the respondents. Agriculture Farmer, Dairy Farmer, Farm Labourer, Government Job, Private Job similar findings were reported by Ravinder Kumar et al (2020) [8] where (89%) belonged to agriculture followed by dairy (8%), service (2.5%) and business (0.5%). [4] in his study shown 95% respondent were having a bank account and 74% of the respondents were educated toward the new method of payment system i.e. digital payment, 72% of the respondents were open towards the new method of payment 31% of the respondents using Google Pay and only 2% were using BHIM app which was astonishing [7] number of cows and buffaloes were owned by the farmers of Uttar Pradesh were 1.60 cows & 1.42 buffaloes. Ravinder Kumar et al (2020) [8] reported the average herd size was 2.89 dairy animals per household followed by 1.15 cattle and 1.75 buffalo per households in their study area. www.extensionjournal.com Monthly Expenditure on Feeding Inputs for Animals: 96.33% farmers provided their responses on the monthly expenditure on feeding inputs for animals. On average, Rs. 6,765 monthly was spend for each animal by each farmer. Vivek Pratap Singh (2017) [5] reported The annual feed cost for per milch animal estimated to Rs.19191.7. In which 11.00% of green fodder, 12.69% of dry roughages and 76.30% of concentrates.
Conclusion
The study highlighted a strong demand for accessible expert guidance and educational opportunities for dairy farmers in the region. It recommends regular workshops and meetings led by experts to introduce farmers to the latest technologies, management strategies, and optimized animal nutrition. Additionally, the study emphasizes the power of collaboration, noting the significant advantages self-help www.extensionjournal.com groups offer dairy farmers. These groups promote income growth by reducing shared risks and ensuring fair profit sharing. The study strongly encourages the formation and active participation in such groups. Furthermore, it suggests exploring value-added activities like collective milk processing within these groups to unlock additional revenue streams. Finally, empowering women within these groups through financial management roles and access to loans could boost both their individual success and the collective well-being of the group.
Figures and tables from the paper
| Age of Farmers | Frequency | Percent |
|---|---|---|
| 18-25 | 44 | 5.77 |
| 26-35 | 136 | 17.85 |
| 36-45 | 219 | 28.74 |
| 46-60 | 265 | 34.78 |
| Above 60 | 98 | 12.86 |
Table text extracted from the original PDF; superscript letters are shown inline. The original table image is below.
View original table image
| Category | Frequency (No.) | Percent |
|---|---|---|
| Up to 4 members | 119 | 15.62% |
| 5 - 8 members | 422 | 55.38% |
| Above 8 members | 221 | 29.00% |
Table text extracted from the original PDF; superscript letters are shown inline. The original table image is below.
View original table image
| Occupation Type | Primary occupation Frequency (No.) | Percent |
|---|---|---|
| Agriculture Farmer | 623 | 81.76 |
| Dairy Farmer | 91 | 11.94 |
| Farm Labourer | 13 | 1.71 |
| Government Job | 14 | 1.84 |
| Private Job | 21 | 2.76 |
Table text extracted from the original PDF; superscript letters are shown inline. The original table image is below.
View original table image
| Availability of land in acers | Frequency (No.) | Percent |
|---|---|---|
| Landless | 31 | 4.07 |
| 1 to 3 | 512 | 67.19 |
| 4 to 6 | 144 | 18.9 |
| 7 to 10 | 45 | 5.91 |
| Above 10 | 30 | 3.94 |
Table text extracted from the original PDF; superscript letters are shown inline. The original table image is below.
View original table image
| Usage of Payment Platforms | Frequency (No.) | Percent |
|---|---|---|
| Not Using Online Payment platforms | 315 | 41.34 |
| Multiple payment platforms | 62 | 8.14 |
| Google Pay | 88 | 11.55 |
| Phone Pay | 144 | 18.90 |
| Other UPIs | 153 | 20.08 |
Table text extracted from the original PDF; superscript letters are shown inline. The original table image is below.
View original table image
| Category | Frequency (No.) | Percent |
|---|---|---|
| Above 5 lakhs | 45 | 5.93 |
| Below 1.5 lakhs | 398 | 52.44 |
| Between 1.5 lakhs to 3 lakhs | 260 | 34.26 |
| Between 3 lakhs to 4.5 lakhs | 56 | 7.38 |
Table text extracted from the original PDF; superscript letters are shown inline. The original table image is below.
View original table image
| Particulars | No. of Animals | Frequency (No.) | Percent | Average animal holding per family |
|---|---|---|---|---|
| Cows - Milking | 1195 | 581 | 76.25 | 2 |
| Cow Heifers | 542 | 429 | 56.3 | 1 |
| Cow Calves - female | 457 | 416 | 54.59 | 1 |
| Cow Calves - male | 267 | 364 | 47.77 | 1 |
| Cow- Pregnant | 453 | 382 | 50.13 | 1 |
| Cow Dry | 240 | 315 | 41.34 | 1 |
| Buffalo-female | 1511 | 612 | 80.31 | 2 |
| Buffalo- male | 112 | 281 | 36.88 | 0 |
| Buffalo Calves - female | 575 | 520 | 68.24 | 1 |
| Buffalo Calves - male | 374 | 441 | 57.87 | 1 |
| Buffalo Pregnant | 611 | 442 | 58.01 | 1 |
| Buffalo Dry | 223 | 240 | 31.5 | 1 |
Table text extracted from the original PDF; superscript letters are shown inline. The original table image is below.
View original table image
| Monthly Feeding Expenditure (In Rs.) | Frequency (No.) | Percent |
|---|---|---|
| Up to Rs. 5000 | 460 | 60.37 |
| Rs. 5000 - Rs. 10000 | 150 | 19.69 |
| Rs. 10000 - Rs. 15000 | 57 | 7.48 |
| Rs. 15000 - Rs. 20000 | 31 | 4.07 |
| Rs. 20000 - Rs. 25000 | 13 | 1.71 |
| Above Rs. 25000 | 23 | 3.02 |
| Don't Know | 28 | 3.67 |
Table text extracted from the original PDF; superscript letters are shown inline. The original table image is below.
View original table image
| Expenditure | Frequency (No.) | Percent |
|---|---|---|
| Up to Rs. 5000 | 144 | 36.46% |
| Rs. 5000 - Rs. 10000 | 54 | 13.67% |
| Rs. 10000 - Rs. 15000 | 30 | 7.59% |
| Above Rs. 15000 | 52 | 13.16% |
| Don't Know | 115 | 29.11% |
Table text extracted from the original PDF; superscript letters are shown inline. The original table image is below.
View original table image
| Monthly Expenditure (in Rs.) | Frequency (No.) | Percent |
|---|---|---|
| Below Rs. 500 | 419 | 54.99% |
| Rs. 500 - Rs. 1000 | 174 | 22.83% |
| Rs. 1000 - Rs. 2500 | 104 | 13.65% |
| Rs. 2500 - Rs. 5000 | 30 | 3.94% |
| Above Rs. 5000 | 13 | 1.71% |
| Don't know | 22 | 2.89% |
Table text extracted from the original PDF; superscript letters are shown inline. The original table image is below.
View original table image
| Expenditure | Frequency (No.) | Percent |
|---|---|---|
| Up to Rs. 2500 | 425 | 55.77 |
| Rs. 2500 - Rs. 5000 | 66 | 8.66 |
| Rs. 5000 - Rs. 15000 | 30 | 3.94 |
| Above Rs. 15000 | 22 | 2.89 |
| Don't Know | 219 | 28.74 |
Table text extracted from the original PDF; superscript letters are shown inline. The original table image is below.
View original table image
References
8 in the original paper- Deka RP, Magnusson U, Grace D, Randolph TF, Shome R, Lindahl JF. Estimates of the Economic Cost Caused by Five Major Reproductive Problems in Dairy Animals in Assam and Bihar, India. Animals. 2021;11:3116. https://doi.org/10.3390/ani11113116
- Devaki K, Senthilkumar K, Subramanian R. Socioeconomic profile of livestock farm women of Thiruvallur district, Tamil Nadu. Int J Sci Environ. 2015;4(5):1322-1329.
- Hai A, Akand AH, Shanaz S, Bulbul KH. Contribution of farm women towards dairy enterprise in Ganderbal district of Kashmir valley. J Dairying Foods Home Sci. 2011;30(2):140-146.
- Jimmy Jose and Dr. Sebastian Tharapil Joseph. Effects of digital payment system and its impact on saving of individual with special reference to Kaushambi during Covid -19. The Pharma Innovation Journal. 2021;SP10(9):168-173.
- Mayank Dubey, Vivek Pratap Singh, R.K. Pandey and A.K. Chaubey. Economic Analysis of Feeding Management and Milk Production at the University Dairy Farm. Int J Curr Microbiol Appl Sci. 2017;6(2):480-486.
- Panchasara HH, Patel JS, Patel PR. Economic implications of brucellosis in bovine. Indian J Vet Sci Biotechnol. 2012;8:19-21.
- Potdar VV, Gaundare YS, Khadse JR, Joshi S, Swaminathan M. Socio-economic Survey of Uttar Pradesh, Bihar and Maharashtra States of Indian Continent. Asian J Agric. Ext Econ Sociol. 2020;38(4):75-81. https://doi.org/10.9734/ajaees/2020/v38i430339
- Ravinder Kumar, Naresh Prasad, Anil Kumar, T V Raja, and A K Das. Cattle production system in doab area of Uttar Pradesh. Indian J Anim. Sci. 2020;90(1):90-93. https://doi.org/10.56093/ijans.v90i1.98228