
Research article · 2024 · Full text
International Journal of Veterinary Sciences and Animal HusbandryProximate and phytochemical composition of Shea Nut Cake in Borgu, Niger State, Nigeria
Volume 9(2) · Pages 147–150 · DOI: 10.22271/veterinary.2024.v9.i2c.1188 ↗
Research areasAfrican Botany and Ecology Studies
Abstract
Author-writtenShea nut cake (SNC), a major by-product from Shea butter production has proximate nutrients which are not readily available for utilization by animals due to the presence of anti-nutritional factors, mainly the obromine, saponin and tannins. The present work evaluated the effectiveness of physical processing methods on samples (A - unprocessed Shea nut cake, B – soaked in water for 48 hours, rinsed, strained and sun dried; C – soaked for 48 hours by changing of water after 24 hours, rinsed, strained and sun dried; D - soaked in water for 72 hours by changing of water after every 24 hours, rinsed, strained and sun dried; E - soaked in water for 72 hours, rinsed, strained and sun dried; F- boiled up to 101 oC and sun dried) for reducing the anti-nutritional factors present in the she nut cake. The proximate composition analysis result showed that SNC was high in protein (8.33 to 13.99%) and ether extract (8.49 to 11.88%). The increasing order for effectiveness of the processing methods in reducing the tannin content of SNC was as follows: F
Summary
Source-checkedPlain-language reading of the full paper, prepared with AI and checked against the text. Each point links to the authors' own words.
Why it matters
- Using agro-industrial by-products for livestock feed is necessary because conventional feed ingredients can account for approximately 70% of total production costs. View evidence ↗
- Shea nut cake (SNC) is a significant by-product of shea butter production that contains nutrients, but its utility for animals is limited by anti-nutritional factors like theobromine, saponin, and tannins. View evidence ↗
- Anti-nutritional factors are plant-based defensive mechanisms that can interfere with an animal's health, production, and ability to utilize nutrients when used in feed. View evidence ↗
The question
- The study aimed to evaluate various processing methods to reduce anti-nutritional factors in shea nut cake and determine the resulting proximate composition. View evidence ↗
What they did
- The research was carried out at the National Institute for Freshwater Fisheries Research (NIFFR) in New Bussa, Niger State. View evidence ↗
- Samples of shea nut cake were collected from Karabonde village in Borgu, Niger State, with 30 g portions used for six different treatment groups. View evidence ↗
- Each treatment was replicated three times and analyzed for theobromine, saponin, and tannin content. View evidence ↗
What they found
- Proximate analysis revealed that shea nut cake had protein levels ranging from 8.33% to 13.99% and ether extract levels from 8.49% to 11.88%. View evidence ↗
- The highest mean dry matter content (97.78%) was found in samples soaked for 72 hours with water changed every 24 hours (Sample D). View evidence ↗
- The boiled sample (F) had the highest mean crude protein at 13.99%, while the sample soaked for 48 hours with water changes (B) had the lowest at 8.33%. View evidence ↗
- Sample D (72-hour soak with water changes) had a significantly higher ether extract content (11.88%) compared to Sample B (10.99%). View evidence ↗
- The highest metabolisable energy was observed in Sample D at 3636.81 Kcal/kg. View evidence ↗
- While processed samples had lower tannin levels than the control, the values for theobromine and saponin in all processed samples remained higher than the tolerable levels for poultry. View evidence ↗
Visual summary
2 visualsIllustrations explain the paper; charts are replotted from the paper's own table values.
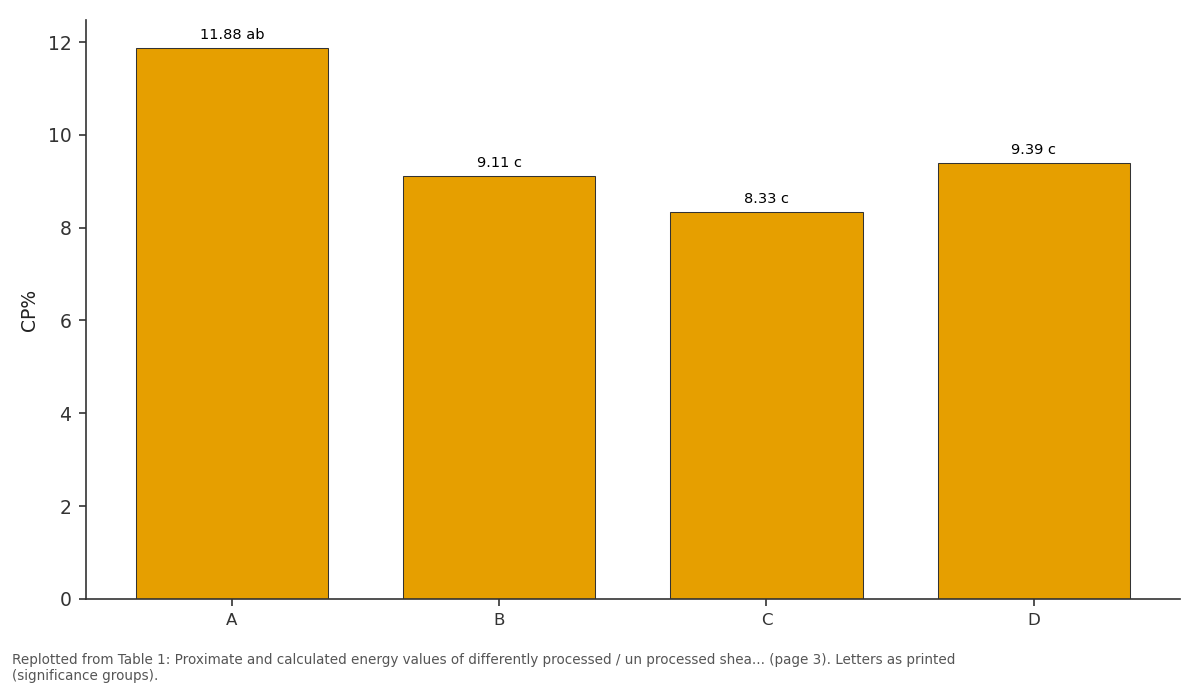
CP%: A vs B vs C vs D
Replotted from Table 1 (page 3) of the original paper. Every bar is the paper's own table value.
View source evidence ↗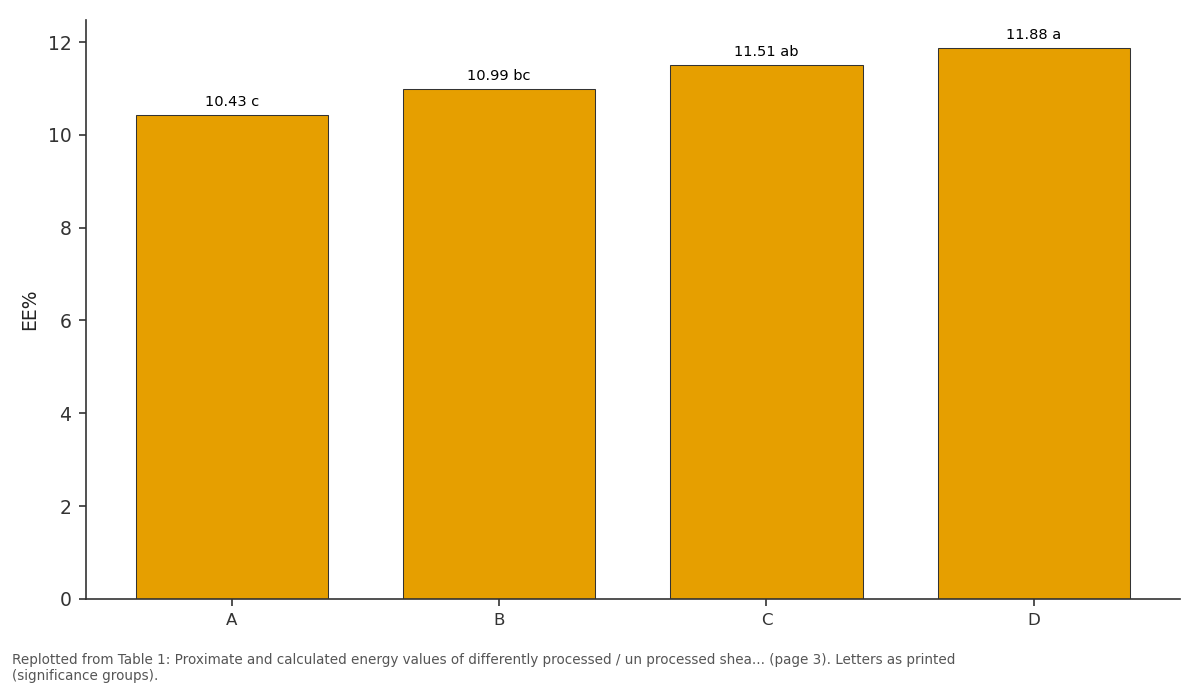
EE%: A vs B vs C vs D
Replotted from Table 1 (page 3) of the original paper. Every bar is the paper's own table value.
View source evidence ↗Figures & tables
From the original paper Table 1
 Table 2
Introduction
Livestock industry depends greatly on nutrition as the main driving forces to efficiency of production. Necessity for the use of agro-industrial by-products in livestock feed production has been ascribed to the high cost of feeding which constitutes about 70% of total cost of production with the use of conventional feed ingredients (Okai et al., 2005) [15] . The use of agroindustrial by -products tends to reduce the cost of feeding livestock and reduce the magnitude of competition between man and farm animals for feed and food ingredients, it will also reduce pollution of environment (Okai et al., 1984) [18] . Shea is a wild fruit seasonally gathered by the local communities for industrial processors, it is currently undergoing renewed demand from high value cosmetics companies (Garba and Sanni, 2015) [8] . Shea nut trees grow mostly in dry savannah belt of West Africa among which is the north central region of Nigeria, they also occur in all the states within the sudan-sahelian region of Nigeria of which two species have been identified based on distribution; Vitellaria paradoxa and Vitellaria nilotica (Garba and Sanni, 2015) [8] . Shea butter trees are found in all the agricultural zones of Niger State (Suleiman, 2008) [26] . After fat (Shea butter) extraction, a by-product, known as shea nut kernel cake (SNC) is produced in large quantities as a byproduct by shea butter producing industries, the composition of which depends on the method of extraction (i.e industrial or traditional cottage industry method) with the industrial methods tending to be more efficient at fat extraction (Dei et al., 2007) [7] . SNC contains amounts of crude protein (CP) and fat (Morgan and Trinder, 1980) [11] . Atuahene et al. (1998) [4] reported a CP of 16.24% and metabolizable energy (MJ/kg) of 7.12. SNC has also been found to contain some anti-nutritive factors as have been reported; saponins (Gohl, 1981) [9] , tannins (Okai, 1990) [17] , theobromine (Rhule, 1999) [23] , saponins and theobromine (Atuahene et al., 1998) [4] and saponins and tannins (Annongu et al., 1996) [3] . These anti-nutritional factors has however limited its use in poultry production as stated by D'Mello (2000) [5] that the presence of anti-nutritional factors in most plant feedstuffs limit their inclusion levels in the diets of livestock especially monogastrics.
Anti-nutritional factors are substances synthesized by plant, fungi and bacteria species as defensive mechanisms to avoid predation or survive harsh environmental conditions (Herbourne, 1989) [10] , these anti nutritional factors in turn interfere with nutrient utilisation, health and production of an animal when the plant residue is used as animal feed ingredient (Akande et al., 2010; Yacout, 2016) [2,28] . Reports from previous work carried out by Pobi, (2002) [21] ; Atuahene et al. (1998) [4] revealed that 2.5% SNC was not detrimental to broiler chickens. Inclusion of SNC at 5 and 10% levels in the diets of grower and finisher pigs respectively was recommended by Rhule (1995) [24] , while Morgan and Trinder, (1980) [11] recommended that 25 and 30% can be tolerated by ruminants. Both feed intake and weight gain response by animals fed SNC are relatively satisfactory when the inclusion level is moderate or limited (Pobi, 2002; Olorede and Longe (1999) [21,20] ; and (Atuahene et al. (1998) [4] . However, increase in inclusion level of SNC in the diet is inversely propotional to feed intake and weight gain in monogastrics. Proper processing of unconventional feed ingredients reduce the adverse effects of anti-nutritional factors thereby maximizing their nutritional value (Tengan et al., 2011; Dei, et al, 2012) [27,6] . Thus, the aim of this study was to determine the proximate composition of differently processed shea nut cake samples and evaluate some known improved methods of reducing its anti-nutritional factors.
Methodology Study Area
The study was conducted at the Integrated Farm Unit, Aquaculture and Biotechnology Department, National Institute for Freshwater Fisheries Research (NIFFR), New Bussa, Niger State. New Bussa is located between latitude 9˚52'59.0"North and longitude 4˚30'40.2'' East in the southern guinea savanna zone of north central Nigeria, with the minimum and maximum temperatures of 39 °C and 42 °C, respectively with a mean annual rainfall of about 1000 mm (Raji et al., 2011) [22] .
Shea nut cake Sample Collection
Shea nut cake sample was collected from Karabonde village in Borgu local government area of Niger state, and was measured into six (6) separate 500 ml beakers at 30 g per sample, (KERRO BL50001 electronic compact digital scale) was used for the weighing at the Central Laboratory of National Institute for Freshwater Fisheries Research (NIFFR) New Bussa. The beakers containing the samples were filled to mark with water and labelled A, B, C, D, E and F. 1. Sample A was the control and was not processed 2. Sample B was soaked for 48hours with the water content removed after 24 hours to replace with clean water, after the 48 th hour, it was then strained, rinsed and sundried. 3. Sample C was soaked for 48hours straight, followed by straining using a 1.2 mm mesh size net, rinsing and sundrying. 4. Sample D was soaked for 72 hours with the water content removed after 24 hours to replace with clean water, after the 72 nd hour, it was strained, rinsed and sundried. 5. Sample E was soaked for 72 hours after which it was strained, rinsed and sundried 6. Sample F was boiled up to boiling point of 101 0 C, rinsed, and sundried.
All the fermentation procedures used were aerobic. All the sundried residues were collected into polythene bags and labelled accordingly and stored at room temperature. Each treatment was replicated three times and samples from each treatment was assayed for contents of tannins, sapoin and theobromine to help determine the best method to be used for the sheanut cake to be added to layer feed.
Results and Discussion
The result of proximate and calculated energy values of differently processed and unprocessed sheanut cake are presented in Table 4.3. The dry matter content of the sheanut cake samples that was fermented for 72 hours by changing of the water after every 24 hours was significantly (p<0.05) the highest with a mean value of 97.78%, the mean dry matter content values obtained for all other water soaked processed samples (B, C and E) were significantly (p<0.05) higher than the mean dry matter content value obtained for control sample 'A', except for the sample that was heated up to boiling point 'F' that obtained a significantly (p>0.05) lower mean value of 91.92%. The mean values obtained for crude fiber content and calculated metabolisable energy contents of the samples had a similar pattern with the dry matter contents in each of the samples. The mean moisture content value of the boiled sample was significantly (p<0.05) higher than the moisture content of the control sample, while mean values of all other water soaked processed samples (B, C, D and E) were significantly (p>0.05) lower than the mean value obtained for control sample. The mean ash content of the boiled sample 'F' was significantly (p<0.05) higher than the mean value obtained for the control sample, the mean values obtained for all other water soaked processed samples were significantly lower in order of (E, B, C and D). The crude protein content of the boiled sample was significantly (p>0.05) higher with a mean value of 13.99% than the crude protein content of the sample that was soaked for 72 hours without changing of the water 'E', the sample that was soaked for 48 hours straight by changing of water at 24 hours interval obtained the significantly (p>0.05) lowest mean crude protein value of 8.33%. The ether extract content obtained for the sample that was soaked for 72 hours by changing of the water content after every 24 hours 'D' was significantly (p<0.05) higher with a mean value of 11.88% than the mean values obtained for sample soaked for 48 hours without changing of water at 24 hours intervals 'B'; with a mean value of 10.99%, this was significantly (p<0.05) higher than mean value obtained for the sample that was soaked for 72 hours. The nitrogen free extract content of the sample that was fermented for 72 hours straight 'E' was the highest with a mean value of 67.02% and it was significantly (p<0.05) different from the mean values obtained for control sample 'A' while the mean value obtained for the boiled sample 'F' was the lowest.
Metabolisable energy was highest for sample soaked for 72 hours by changing of the water content at an interval of 24 hours 'D', and it was significantly different from the value obtained for the sample soaked for 72 hours straight, the value obtained for the control sample was significantly higher than the value obtained for thee sample that was heated up to boiling point. Shea nut cake is composed of proximate constituents and phyto-chemical components in quantities that affect its suitability for use in animal feed especially mono gastrics. The results of proximate composition of the soaked sheanut cake samples are closely comparable to that of Abdl-mumeen, (2013) [1] who worked on the biochemical and microbiological analysis of Shea nut cake in and obtained proximate composition values of crude protein in the range of 10.37%-14.99%, carbohydrate ranged from 48.26% -74.16%, EE extract was in the range of 6.25%-36.50%, and crude fiber ranged between 7.11% -9.35%. The differences noticed in the mean values obtained for the control and boiled samples could be attributed therefore to the difference in the heat intensity applied to boil the sample and location where the sheanut cake sample was collected from. The moisture and crude protein contents of the result from this studies are comparable to the results of Musa, et al., (2021) [12] where they recorded moisture values range between 6.27%-10.44% and crude protein values to range between 8.23% -10.19%.
The mean Tannin values obtained for all the processed samples were lower than the tolerable level of tannin for poultry, more so, the sample D procedure gave us a better mean tannin value 6.00 mg/g compared to the lowest value obtained by Oddoye et al. (2012) [13] where they recorded 6.68 mg/g as the best value obtained for the sample that was treated using sodium hydroxide. Theobromine values obtained for the samples that was (Soaked for 72 hours by changing of water every 24 hours 'D', soaked for 48 hours straight 'C' and soaked for 72 hours straight 'E') 3.60 mg/g was better than the lowest value 5.40 mg/g recorded for chemically treated sample by Oddoye et al. (2012) [13] . These disagreement could however be attributed to the difference in geographic location from which the sheanut cake sample was collected. The saponin contents of the sheanut cake amounted more than the tolerable level for poultry also. Although, the mean values obtained for both theobromine and saponin contents in all the processed samples were higher than the tolerable levels for poultry production, the only signs / symptoms observed which could be a result of such high values was delay in the start of egg production as observed by Odunsi and Longe, (1995) [14] all the groups of Isa brown pullets that were fed with cocoa bean meal which was high in theobromine delayed start of egg production. The procedure of sample 'E' earlier described in the text had fairer values across the three anti-nutritional factors tested for and as a result, was used in the processing of the Shea nut cake used in the diets during this study. This phytochemical test results however, validates the assumption / observation by Oddoye et al. (2012) [13] , that the sheanut cake samples processed by soaking or washing in water gives lower level of tannin, which was attributed to the probability of shea nut cake containing a large proportion of tannins that are highly and readily soluble in water, due to their free hydroxyl groups involved in strong hydrogen bond interaction with water molecules. More so, Oddoye et al.
(2012) [13] observed that the higher the time the sample spent in the water or on heat, the lower the tannin content in the sheanut cake sample which is in agreement with Salim-Ur-Rehman et al. (2002) [25] and Oladele et al. (2009) [19] that the solubility of tannin is enhanced by the length of time and temperature. It was therefore, based on the results obtained for both proximate and anti-nutritional factors it can be concluded that the processing method which had fair values of the three anti-nutritional factors and proximate composition was the sample 'D' and can therefore, be recommended as an easy and practicable method for processing shea nut cake as a raw material for use in layer feed production. Pauzenga (1985). Key: A = control, B= soaked in water for 48 hours, C = soaked in water for 48 hours by changing of water at 24hrs interval, D= soaked in water for 72 hours by changing the water at 24 hrs interval, E = soaked in water for 72 hours, F = heated up to boiling point. 4 Key: A= control, B= water removed after every 24 hours and dried after 48hours, C= kept for 48 hours before draining the water and drying, D=water removed after every 24 hours and dried after 72 hours, E=kept for 72hours before draining the water and drying, F= heated up to boiling point, TL= tolerable levels. Tannin tolerable level reference
ME was calculated according to
ME was calculated according to
Acknowledgement
AcknowledgementsThe assistance of Mr. Haliru Salihu, of a casual staff of the integrated unit in sample processing and Mr. Usman Ibrahim a technical officer of the institute central laboratory in the analysis are highly acknowledged. This paper is published with the permission of the Executive Director of National Institute for Fresh Water Fisheries Research Institute, New Bussa, Nigeria.
Figures and tables from the paper
| Parameter | A | B | C | D | E | F | SEM | p-val | L/SIG |
|---|---|---|---|---|---|---|---|---|---|
| DM (%) | 94.12c | 96.62b | 97.78b | 96.65a | 96.82b | 91.83d | 0.51 | 0.00 | * |
| Moisture% | 5.88b | 3.18c | 3.38c | 2.22d | 3.35c | 8.17a | 0.51 | 0.00 | * |
| CF% | 4.09b | 8.57a | 8.85a | 9.25a | 9.20a | 2.77b | 0.67 | 0.00 | * |
| CP% | 11.88ab | 9.11c | 8.33c | 9.39c | 9.91bc | 13.99a | 0.52 | 0.00 | * |
| EE% | 10.43c | 10.99bc | 11.51ab | 11.88a | 8.49d | 10.21c | 0.28 | 0.00 | * |
| Ash% | 19.65b | 1.96c | 1.84c | 1.45c | 2.04c | 29.64a | 2.71 | 0.00 | * |
| NFE% | 45.47b | 66.21a | 66.11a | 65.81a | 67.02a | 32.31c | 3.27 | 0.00 | * |
| ME(Kcal/kg) | 2883.28c | 3567.77a | 3579.38a | 3636.81a | 3420.66b | 2471.75d | 105.55 | 0.00 | * |
Table text extracted from the original PDF; superscript letters are shown inline. The original table image is below.
View original table image
| Sample Identification | Tannin mg/g | %reduction | Theobromine mg/g | %reduction | Saponin mg/g | %reduction |
|---|---|---|---|---|---|---|
| A | 43.30 | - | 9.00 | - | 107.0 | - |
| B | 9.31 | 21.50 | 5.40 | 60.00 | 61.7 | 57.66 |
| C | 9.85 | 22.75 | 10.80 | 120.00 | 67.7 | 63.27 |
| D | 15.10 | 34.87 | 3.60 | 40.00 | 58.5 | 54.67 |
| E | 6.00 | 13.86 | 3.60 | 40.00 | 69.6 | 65.05 |
| F | 5.54 | 12.79 | 3.60 | 40.00 | 152.0 | 142.06 |
| TL | 2.00 | 0.3 | 0.4 |
Table text extracted from the original PDF; superscript letters are shown inline. The original table image is below.
View original table image
References
22 in the original paper- Abdul-Mumeen I, Zakpaa HD, Mills-Robertson FC. Proximate and biophytochemical properties of Shea nut cake. J Chem Pharm Res. 2013;5(12):961-970. ISSN: 0975-7384.
- Akande KE, Doma UD, Agu HO, Adamu HM. Major antinutrients found in plant protein sources: their effect on nutrition. Pak J Nutr. 2010;9:827-832.
- Annongu AA, Termeulen U, Atteh JO, Apata DF. Response of broilers to dietary treated and untreated shea butter cake supplemented with molasses. Land bauforsch Volkenrode Sonderheft. 1996, 295-300.
- Atuahene CC, Donkoh A, Asante F. Value of Shea nut cake as a dietary ingredient for broiler chickens. Anim Feed Sci. Technol. 1998;73:133-142.
- Dei HK, Yaro D, Mohammed A. Effects of soaked false yam (Icacina oliviformis) seed meal on growth performance of layer chickens. In: Proceedings of the 30th Ghana Animal Science Association Conference. Accra: Animal Research Institute; 2012. p. 34-40.
- Dei HK, Rose SP, Mackenzie AM. Shea nut (Vitellaria paradoxa) as a feed ingredient for poultry. Worlds Poult Sci J. 2007;63:611-624.
- Garba ID, Sanni SA. Profit potential of Shea nut processing in Bosso and Borgu local government areas of Niger state. Int. J Adv Sci Technol. 2015;77:41-58.
- Gohl B. Tropical Feeds: Feed information summaries and nutritive values. FAO Animal Production and Health Series. 1981;12:529.
- Herbourne J. Biosynthesis and functions of antinutritional factors in plants. Asp Appl Biol. 1989;21:2128.
- Musa TU, Monday M, Isah LI, Awwal A, Paiko MA, Alkali M. Preliminary Studies on Biofuel Potentials of Shea Nut Cakes in Niger State, Nigeria. Caliphate J Sci Technol. 2021;6:76-82.
- Oddoye EOK, Alemawor F, Agyente-Badu K, Dzogbefia VP. Proximate analysis of Shea nut kernel cake/meal samples from industry and cottage industry and some methods of removal of anti-nutritional factors. Int J Biochem Biotechnol. 2012;1(9):239-242. ISSN: 21693048. [Internet]. Available from: http://internationalscholarsjournals.org.
- Odunsi AA, Longe OG. Cocoa bean cake in poultry diets I. Chemical composition and nutritive value of cocoa bean cake in pullet chick diets. J Appl Anim Res. 1995;8:91-97.
- Okai DB, Abora PKB, Davis T, Martin A. Nutrient composition, availability, current and potential uses of Dusa: A cereal by-product obtained from Koko (porridge) production. J Sci Technol. 2005;25:33-42.
- Okai DB, Easter RA, Frank GR. The nutritive value of some non-conventional Ghanaian feed ingredients: Nutrient composition and effects on performance of weanling rats. World Rev Anim Prod. 1989;25(2):11-16.
- Okai DB. Seed cake tried in Ghana. Pig Integration. 1990;20:28.
- Okai DB, Easter RA, Frank GR. The nutritive value of some non-conventional Ghanaian feed ingredients: Nutrient composition and effects on performance of weanling rats. World Rev Anim Prod. 1984;20:11-16.
- Oladele KA, Osundahunsi FO, Adebowale AY. Influence of Processing Techniques on the Nutrients and Antinutrients of Tigernut (Cyperus esculentus). World J Dairy Food Sci. 2009;4:88-93.
- Olorede BR, Longe OG. Growth, nutrient retention, haematology and serum chemistry of pullet chicks fed shea butter cake in the humid tropics. Arch Zootech. 1999;48:441-444.
- Rhule S. Performance of pigs on diets containing detoxified sheanut cake. Trop Anim Health Prod. 1999;31:45-53.
- Rhule SW. Evaluation of Shea nut cake as feedstuff for pigs in Ghana: Growth rate and. Legon Agric Res Extens J. 1995;2:41-47.
- Salim-Ur-Rehman, Kausar A, Naureen S, Nighat B, Asima S. Effect of Time and Temperature on Infusion of Tannins from Commercial Brands of Tea. Int J Agric Biol. 2002;4:285-287.
- Yacout H. Anti-nutritional factors and its roles in animal nutrition. J Dairy Vet Anim Res. 2016;4(1):00107.